For eighteen years I followed the sea, took what it offered. It has brought me shipwreck and success, sorrow, danger, and unutterable happiness. ~ Henry de Monfreid
SUBSCRIBE TO THE MONDAY DIRTY DOZEN HERE
Good morning!
In this week’s Dirty Dozen [CHART PACK] we look at the total returns ytd for the major asset classes, then we discuss why stocks performed as well as they did, followed by further talk on stretched sentiment, note some strange action in fund flows, and point out a few good looking chart setups in the gold mining and E&P space. Let’s dive in…
- Only two more days left in the trading year. Here’s the report card on the total returns per asset class via BofAML. What a difference a year makes… In 18’ cash was the top performer at 1.8% while every other asset outside of US Treasuries was down on the year. This year, everything was positive with stocks turning in a blockbuster performance with the SPX returning over 30%.

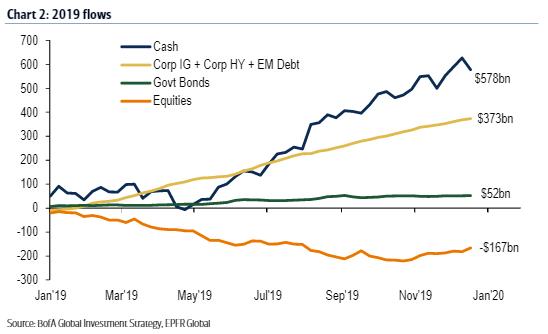
- What’s interesting though is that cash — the lowest returning asset this year — happened to be the asset class that investors loved most. Over half-a-trillion dollars flowed into cash this year while investors sold over $160bn net of equities (chart via BofAML).
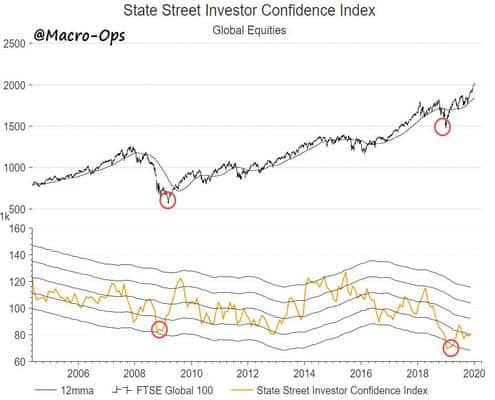
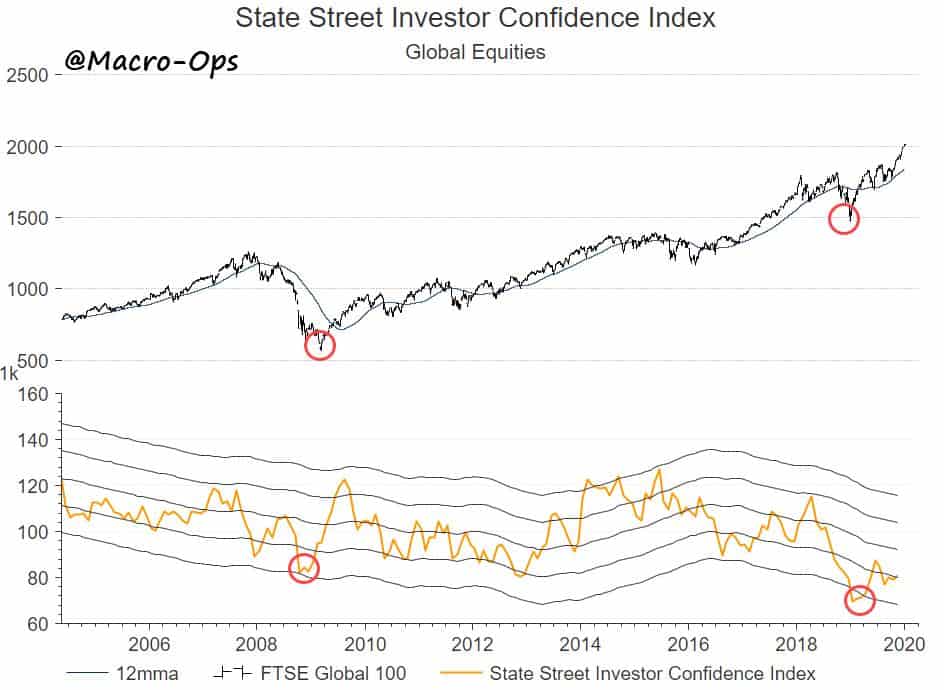
- Why did stocks perform so well this year? Well, investors were expecting the GFC Redux and positioned accordingly but economic armageddon never came. This chart from State Street shows how fund manager’s confidence in equities hit an all-time low in Dec 18’ (over 2 SDs below its 3yr rolling average).
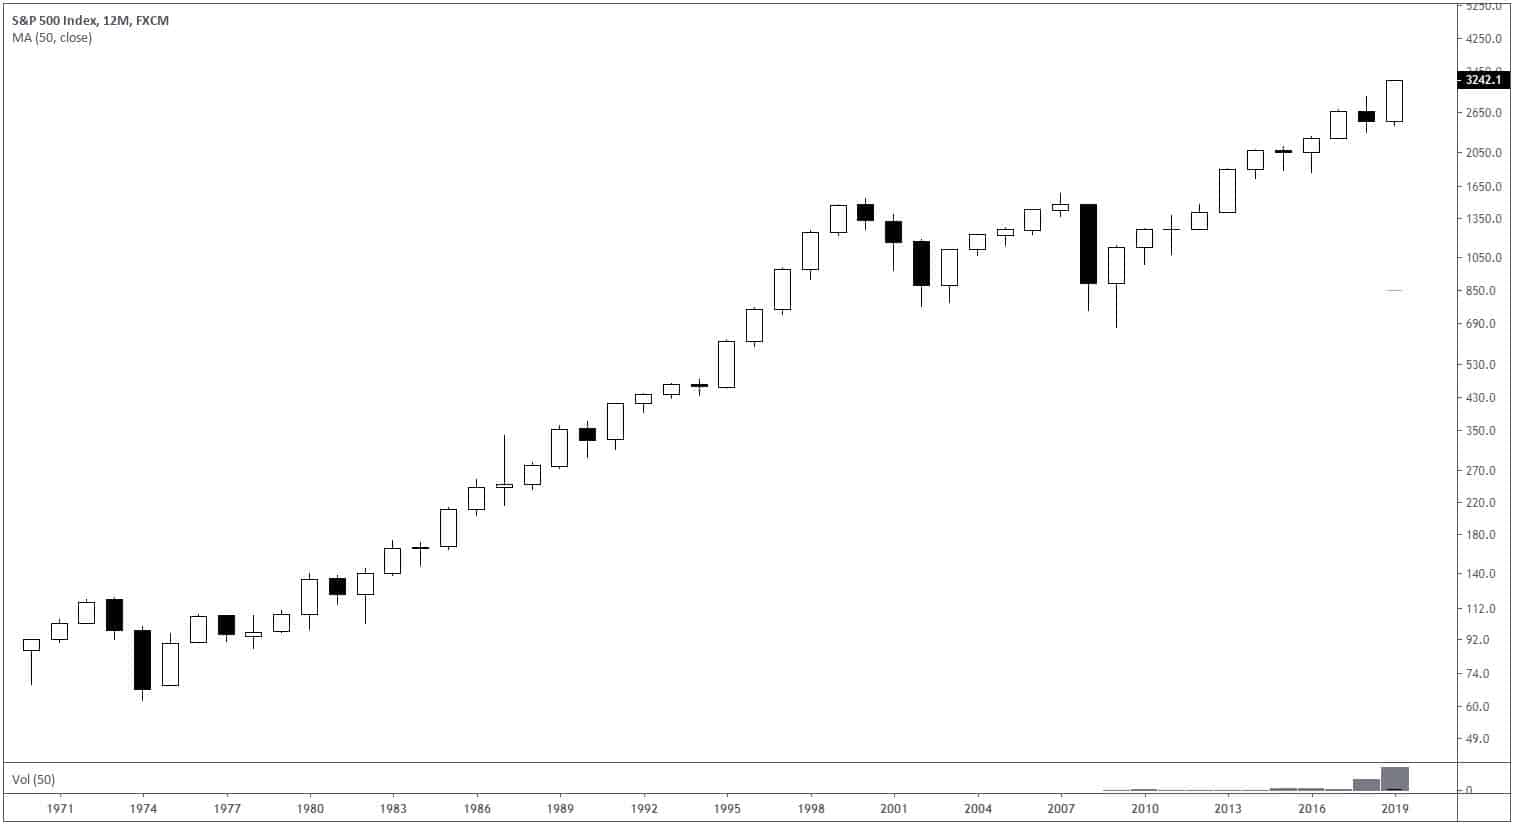
- This yearly chart of the SPX going back to 1970 shows the market is about to close on the high for the year, as well as the decade. Newton’s First Law reigns in markets and momentum tends to beget further momentum. This bodes well for next year as the S&P averages an annual return of 11.2% following a year in which it returns over 20% (according to MW).
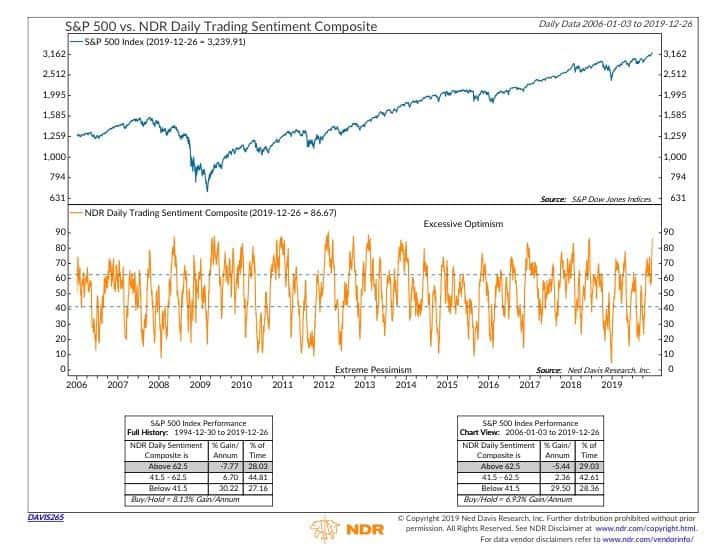
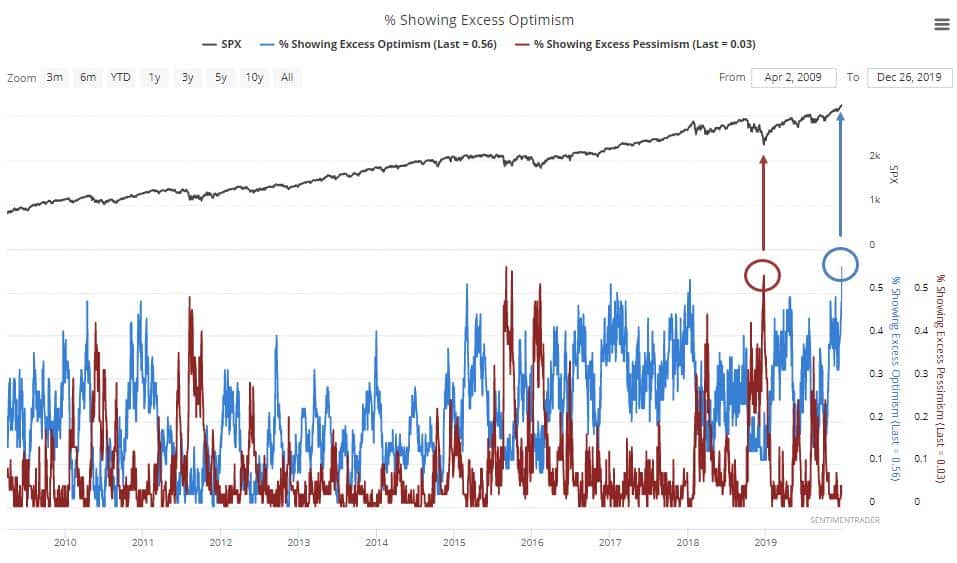
- But more short and intermediate terms of sentiment and positioning suggest we’re likely to see some profit-taking (read: volatility) in the near-term. NDR’s Daily Trading Sentiment Composite shows excessive optimism (chart via @WillieDelwiche).
- And Sentiment Trader’s “Core Indicators” are also showing widespread FOMO with 55% of them reading extreme optimism which is the highest level in 15-years.
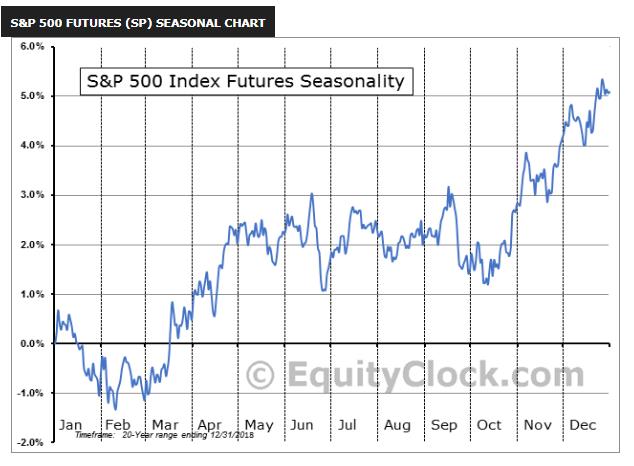
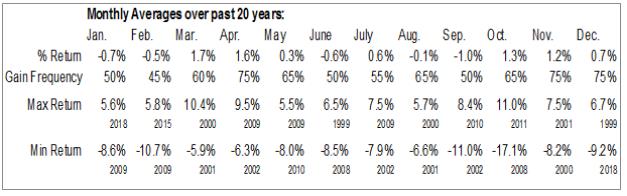
- In addition, January and February tend to be some of the weakest seasonal periods for stocks in the year (chart via Equity Clock).
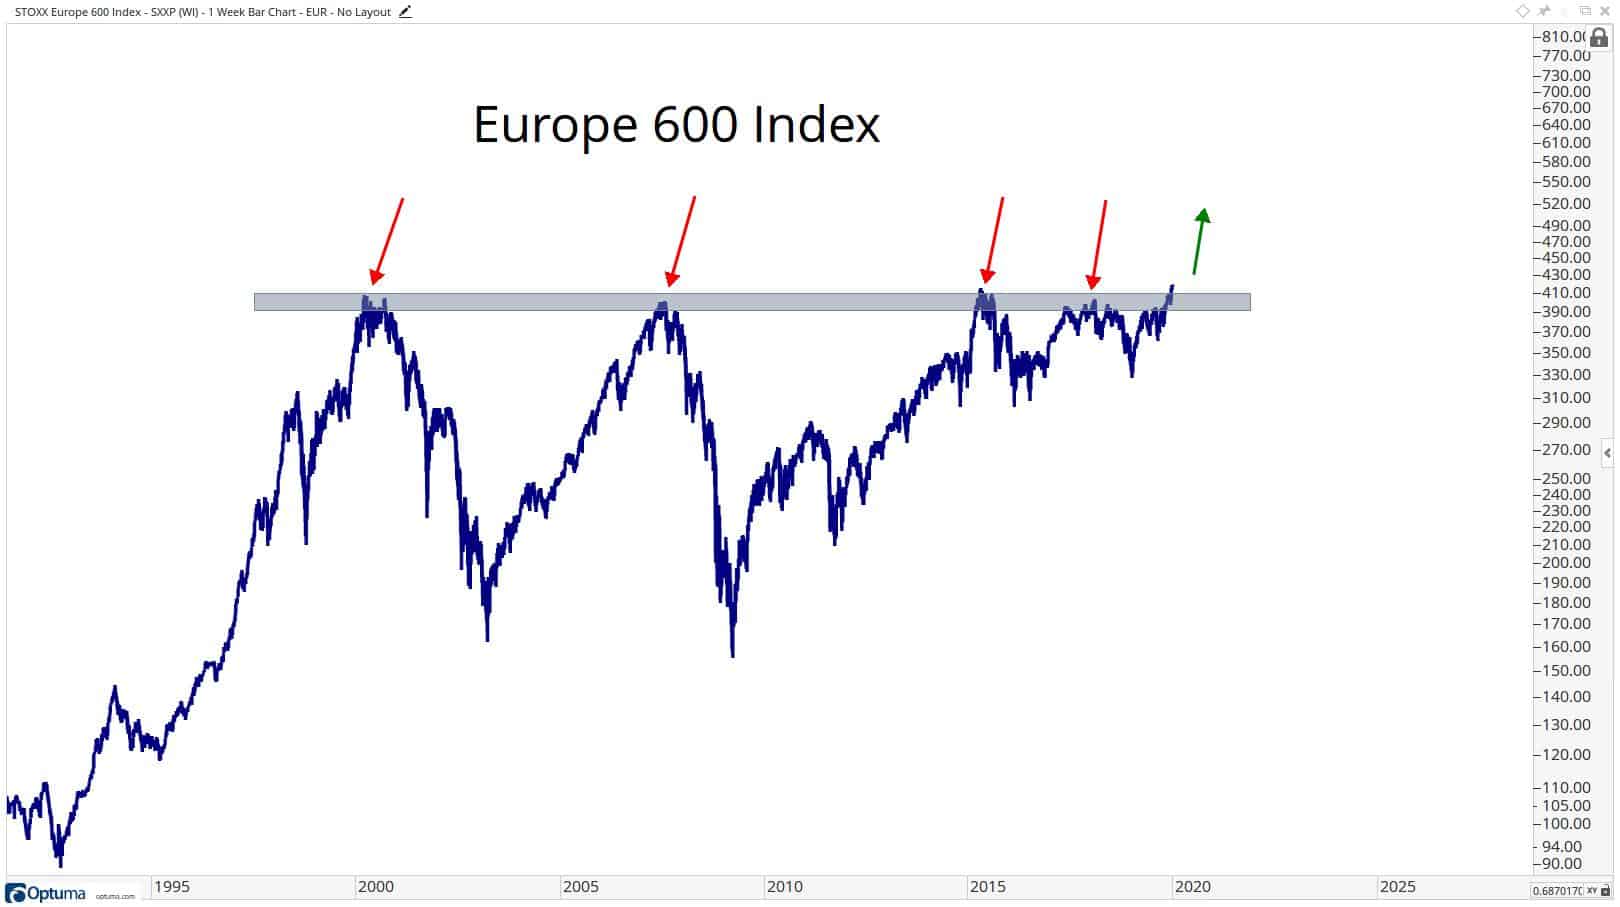
- This great chart from @allstarcharts shows the Europe 600 Index is breaking out to all-time highs, past a resistance level that has rejected it four other times over the last 20+ years. This is important for a number of reasons (1) it’s very bullish for global equities and European equities, obviously and (2) FX markets are driven by speculative flows. Spec flows chase expected total returns. An outperforming European market would be bullish the euro and thus bearish the US dollar (euro makes up roughly 60% trade-weighted dollar basket) (h/t @TihoBrkan).
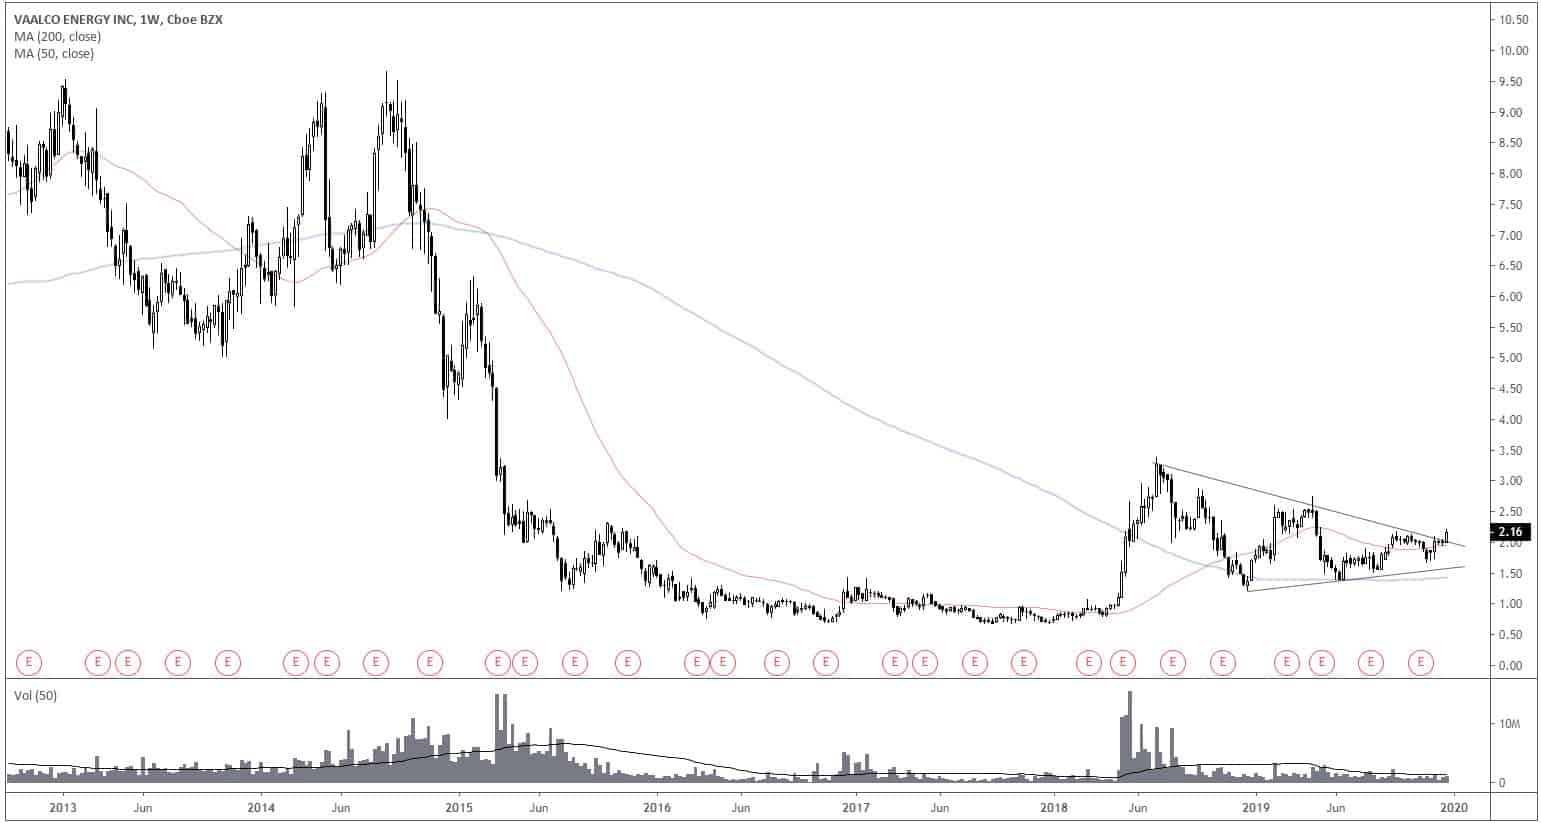
- Most of the charts in the oil and gas space still look like flaming turds. But… there’s a few that have recently broken out of nice technical setups. One of them is GPRK which I recently mentioned here. Another one is Vaalco Energy (EGY). It has zero debt, positive FCF, good assets, strong management, and is selling for dirt-cheap. Chart below is a weekly.
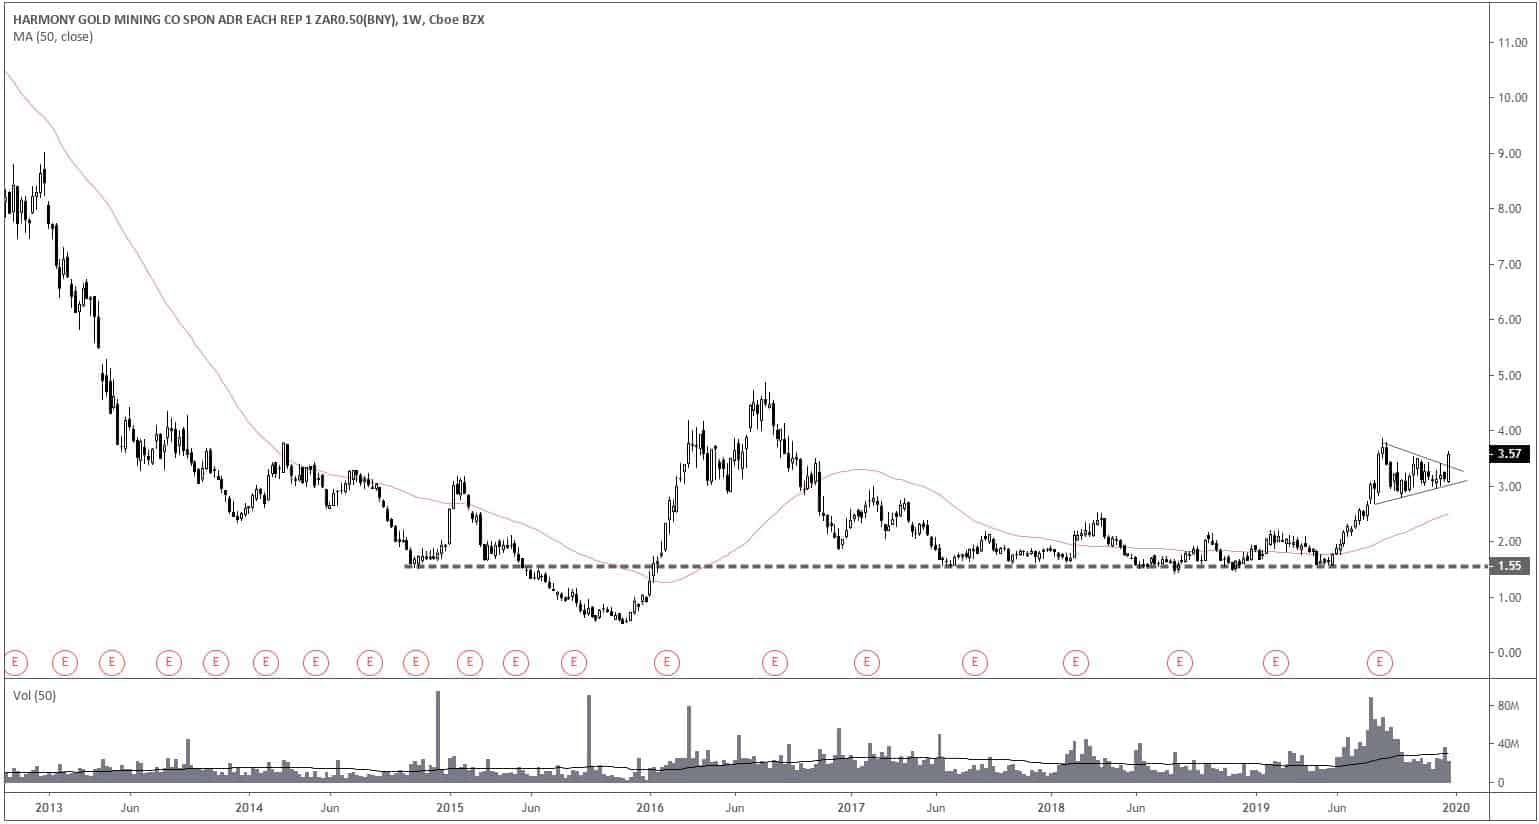
- I’ve been expecting more of a pullback in gold and think we may still get one — though I’m bullish longer-term on the yellow metal. With that said, there are too many good looking charts in the miner space to ignore. This weekly chart of Harmony Gold (HMY) is a beaut…
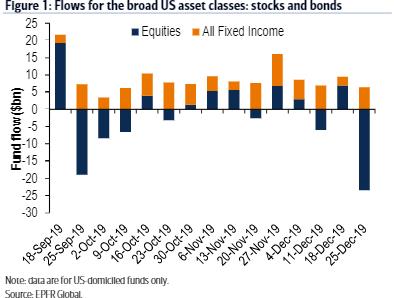
- This caught my eye. According to BofAML US equity funds and ETFs saw their largest weekly outflow of the year last week while investors piled into fixed income. I’m not sure how to square this with the sentiment data but it’s definitely strange.
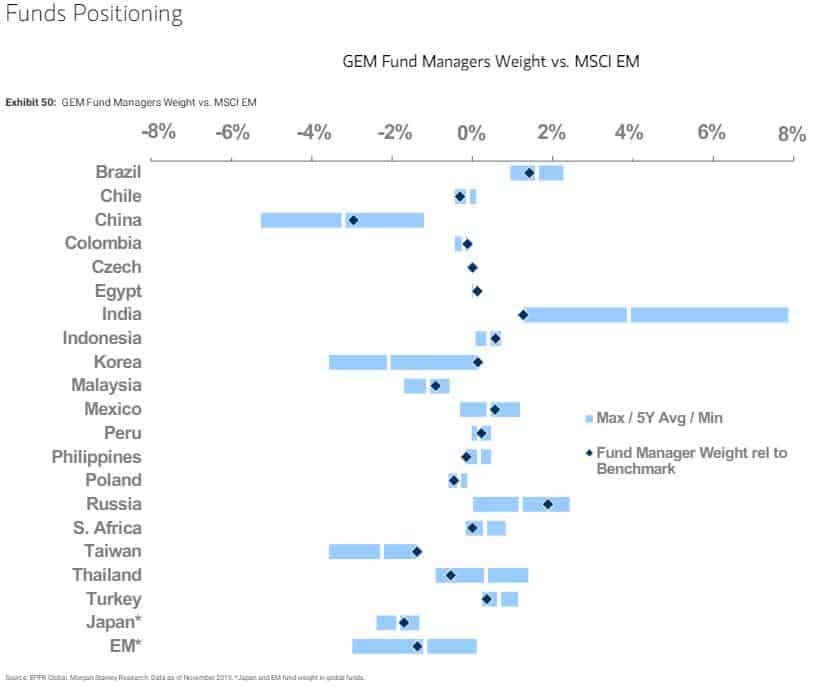
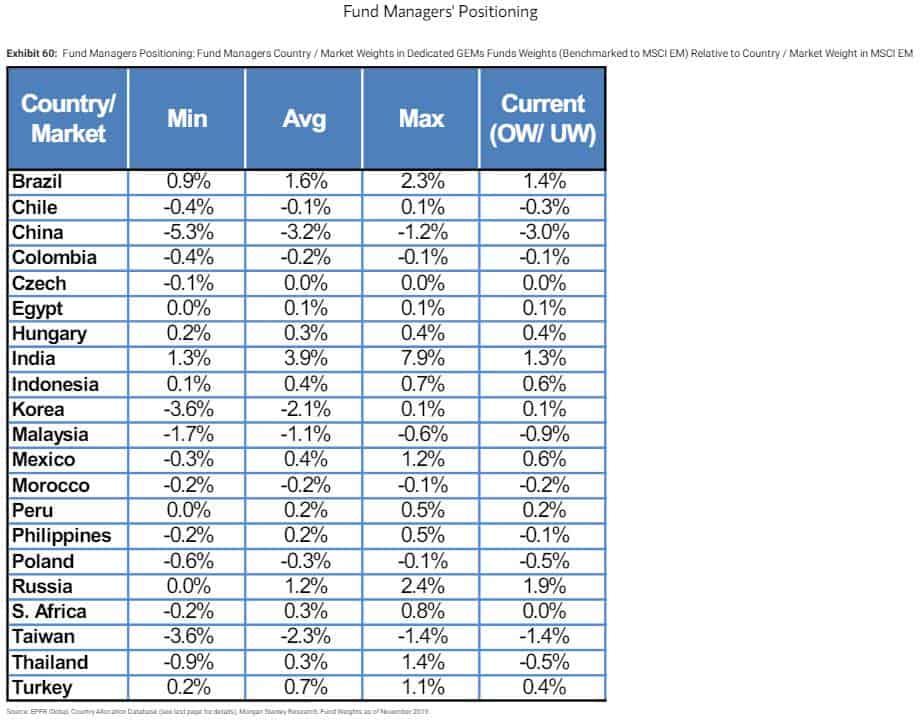
- Investors have been moving back into Emerging Markets with 9 out of the last 10 weeks seeing positive inflows into dedicated EM funds. This is a stark change from earlier in the year when investors were selling their EM holdings at a quick clip. This chart from MS shows GEM Fund Managers’ current weighting relative to the MSCI EM index. Malaysia, China, and Taiwan are some of the most underweighted countries which happen to be the charts I’m most bullish on going into 2020. Check out the Malaysia (EWM) chart, it recently broke out of the descending wedge I’ve been pointing out over the last couple of months.