Markets are constantly in a state of uncertainty and flux and money is made by discounting the obvious and betting on the unexpected. ~ George Soros
Good morning!
In this week’s Dirty Dozen [CHART PACK] we look at the year-to-date returns for major markets, take a step back and review some big-picture macro indicators, talk about the extremes we’re now seeing in bullish sentiment and positioning, and then look at gamma and what they may mean for markets. Let’s dive in…
- A year ago this week nearly the entire world was predicting a crushing recession and 08’ style bear market — we were not part of this crowd but were instead saying a major bottom was in. But, I admit, even we didn’t expect the year to turn out as strong as it did. I mean who would have thought a year ago that all stock markets around the world would not only finish the year in green but put in large double-digit gains. Markets are funny like that… The graph below is from KoyFin.

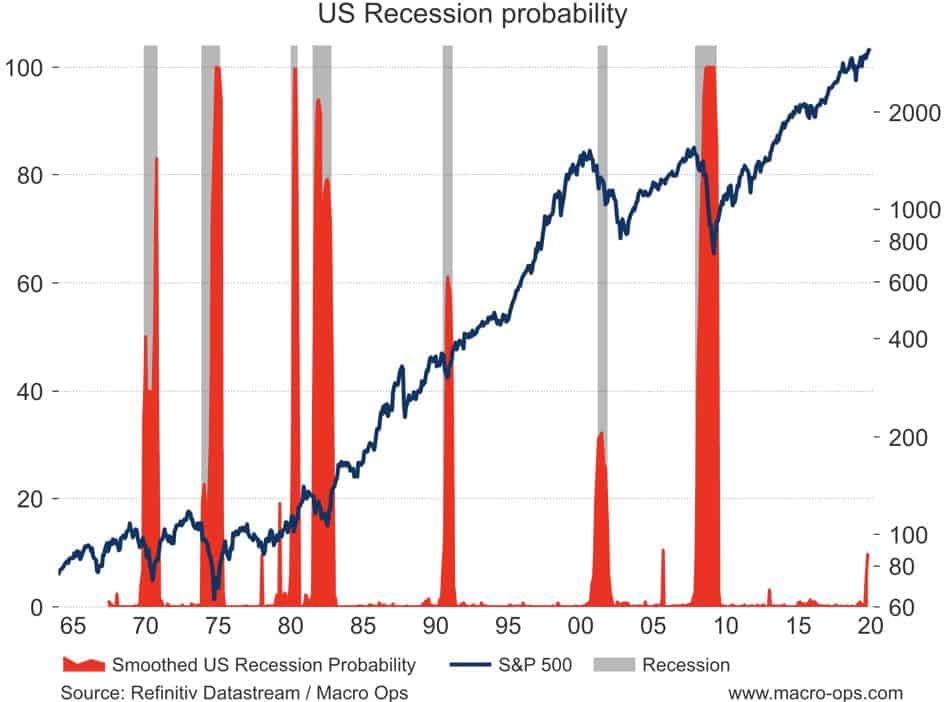
- This should be a quiet week for markets with the holidays and all so I thought we’d look at some bigger picture charts to see what 2020 might bring. This smoothed recession probabilities indicator is “a dynamic-factor markov-switching model applied to four monthly coincident variables: non-farm payroll employment, the index of industrial production, real personal income excluding transfer payments, and real manufacturing and trade sales.” It’s currently giving its highest reading this cycle but is still well below the level that indicates we’re near recession — meaning, not a major warning but something to keep an eye on. You can find more information on it here.
- Heavy Truck Sales, which is one of the critical leading macro indicators I track, just had its worst month-over-month drop this cycle. I suspect this is the result of the weak industrial and energy sector and tightening lending standards in the space.

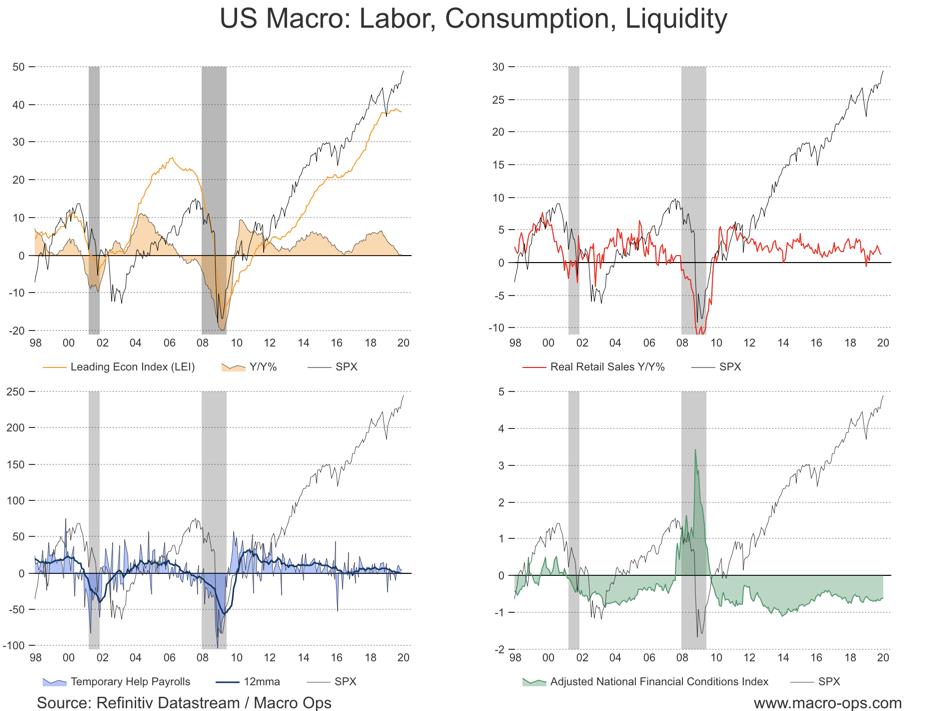
- I’ve noted the weak LEI over the last few months, which is another troubling development. Inflation-adjusted retail sales are still positive though weakening. The consumer has been a critical driver of this recovery so how tight they are with their wallets will continue to be important in 2020. The labor market is still strong though trend growth is weakening. And financial conditions continue to run very easy which is bullish for risk assets.
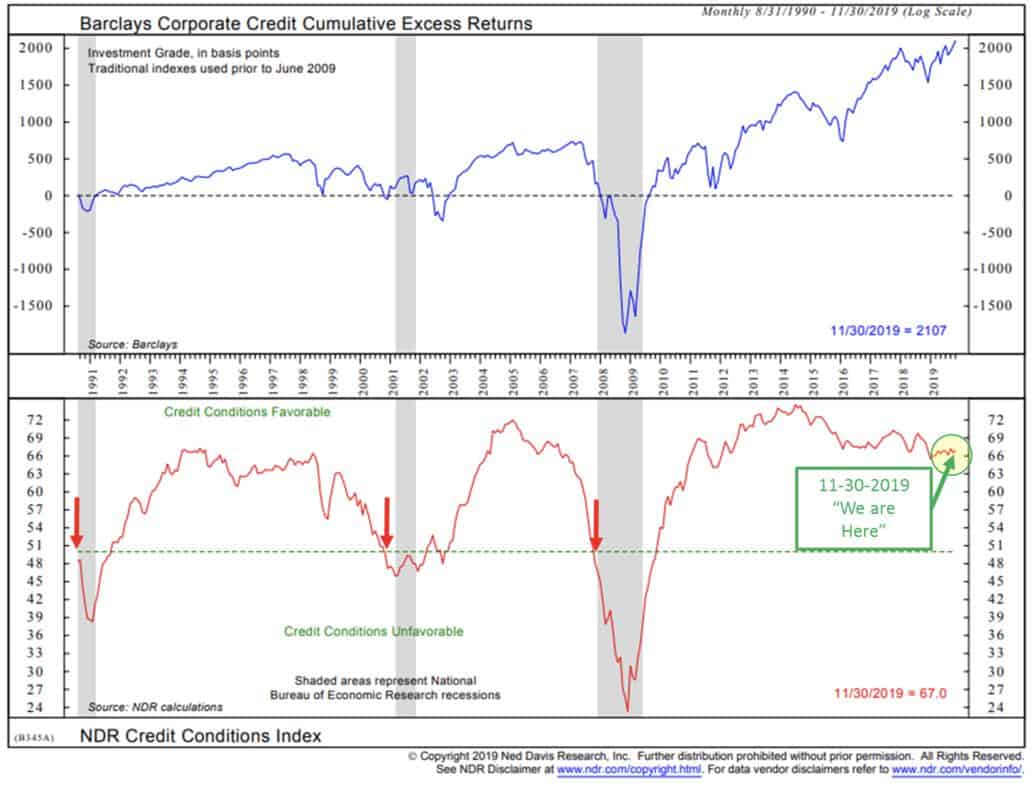
- This chart from NDR and CMG Wealth gives another look at how favorable credit conditions remain.
- The underlying technicals of the market are strong but it has become overbought and overloved. Many of our sentiment indicators are at their highest levels since early 18’.
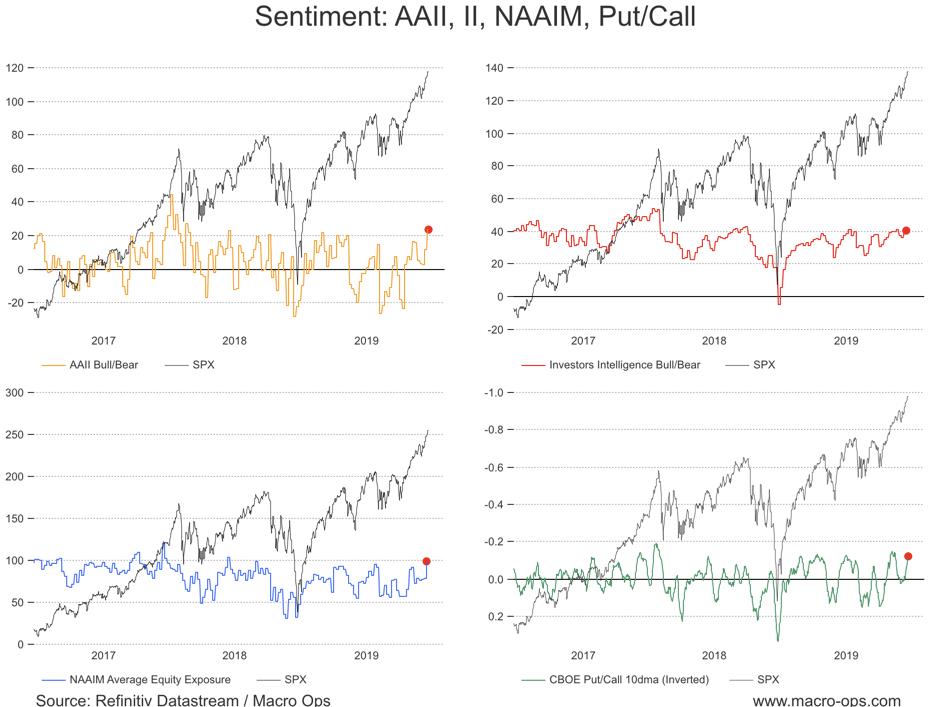
- Put/Call 3dma is now 2-Stdev from its average and the SPX’s RSI is in overbought territory.

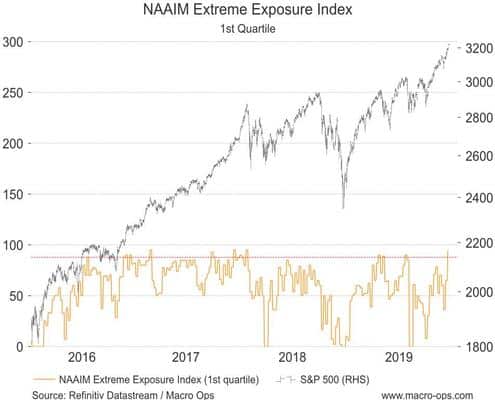
- The NAAIM Stock Exposure Index is at its highest level since June of 18’.
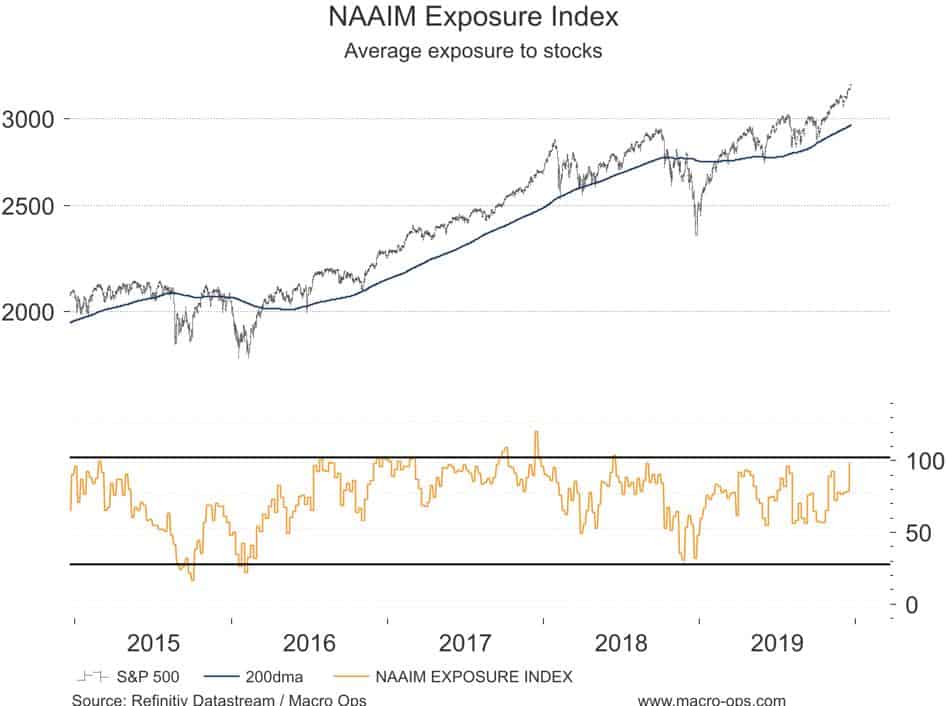
- And Extreme Exposure is at its highest level since January 18’ and above the threshold that has consistently preceded turning points in the past.

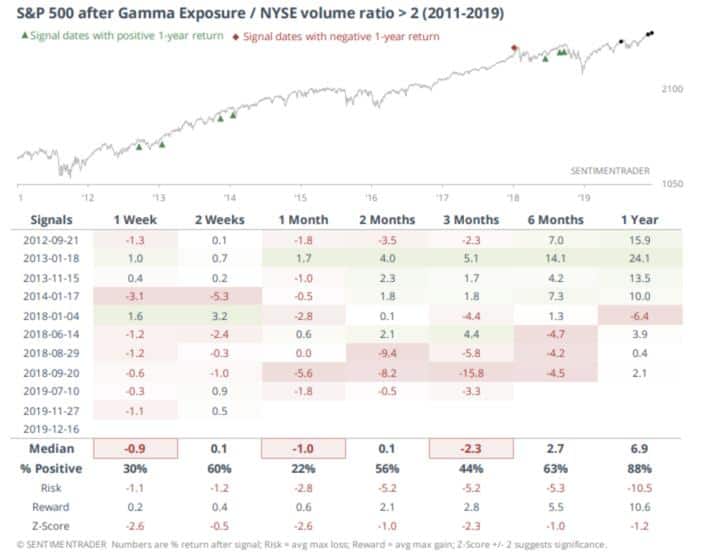
- This chart from Sentiment Trader shows that Gamma Exposure (the sensitivity of option contracts to movements in the SPX) is at historically high levels. They noted that “if the S&P moves +1%, there is a potential 8 billion shares coming to market to push prices lower. That’s the most ever when averaged over the past 3 sessions.”

- Here’s a table from them showing the historical market returns following a Gamma exposure / NYSE Volume ratio of over 2.
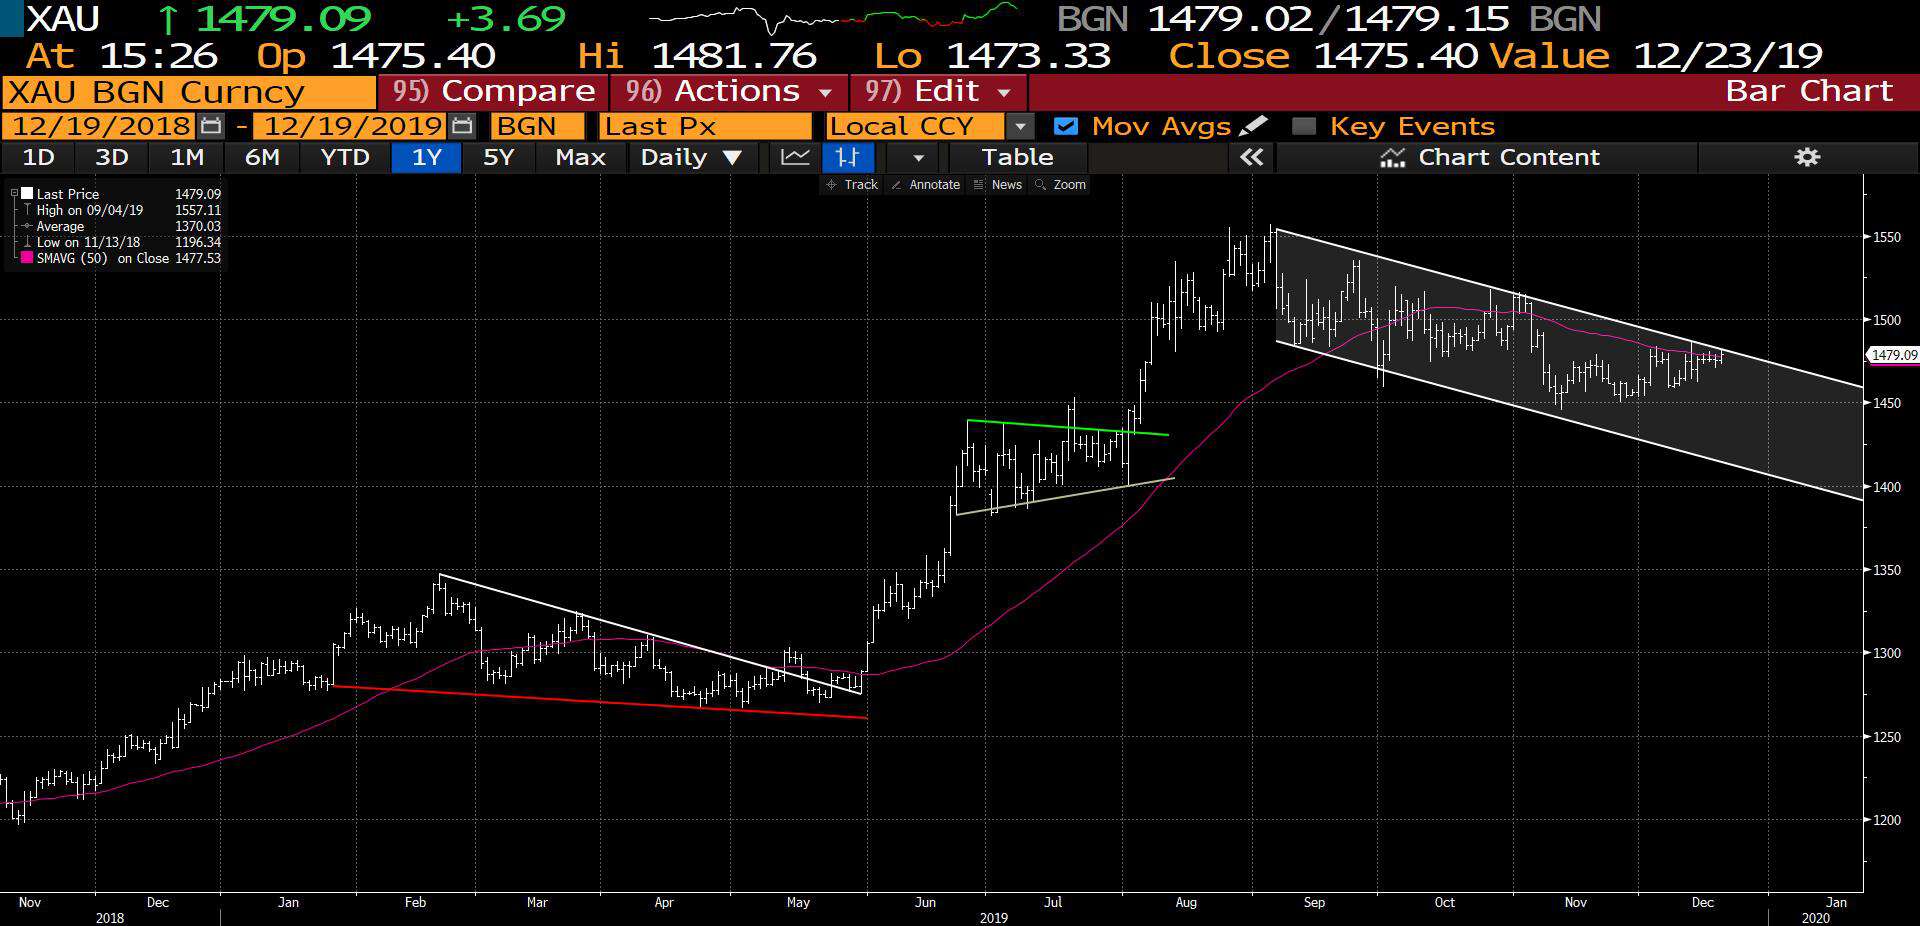
- I tweeted about gold this last week (link here). Its price is at an inflection point, up near its upper channel line and 50dma. My bias is that it soon breaks much lower from here but we may see a false bull trap first with a breakout above the upper channel line. Keep an eye on this one.