You’d be surprised when you’re put right on the ball and you’ve got to do something and everybody’s looking at you going, OK, what’s going to happen? You put yourself there on the firing line — give me a blindfold and a last cigarette and let’s go. And you’d be surprised by how much comes out of you before you die. ~ Keith Richards
Good morning!
In this week’s Dirty Dozen [CHART PACK] we look at the technical picture for the SPX, go through some stats that show this bull is gonna keep running, talk about the latest data that suggests the global economy has troughed, and finish with some single stock setups we’re looking at. Let’s dive in…
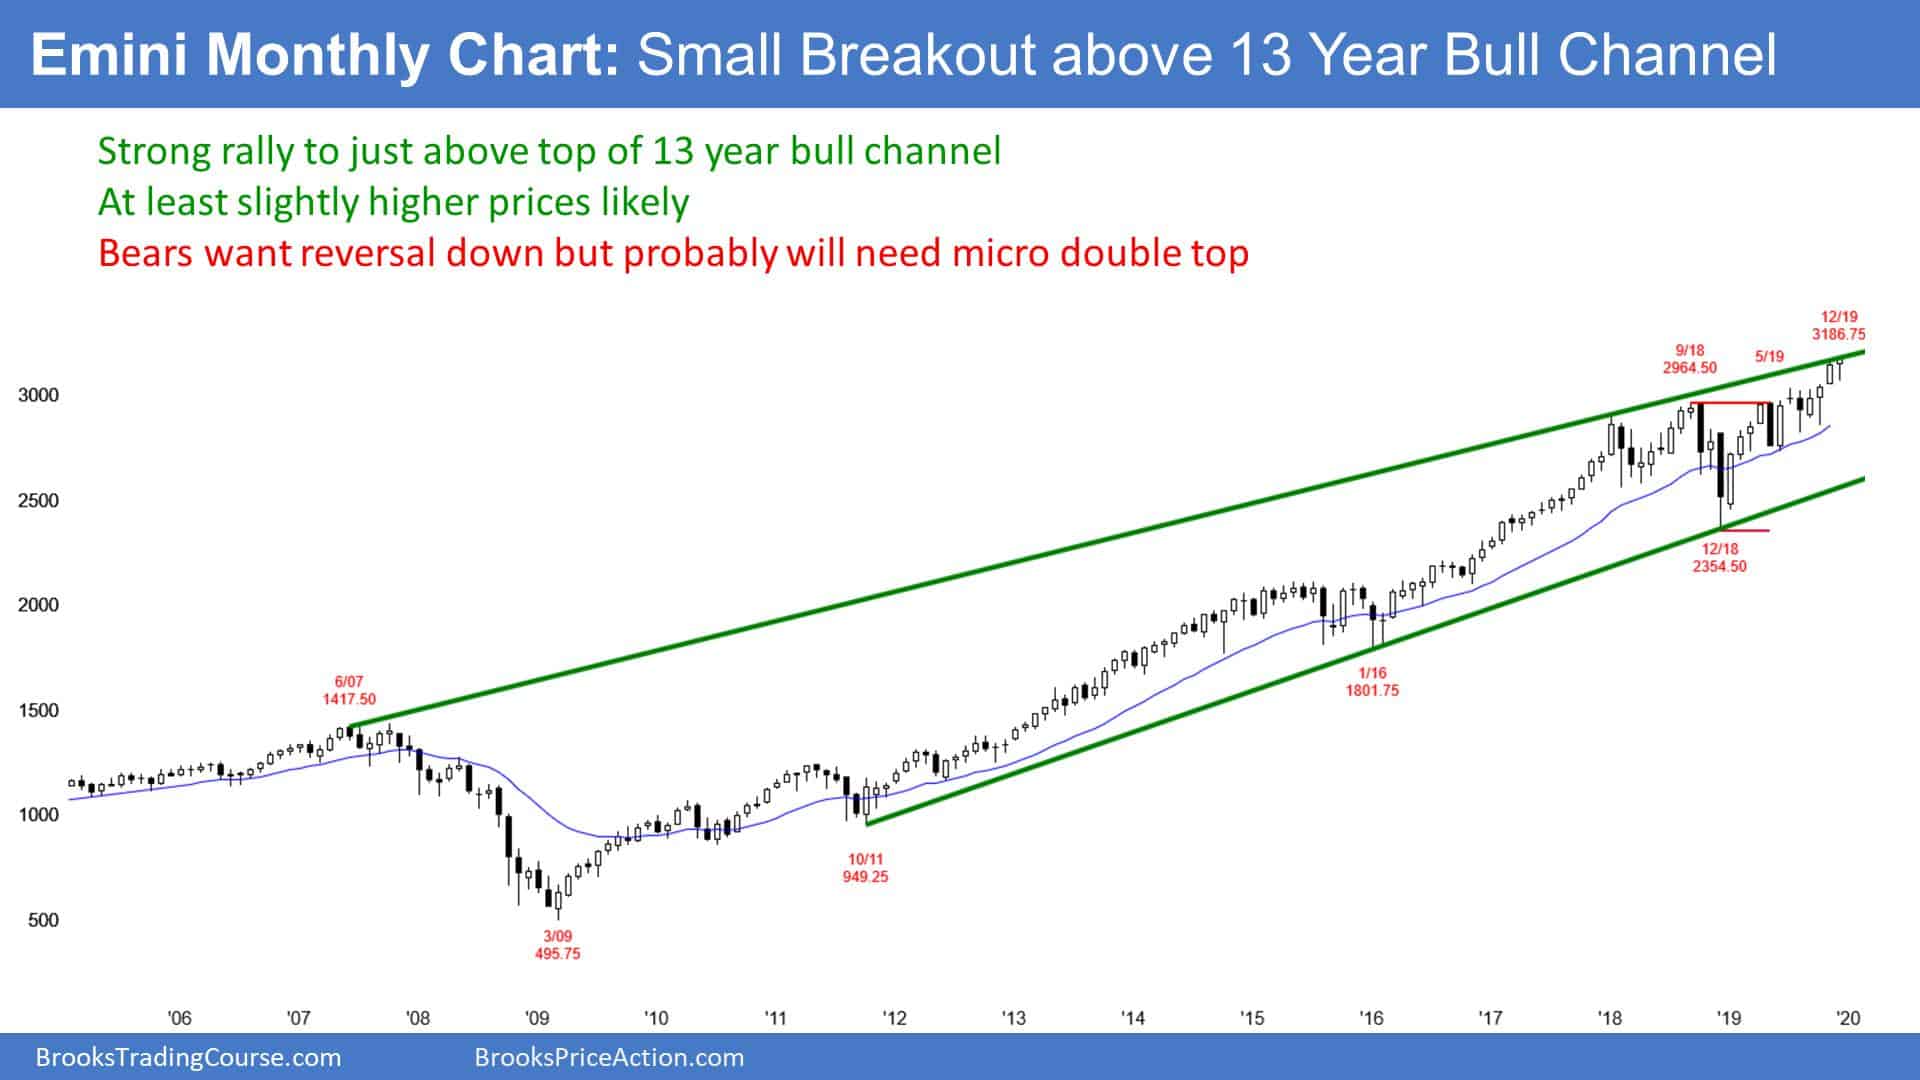
- The following chart and text are from Al Brooks. “The monthly S&P500 Emini futures chart finally broke above the top of its 13-year bull channel on Thursday. The breakout is small so far, but there are many days left to the month.
I had been saying for a couple months that the breakout was likely. But I also have been saying that there is only a 25% chance of a successful breakout above the top of a bull channel. By that, I mean an acceleration up into a stronger bull trend. The most dramatic example was the monthly chart in 1995. That breakout above a bull channel led to a huge bull trend.
In 75% of cases, there is a reversal down back into the channel within about 5 bars. An example of a reversal from a failed bull breakout above a bull channel happened in January 2018 on the weekly chart. The Emini eventually sold off 20% and went sideways for almost 2 years.
Five bars on the monthly chart is almost half a year. Therefore, the Emini could continue up for several more months before reversing down.”
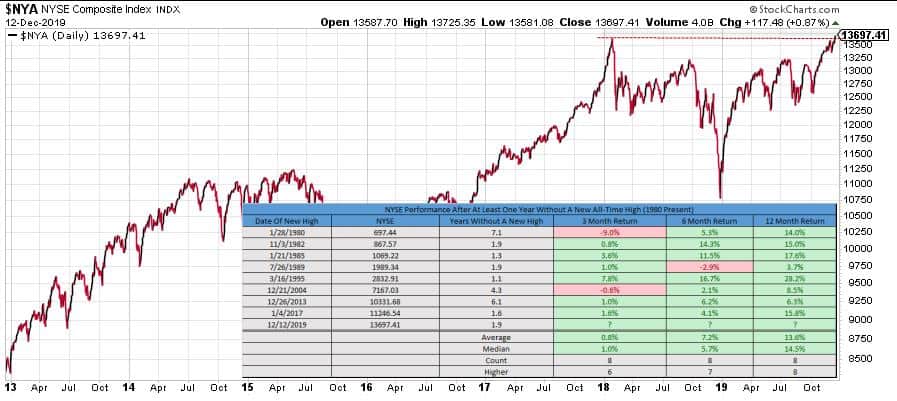
- After nearly 2-years of trading sideways, the NYSE took out Jan 18’s highs. @RyanDetrick points out that the market’s future returns after hitting new all-time highs following a year or more of sideways action tend to be pretty good, writing “Since 1980, higher 6 months later 7 of 8 and higher 12 months later every time.” The path of least resistance is still clearly up for equities…
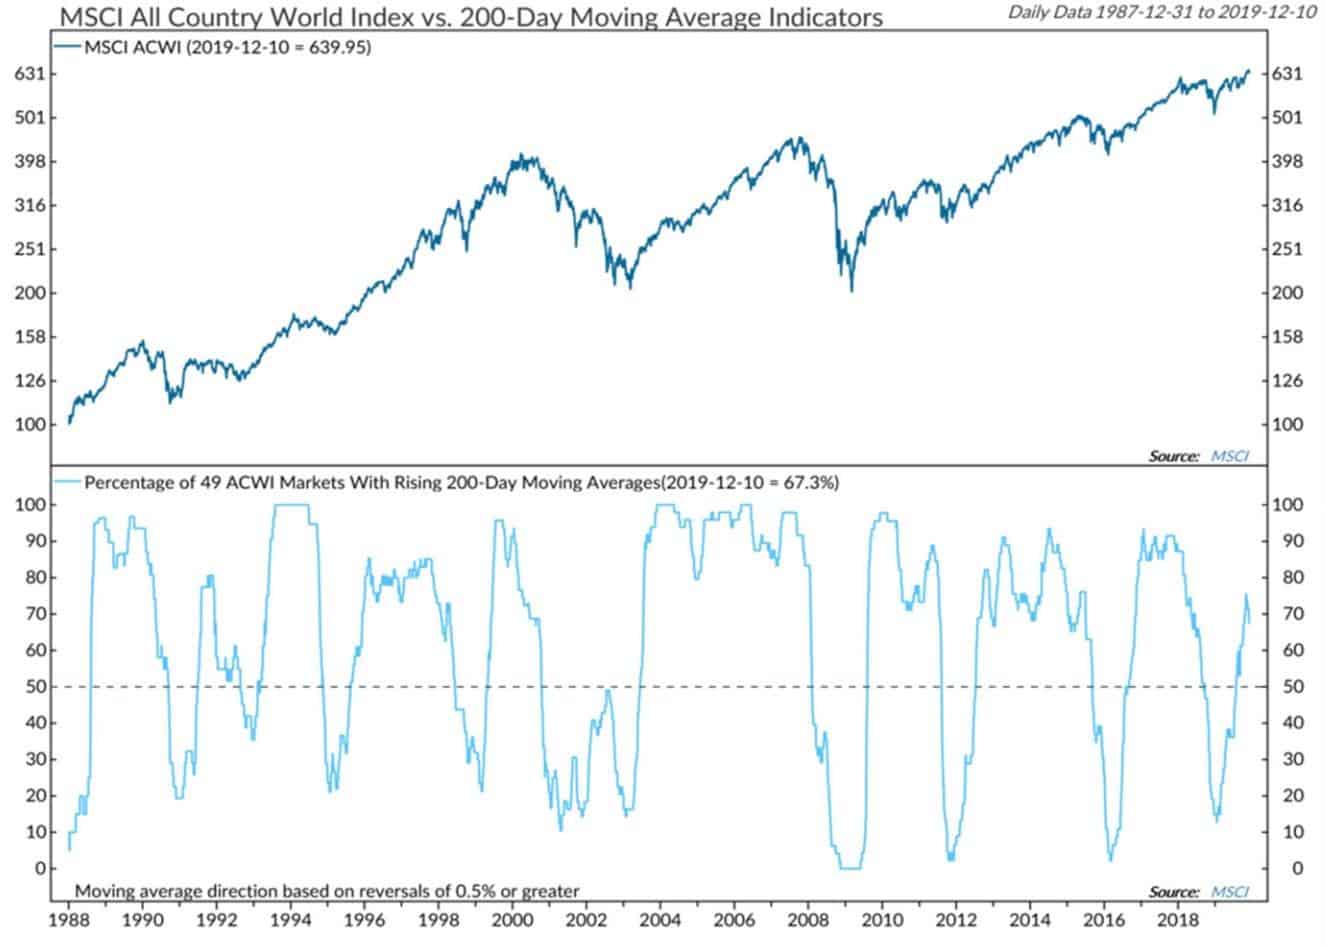
- This chart from NDR via RW Bairds “2020 Economic & Stock Market Outlook” shows that 67% of stock markets around the globe are trading above their 200-day moving averages. The strongest bull markets are driven by widespread participation (h/t @TN).
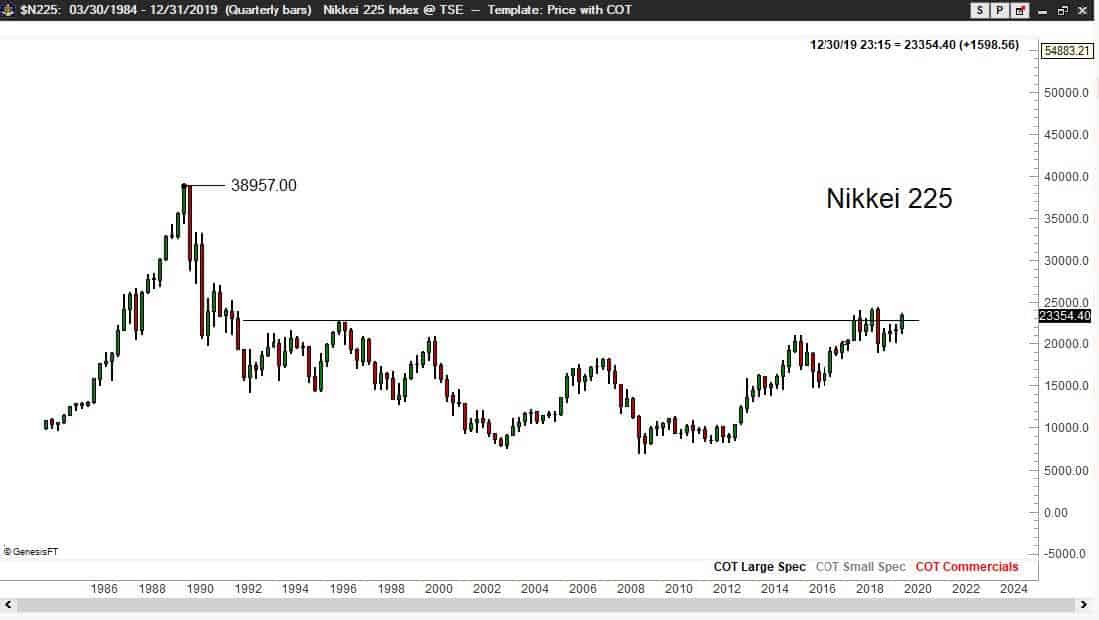
- I wrote a bit about the developing bull case for Japanese equities back in September (link here). Veteran chart technician, Peter Brandt, seems to agree. This chart of his shows the Nikkei 225 with quarterly candles. The market is attempting to break out of a 30-year range.
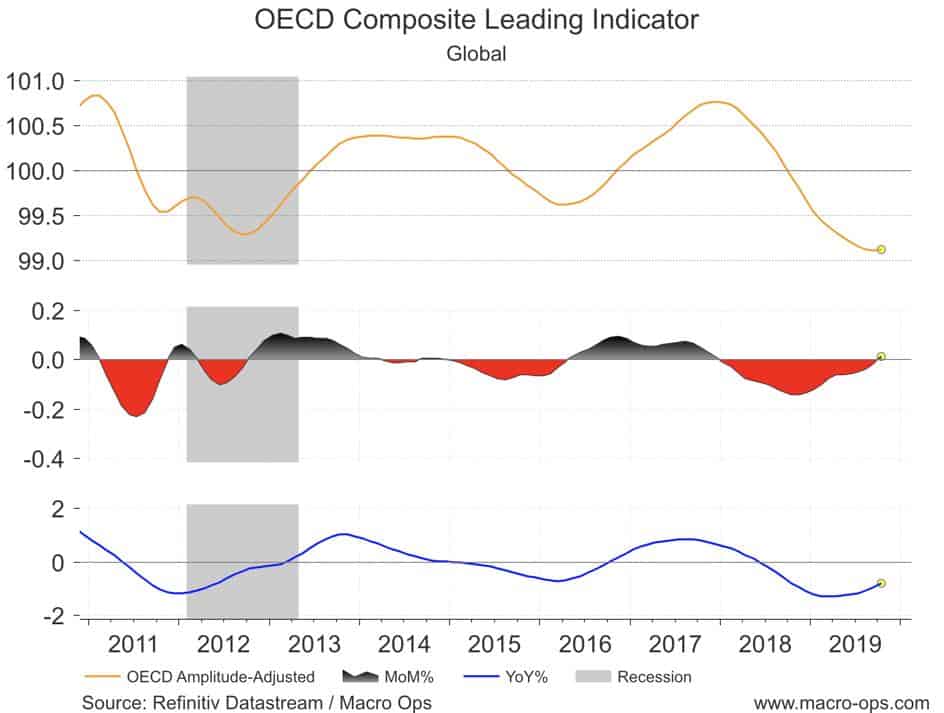
- A big reason for the bullish global technical backdrop is that the world didn’t end like most were predicting at the start of the year. While people were screaming about an impending recession we were pointing out how the data wasn’t that bad, and in fact, was indicating that the worst was behind us. One of these charts was the OECD Global CLI. Well, it just turned up for the first time since early 2018 (top orange line).
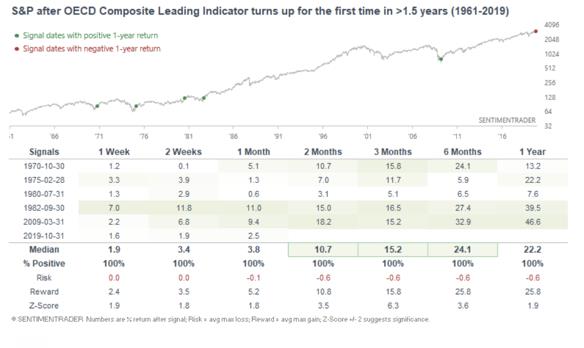
- This graph from Sentiment Trader shows the S&P’s returns after the OECD CLI turns up for the first time in over 1.5 years. STRONG ACROSS THE BOARD. Man, it’s gotta be rough being a perma-bear in this environment…
- Oh… and the Global PMI is also inflecting higher.

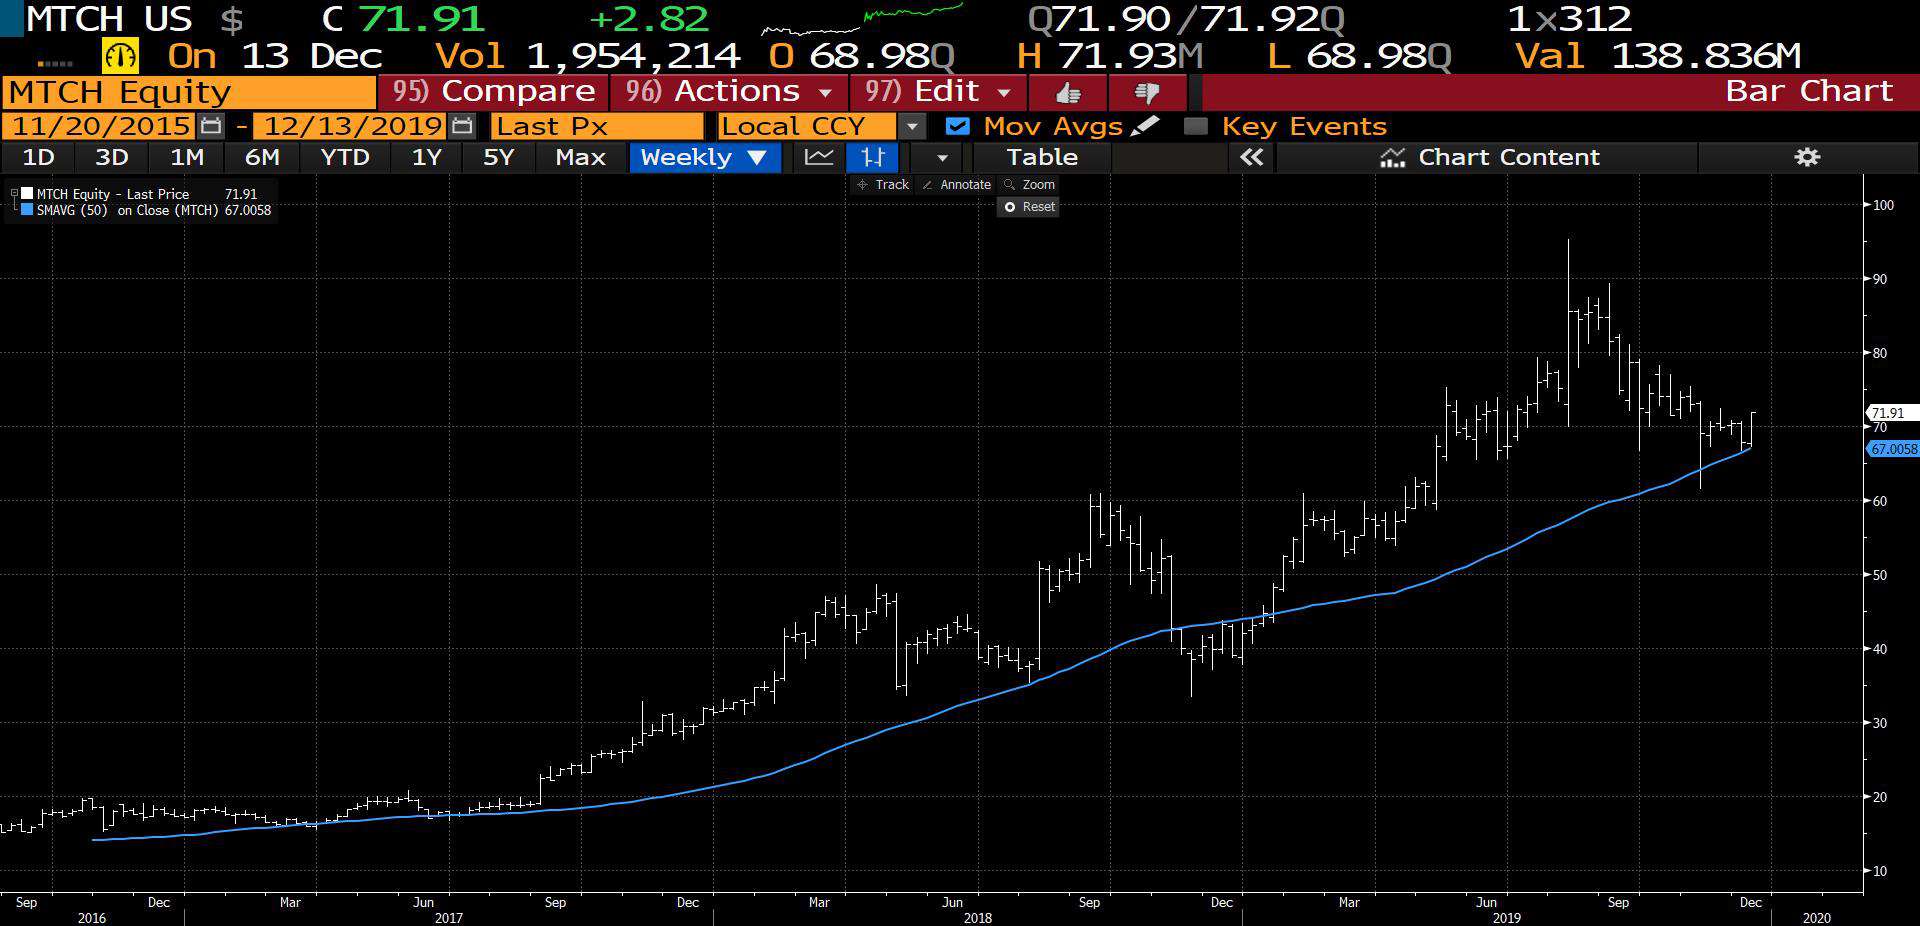
- In light of this positive backdrop here are a few stocks I’m looking at with nice setups. Here’s the dating tech company Match (MTCH). It’s spent the last year trading down to its 200-day moving average (blue line) where itssince found support.
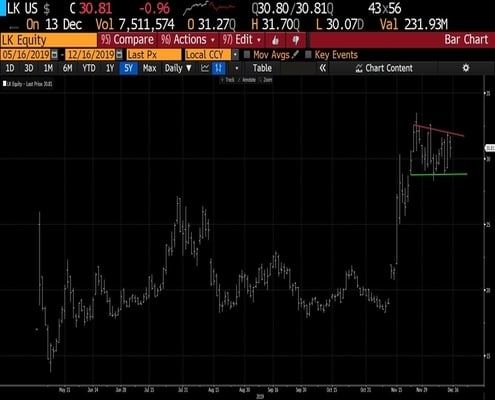
- Chinese coffee retailer Luckin Coffee (LK) is forming a nice bull flag after exploding out of its post listing range. The company has triple-digit revenue growth, the CEO and Chairman own roughly 40% of the company, and there’s an extremely high short float (read: lost of fuel for a rip higher).

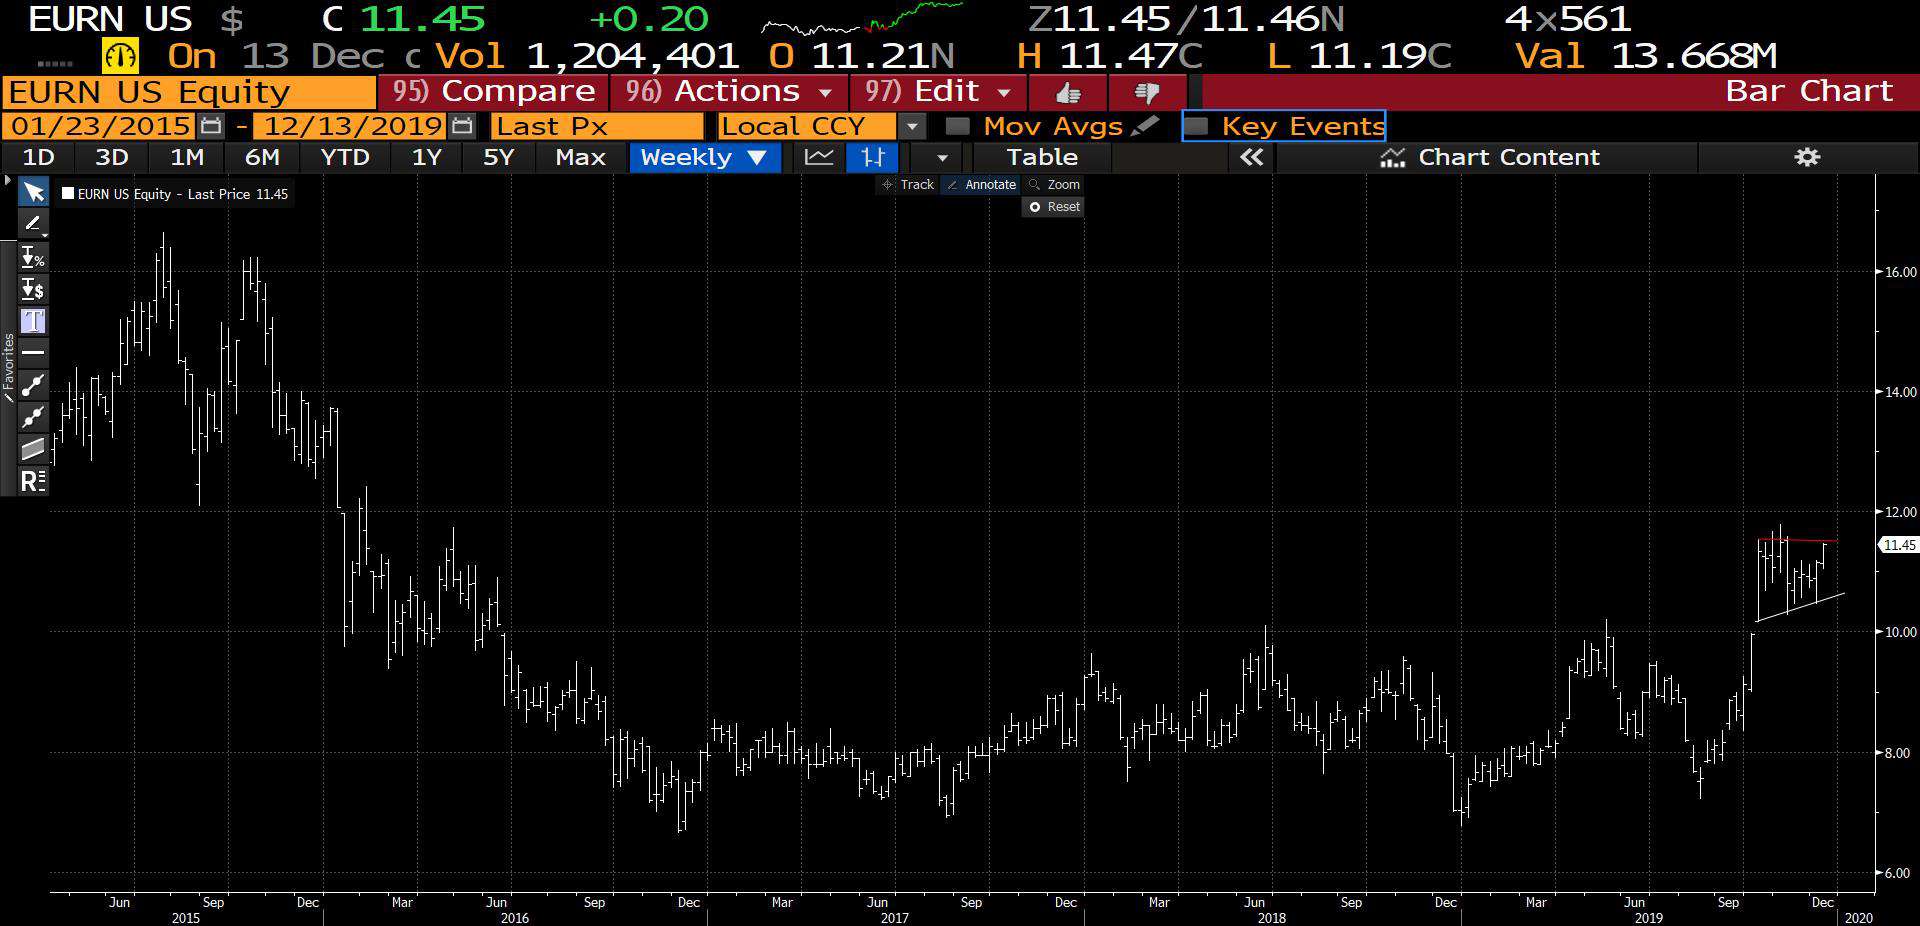
- Shipper Euronav (EURN) is also bull flagging after a strong impulse move out of its base (chart is a weekly).
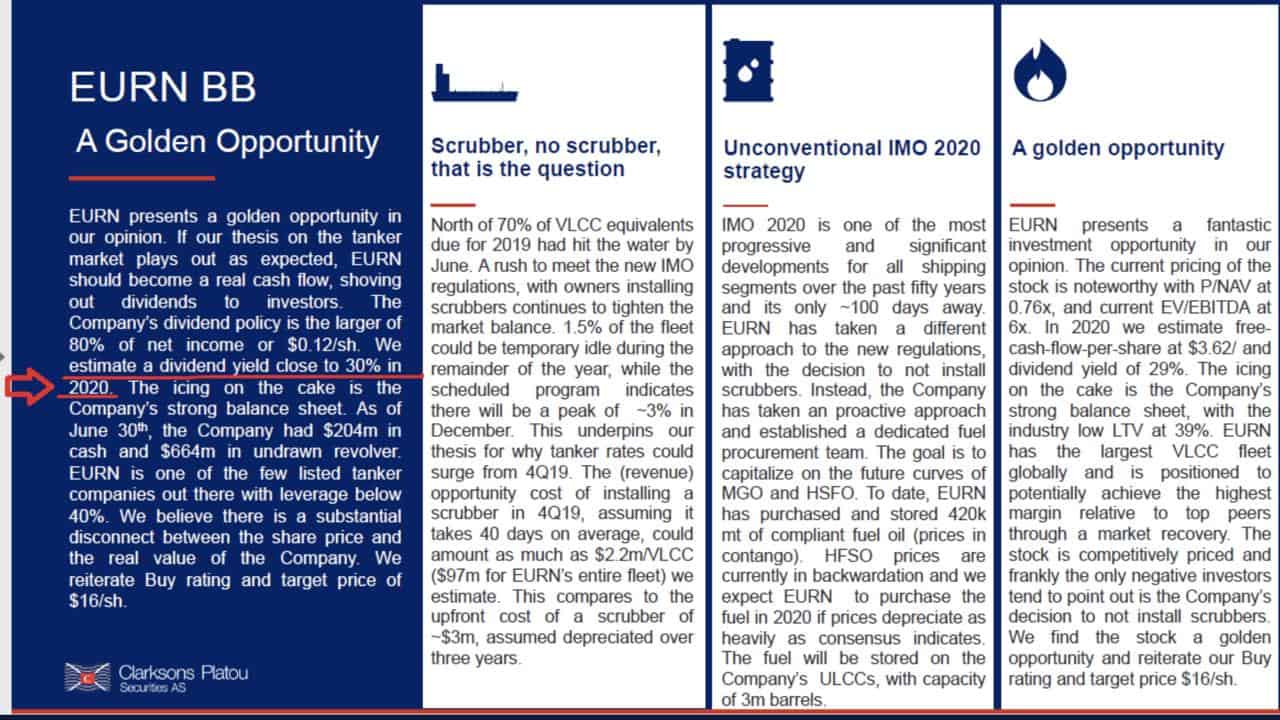
- Clarksons lays out the DEEP value case for EURN below (h/t @joeriwestland).
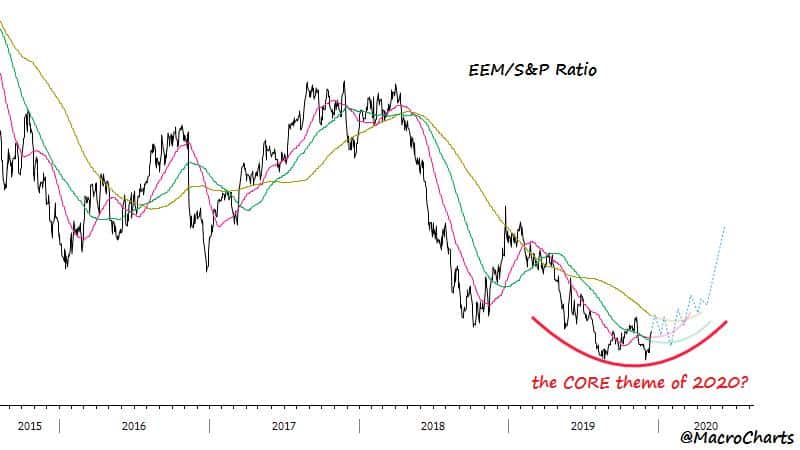
- This great chart from @MacroCharts shows what 2020 could bring for EM. To get there though we need to see the dollar break. And while it’s been trading weak as of late, it’s still holding above key technical levels which means odds still favor up/sideways action for now.