If you would be a real seeker after truth, it is necessary that at least once in your life you doubt, as far as possible, all things. ~ Rene Descartes
Good morning!
In this week’s Dirty Dozen [CHART PACK] we look at a few indicators that are raising the odds of a US recession over the coming year, then we check out the technical picture on the SPX, discuss the case for a short-term pullback/consolidation, and see where the broader path of least resistance lies… Oh, and we also check up on shipping amongst a couple of other things…
- A favorite recession indicator of mine, the Philadelphia Fed Coincident State Index, printed a new cycle low this last month. This doesn’t guarantee a recession is on the horizon — you can see that the indicator has hit these levels before in the past, only to rebound mid-cycle. It does mean though, that the indicator is at a critical inflection point and needs to materially improve in the coming months or the odds of a recession next year rise substantially.
- The Conference Board LEI, another high-fidelity leading indicator, also put up weak numbers. The indicator declined for its third straight month and is close to turning negative on a year-over-year basis. The LEI has effectively signaled all eight recessions since its inception in 1959. It peaks on average 10.5 months before a recession starts. Like the indicator above, the clock is now ticking. We need to see a rebound or expect late 2020 to be a rough ride — the graph below the chart shows the S&P’s average returns per the YoY trend in the LEI.
- The SPX is taking a bit of a breather printing a weekly Doji candle following 6 strong consecutive bull candles. It’s now bumping up against its upper 6-month bull channel trend line.
- Trends don’t move in straight lines but are rather comprised of impulsive thrusts followed by corrective retraces/consolidation points as supply and demand work to form another base. The daily chart below of the SPX shows that the market broke below its month + long bull channel after getting rejected by its larger 6-month upper bull channel trend line. Typically, after a large move like this, we should expect a couple of weeks of sideways or downwards price action due to profit-taking and emboldened bears.
- There are numerous signs that the market is entering a short corrective phase. The chart below shows the percent of stocks that have triggered MACD sell-signals within the last 10-days is at levels that have coincided with previous short-term tops.
- Breadth has also deteriorated a good deal. There are now more stocks trading below their 20-day moving average than above. The NYSE’s new highs-new lows 10-day moving average has declined considerably and our Zweig Advance/Decline Breadth indicator has turned negative.
- Another concerning data point is the widening in high-yield credit spreads. Generally speaking, financial conditions are still broadly loose and much of this deterioration is being driven by the struggling energy sector. But, if this trend continues, there’s the chance we begin to see some spillover effects.
- But there a number of reasons to not expect a significant correction. And, considering the positive seasonality of the period we’re moving into, it’s very possible that last week’s small dip was all the breather we needed. The Put/Call (10dma) ratio jumped on the little sell-off mid-week, showing fear is ever-present in this market.
- This great chart from @MacroCharts shows that fund managers remain extremely under-positioned. I would not be surprised if we see a FOMO driven end of year rally as under-performing managers try to play catch up to the market.
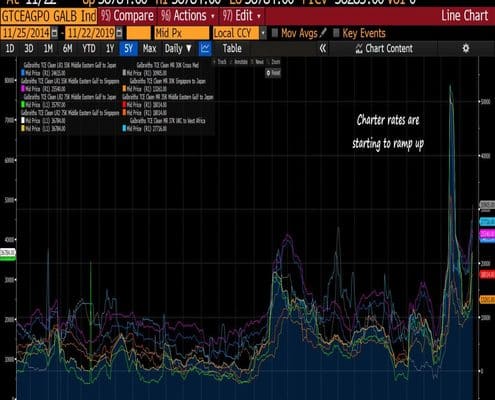
- The bull market in shipping is kicking into gear. Charter rates are spiking as the end of year nears, sidelined refinery capacity comes back online, and IMO 2020 comes into effect. Click here to read my write-up on shipping’s bull case. My favorites in the space are STNG, LPG, TNK, and INSW.
- Goldman Sachs’ Financial Conditions Index growth impulse is expected to turn positive in the coming months thus providing a tail-wind for GDP growth in 2020.
- China has been tightly — relatively speaking — managing its credit spigot. Goldman Sachs China Domestic Macro-Policy Proxy shows that the CCP is only marginally providing stimulus to the economy. China’s tight fiscal and monetary policy continues to be a drag on emerging markets and a negative on global inflation.