It’s happened…

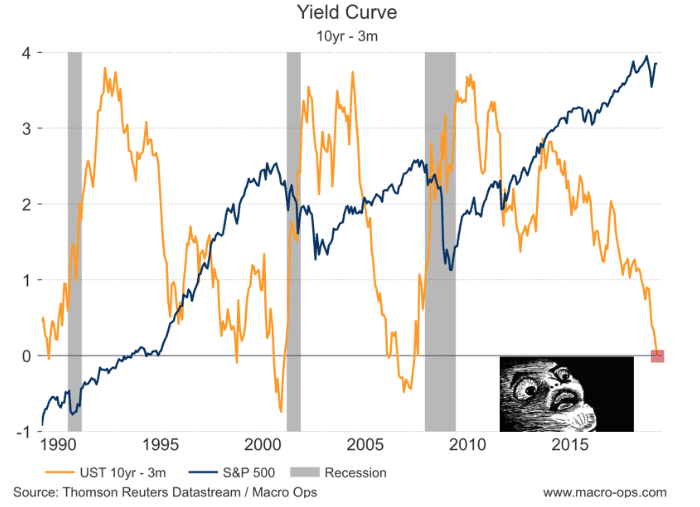
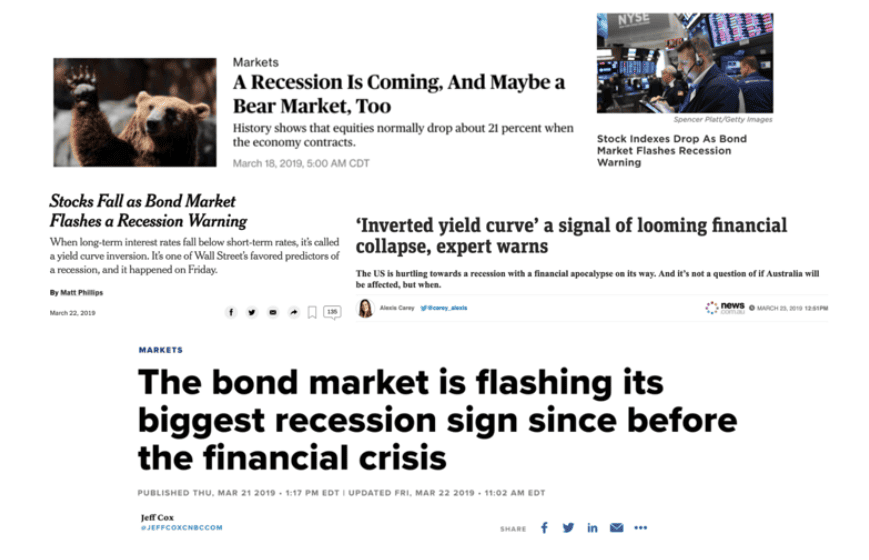
The 10yr/3m yield curve has inverted. The party is over folks. Sell your stocks, horde your cash, pack your bags and go home. Recession is imminent…
The mainstream financial news and twitter “market experts” have nailed it. The top is in.
It’s nice knowing that calling a recession is this easy. There’s really nothing to this game. Buy the dip when the curve is positive and sell when it inverts, sidestepping a recession and bear market. It’s so easy your grandmother could do it.
Alright, enough of the sarcasm.
You can probably tell that I don’t quite agree with the above sentiment. Last time I checked, investing and calling macro tops isn’t quite so simple.
Let me give you a different interpretation.
First, I’ll explain what an inverted yield curve actually means. Then I’ll lay out why there’s almost certainly more upside in stocks (much more). And then I’m going to use the four dirtiest words in finance to explain why context matters in this game, especially now.
So what does an inverting yield curve actually mean? And why is it an excellent predictor of recession (though not omnipotent)?
I’ll tell you.
The yield curve reflects the pricing of bonds (and inversely their yields) from the front end rate which is set by the Fed all the way out to the long end of the curve, which is set by the market. Obvious, I know.
The yield curve shows us how interest rates are being discounted through time; from the present to decades out into the future.
It’s important because all assets are priced off this curve.
When the front end interest rate, which is set by the Fed, rises faster than what the long end is pricing in (ie, it flattens and/or inverts), it impacts markets and the economy in two ways (1) it has a negative present value effect on asset prices and (2) the flatter/negative curve causes a constraint on lending as well as the broader economy.
The first one is simple. When front end rates become equal to or exceed those of longer end interest rates, moving out of duration assets and into cash/cash-like instruments makes sense (why take on duration risk when you don’t receive compensation for doing so). This applies to stocks as well, as stocks are essentially long-duration assets.
The second part refers to how the curve — the spread between front end and long end rates — sets the price of money, and therefore incentivizes or de-incentivizes lending in the real economy. Here’s the following from Hedge Fund manager Ray Dalio, writing in his book Big Debt Crisis on the subject:
Typically, in the early stages of the top, the rise in short rates narrows or eliminates the spread with long rates (i.e., the extra interest rate earned for lending long term rather than short term), lessening the incentive to lend relative to the incentive to hold cash. As a result of the yield curve being flat or inverted (i.e.. Long-term interest rates are at their lowest relative to short-term interest rates), people are incentivized to move to cash just before the bubble pops, slowing credit growth and causing the previously described dynamic.
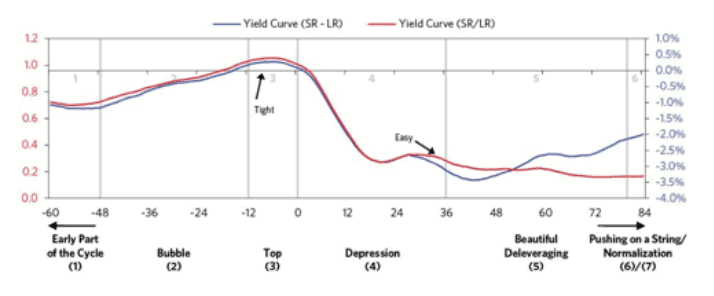
Early on in the top, some parts of the credit system suffer, but others remain robust, so it isn’t clear that the economy is weakening. So while the central bank is still raising interest rates and tightening credit, the seeds of the recession are being sown.
The fastest rate of tightening typically comes about five months prior to the top of the stock market. The economy is then operating at a high rate, with demand pressing up against the capacity to produce. Unemployment is normally at cyclical lows and inflation rates are rising. The increase in short-term interest rates are rising. The increase in short-term interest rates makes holding cash more attractive, and it raises the interest rate used to discount the future cash flows of assets, weakening riskier asset prices and slowing lending. It also makes items bought on credit de facto more expensive, slowing demand. Short rates typically peak just a few months before the top in the stock market.
There’s also a market/Fed disagreement component to a flattening/inverting yield curve which is where the signaling comes from.
When front end interest rates (which are set by the Fed) rise above long end rates (which are set by the market) it essentially means that the market disagrees with the central bank. The market is saying that the Fed has gotten ahead of itself and will soon have to reverse course (cut interest rates) due to slower growth and inflation in the future. That’s why investors take on duration even when it’s offering an equal or lower yield than the front end; they expect yields to continue to trend downwards.
I’ll explain in a bit why the dynamics of this have changed and why the signaling quality of the curve has deteriorated due to some very explainable reasons.
Before we get to that though, I want to show you quickly why even if the recession signaling value of an inverted yield-curve hasn’t been distorted, it’s still no reason to panic over the short-to-intermediate term.
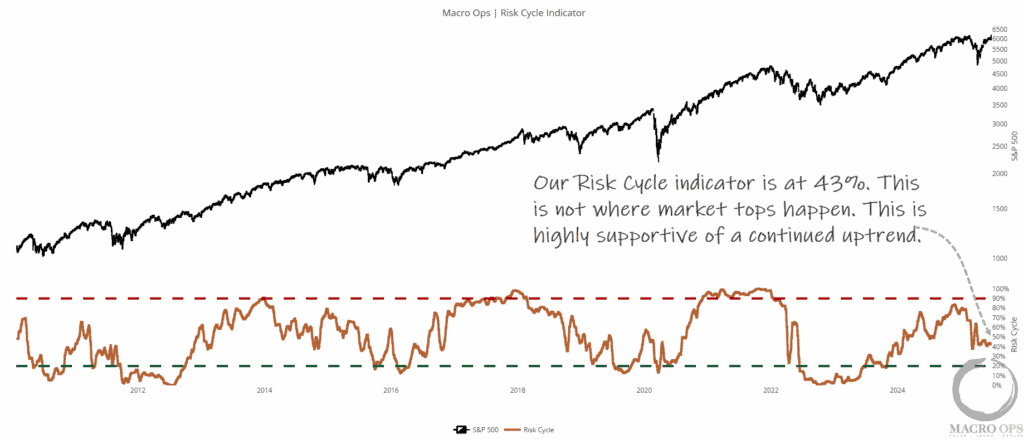
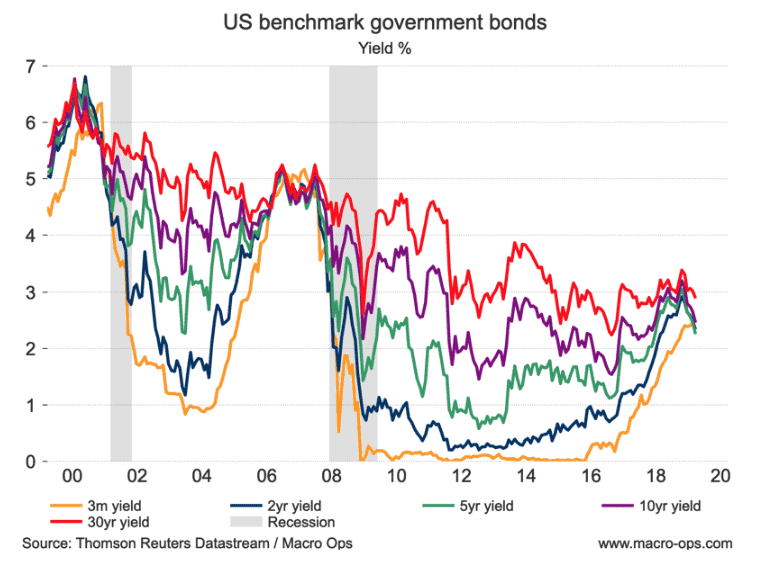
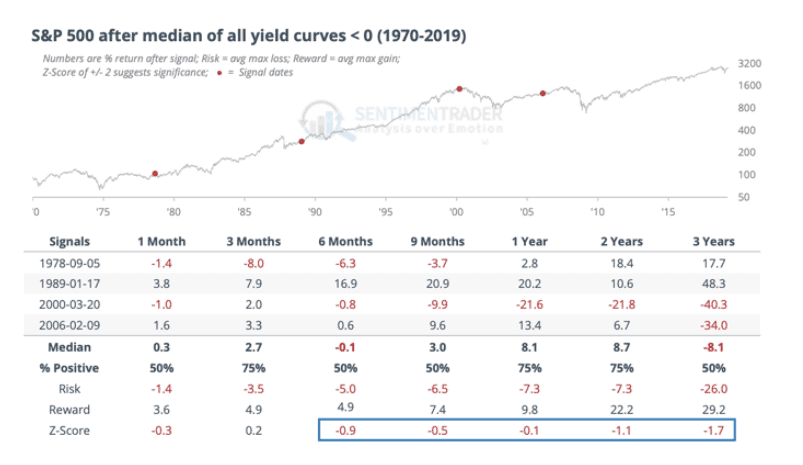
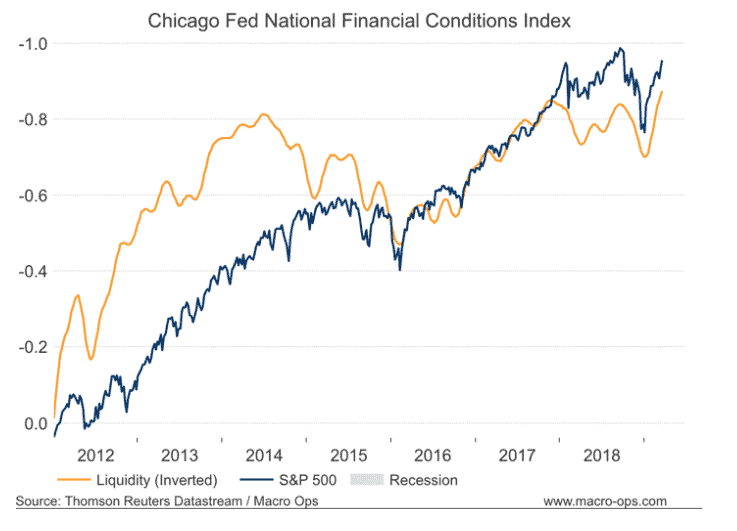
The reason being is that the curve tends to invert well before a recession and depending on which specific curve you’re using, long before a market top as well. See the 10yr/3m curve chart at the top. It inverted years before the last two market tops.
The graph below shows that the standard 10yr/2yr yield curve has inverted on average 19-months before a recession, going back to 1968, whereas a top in the SPX has preceded recession by only an average of 7-months.
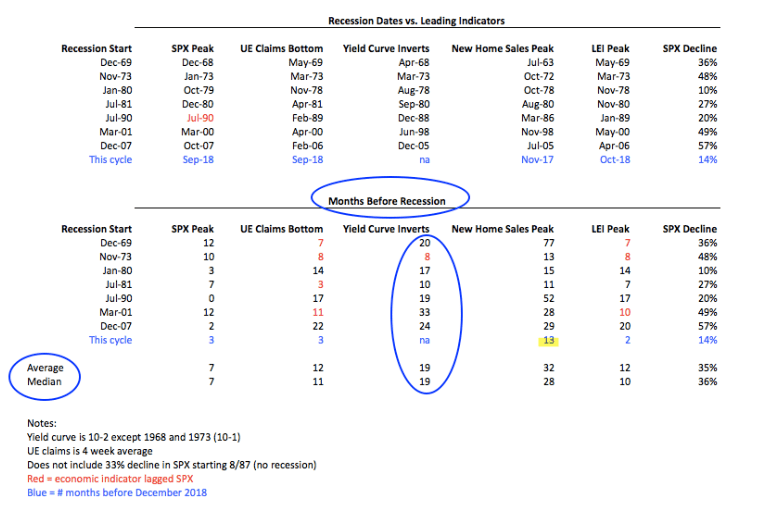
The 10/2yr curve hasn’t even inverted yet.

This chart via Sentiment Trader shows that the return picture following curve inversions is on balance positive going out to two years.
Okay, so maybe take the rising calls for recessionary doom and gloom with a shaker of salt.
More importantly, let’s talk context, which is something that so many market commentators seem to not care about.
There have been two very important changes this cycle that make present-day conditions unique and the signaling value of the yield curve diminished. Yes… I’m saying This Time is Different.
I know, I know, you’re never supposed to utter those words in finance. But excuse me if I think that’s the most overused lazy and abused adage in this game. The truth is, it’s always different this time. No two cycles are exactly alike. So, yes, we still have to use our little monkey brains to try and understand what things like yield curve inversions mean in the context of present-day reality.
Let’s start with the first change: Banking and Financial Regulations.
Following the GFC new financial regulations (ie, Dodd-Frank & Basel III-IV) were enacted to ensure a more robust and resilient banking system during times of significant market stress. One of the many byproducts of this new regulation is the liquidity coverage requirement (LCR) which requires financial institutions to hold a certain amount of high-quality liquid assets (HQLA) that’s sufficient enough to withstand a significant stress scenario.
What this means in practice is that banks have to hold a higher level of HQLAs (ie, sovereign bonds) than before. When you couple this with the need for duration matched assets from pension funds and insurance companies in a world where there’s $10trn+ in negative yielding developed market debt, we get price blind buyers for bonds. And when you have price-insensitive buyers (institutions who buy because they have to) well, the impact on that market’s signaling value should be obvious.
This has never been the case before in past cycles. This is why the yield curve may not serve as much of a valuable recessionary signal as it used to in the past. This is why THIS TIME IS DIFFERENT.
Then there’s the second and more recent change, which is within the Fed itself.
Fed Watch Tim Duy wrote in Bloomberg about the Fed’s recent and total about-face, writing (emphasis by me):
It is hard to understate the importance of this shift. The Fed’s models haven’t worked this way in the past. In previous iterations of the forecasts, the expectation of unemployment remaining below its natural rate would trigger inflationary pressures. To stave off those pressures, the Fed perceived the need to raise rates above neutral to slow the economy enough to nudge unemployment upwards. Now the Fed believes it can let unemployment hold persistently below the natural rate without triggering inflation and without Fed policy becoming restrictive.
Duy goes on to note that, “The Fed apparently has finally realized that persistently low inflation remains a problem.” And “to avoid the problems of the zero lower bound for as long as possible, the Fed needs to ensure that inflation stays sufficiently high to hold expectations at its target and that they act to avoid a recession. The policy implication is that they need to err on the dovish side.”
In practical terms, this means that the Fed has essentially thrown out the models that it’s relied on in past to help make interest rate decisions. Jerome Powell and team are making it clear that they need to see an actual and sustained spike in inflation before raising interest rates. And they’re willing to cut rates and even resume QE to get there, even at near full employment and stable growth.
This is a BIG deal. The Fed has learned some lessons from past cycles and doesn’t want to kill the party. So why fight the Fed?
I sure don’t want to.
Okay, so far I’ve explained what an inverted yield curve typically means along with why things are different this time. I’ve also laid out why context always matters and why one should never just lock onto a single input and form a market view. We want to put as many pieces together in our market puzzle. And most importantly, we need to be weighing the data we see against what’s already being priced in.
We need to always be asking ourselves: What’s part of the common narrative and what is the market blind to?
So let’s play the common knowledge game.
Everybody knows that the yield curve is inverting. And everybody knows what this historically has meant (hint: the news headlines at the start of this piece).
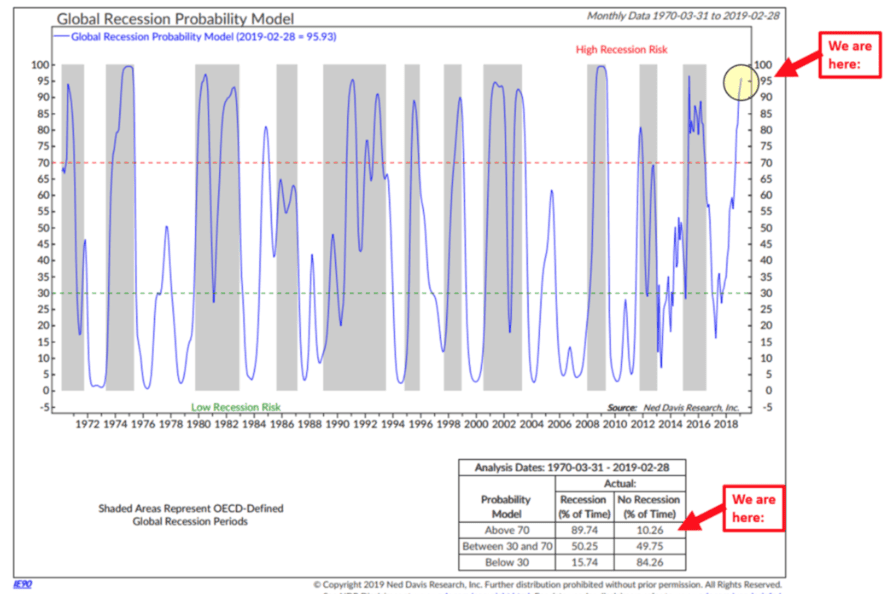
Everybody also knows that global growth has been slowing, for a while now. NDR’s Global Recession Probability Model (via CMG Wealth) shows that much of the world has been in recession since the latter part of last year.
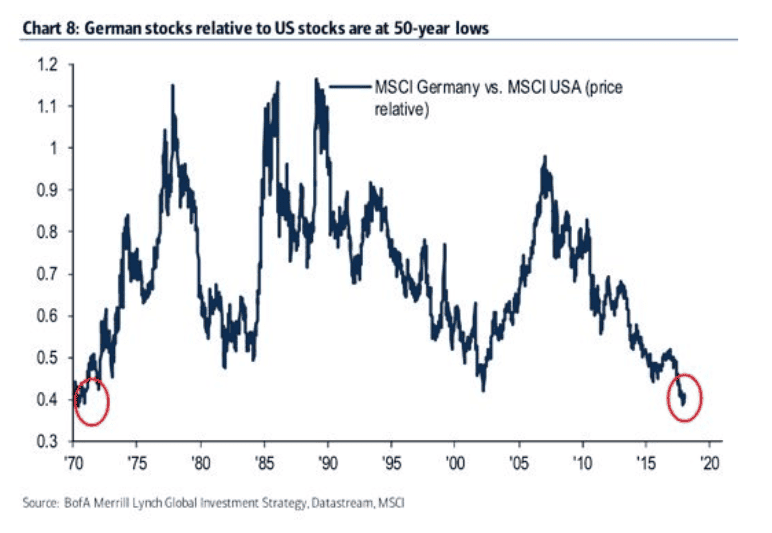
Most global markets are already reflecting this. Take Europe for example where German equities are trading at 50-year lows relative to the US. And emerging market stocks spent all of 18’ in a gut-wrenching bear market.
It seems to me that there remains a pretty low bar for the global economy to clear in order to cause a shift in the popular market expectations.
There are a number of catalysts which could this.
We have the coming 100-year anniversary of the Chinese Communist Party which we believe the CCP will want a strong economy for. In which case, they’d likely have to start easing significantly in the second half of this year.
There’s also a potential for the trade war to get settled. We are entering election season after all and the President has made it pretty clear how important the stock market’s performance is to him.
And then there’s also the little-noticed changes going on at the margins which I’ve been discussing recently.
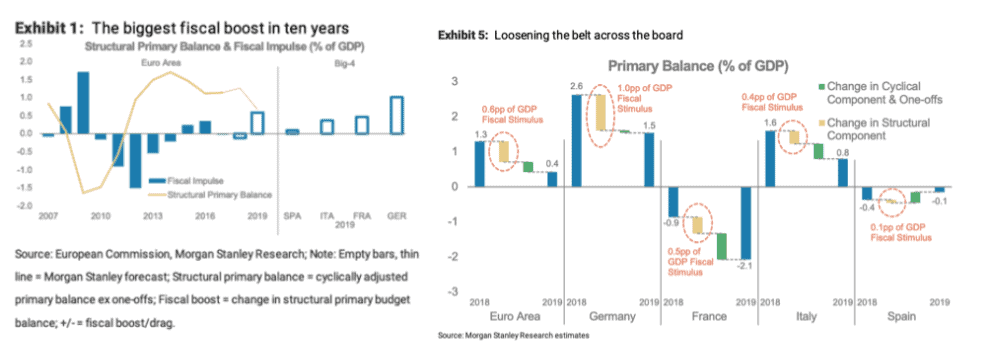
There’s the possibility that the atrocious econ data in Europe bottoms soon. At least for a while. After all, we are about to see the biggest fiscal boost our of Europe in a decade (charts via MS).
And European dataflow is already beginning to slowly improve.

Turning to the US, we are seeing some slowing growth. But our confluence of recession indicators are not flashing red, as of yet.
The labor market is still strong and signs of financial stress remain mum. Our liquidity indicators are all miles away from indicating recession and in fact, are very supportive of risk-assets moving higher.
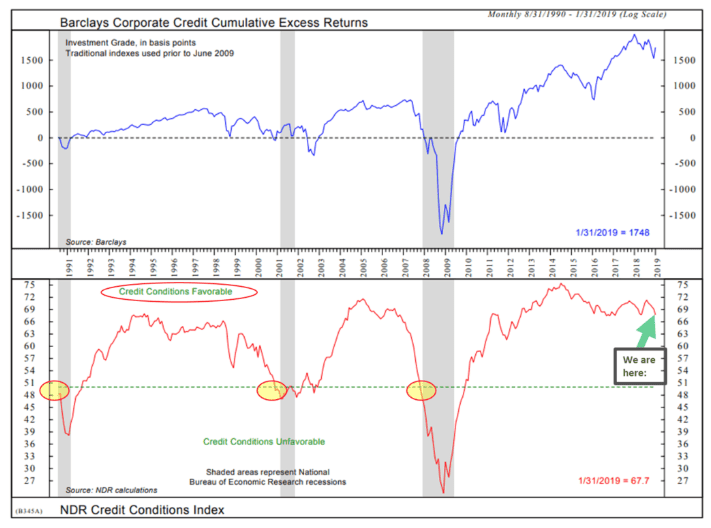
NDR’s Credit Conditions Index (via CMG Wealth) shows that credit conditions are near cycle highs and a loooong ways off from signaling recession.
I understand that this may not be a very popular take — which means it’s more likely to be true — but I think the current macro conditions continue to set up to be extremely bullish for stocks. Note that I say stocks and not the economy. Remember, the two are not the same.
Trading legend Bruce Kovner once remarked that “As an alternative approach, one of the traders I know does very well in the stock index markets by trying to figure out how the stock market can hurt the most traders.”
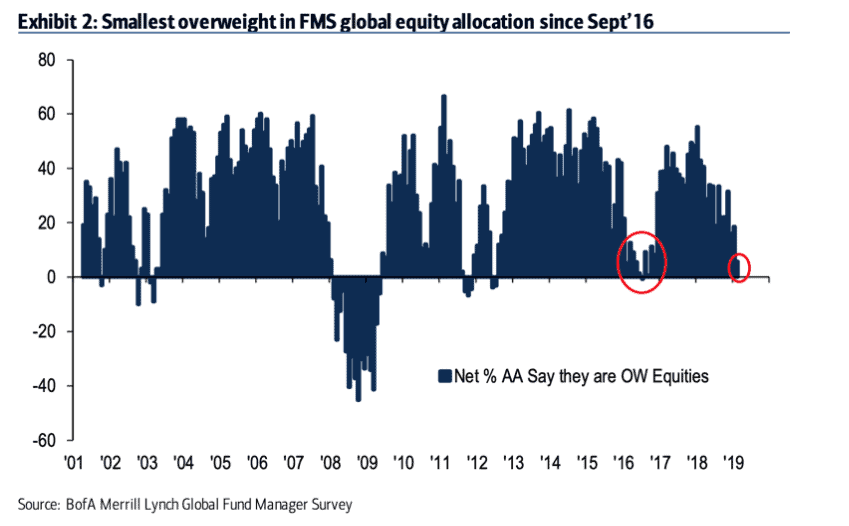
Fund manager cash holdings are the highest they’ve been since January 09’.

Their allocation to equities are at some of the lowest levels this cycle.
So, let me ask you… Where is the pain trade? Higher or lower?
I think it’s pretty clear where I think it is.
On December 18th of last year. When the market was in total panic. I wrote the following.
The following week, on December 24th. The day before the very low of the selloff was reached, I sent this out in a note.
I’m not trying to gloat here. I get things wrong ALL the time and don’t mind doing so. That’s not the game I’m playing. I’m playing the game of making money, not being right.
But I show this to prove a point. When I wrote the above I was ridiculed. I got emails and comments from readers saying what a “sheep” I am and how I was about to get steamrolled and yada yada yada…
I personally love this kind of feedback to my work. It means I’m onto something. I have a feeling this piece will invoke similar cries of hysteria. Especially when the market moves a little lower in the week(s) ahead.
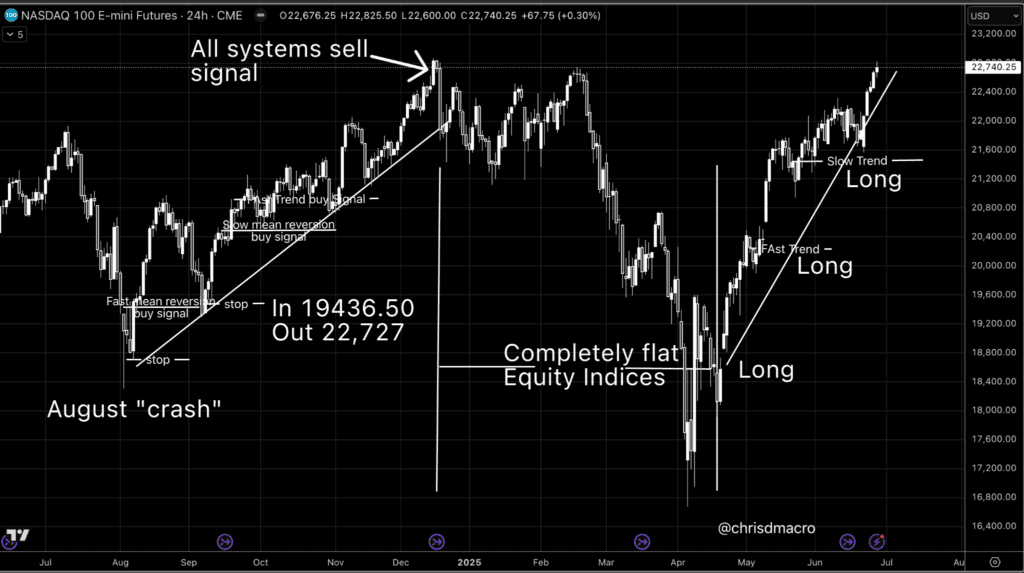
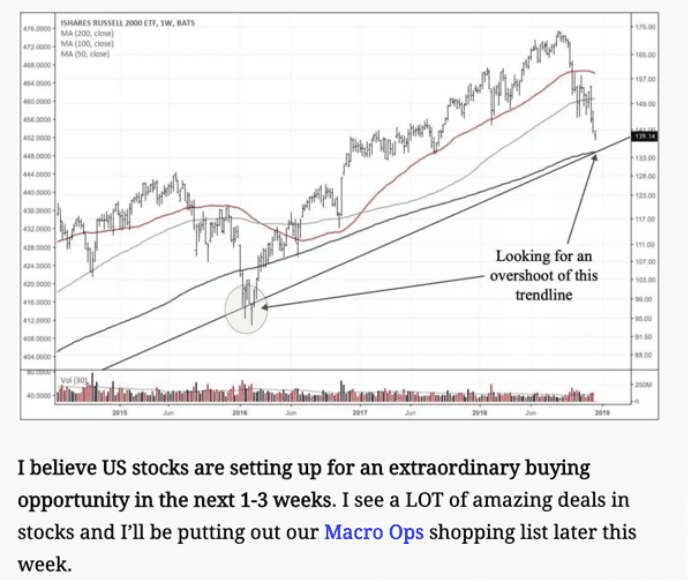
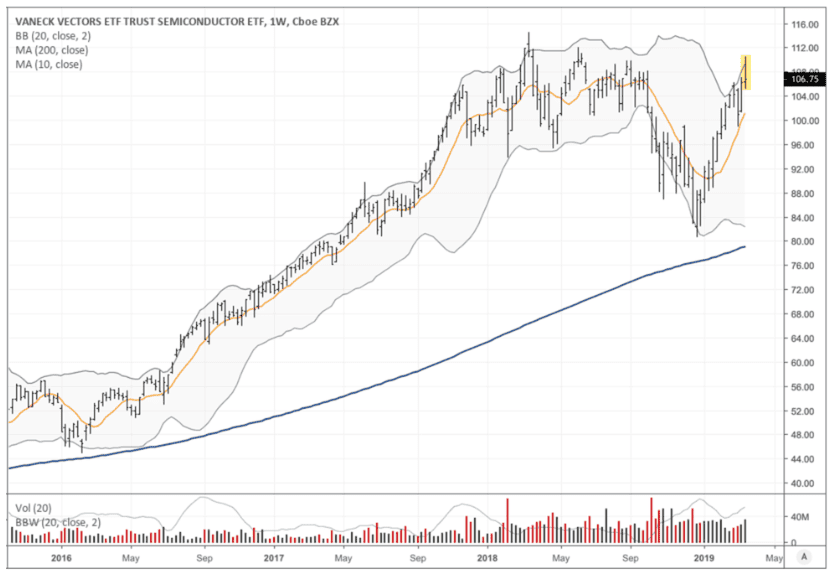
The market will be talking about the yield curve inversion, collapsing growth, and a coming recession. But I’ll be focusing on flush liquidity, a solid Fed put, and a normal technical pullback that was easy to spot (see chart below showing semis on the weekly piercing their upper BB. A move back down to around the orange line is expected).
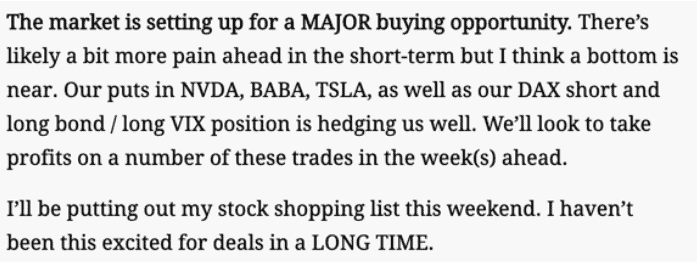
While most will be selling into the hole, we’ll be looking to add to our risk in a number of areas of the market where we see extraordinary asymmetric opportunities.
So, yeah… This time IS different and the world probably isn’t coming to an end. If you’ve been offsides on this year’s face-ripping rally then you may want to use the coming small pullback as a chance to get back in.
Everybody else will be shorting into the hole…