Most of the time I talk about trading in a systematic, but very approachable way. When you think about it, the most important parts should not be complicated, and they should be easy to understand.
I try to focus on what moves the needle for traders, what’s important and not the millions of different things that CNBC tells you is important.
But every now and then, when I feel that the reader (you) is ready to dig into something that I find completely intoxicating, then I have to share it.
NERD ALERT!
Today, we’re analyzing two sophisticated trading systems that represent different approaches to systematic trading:
- A long/short Momentum Strategy using Macro ETF’s
- A Machine Learning Regime Detection Long Only Trend using Equities.
Enhanced ETF Rotation Strategy: A Multi-Factor Approach
—————————————————
This strategy stands out for its sophisticated approach to asset rotation across a diverse ETF universe. What makes it particularly interesting is its combination of momentum, trend following, and volatility targeting, all while maintaining strict risk controls.
Key Strengths:
- Adaptive position sizing based on both individual and portfolio-level metrics
- Sophisticated correlation-based diversification
- Clear risk management through position and leverage limits
- Broad market coverage across multiple asset classes
The strategy’s use of a 3-month lookback period (reduced from the traditional 6-12 months) is an attempt to capture shorter-term market movements while still maintaining enough data for reliable signals. The maximum leverage of 2.0x and individual position caps of 40% provide meaningful exposure while preventing over-concentration.
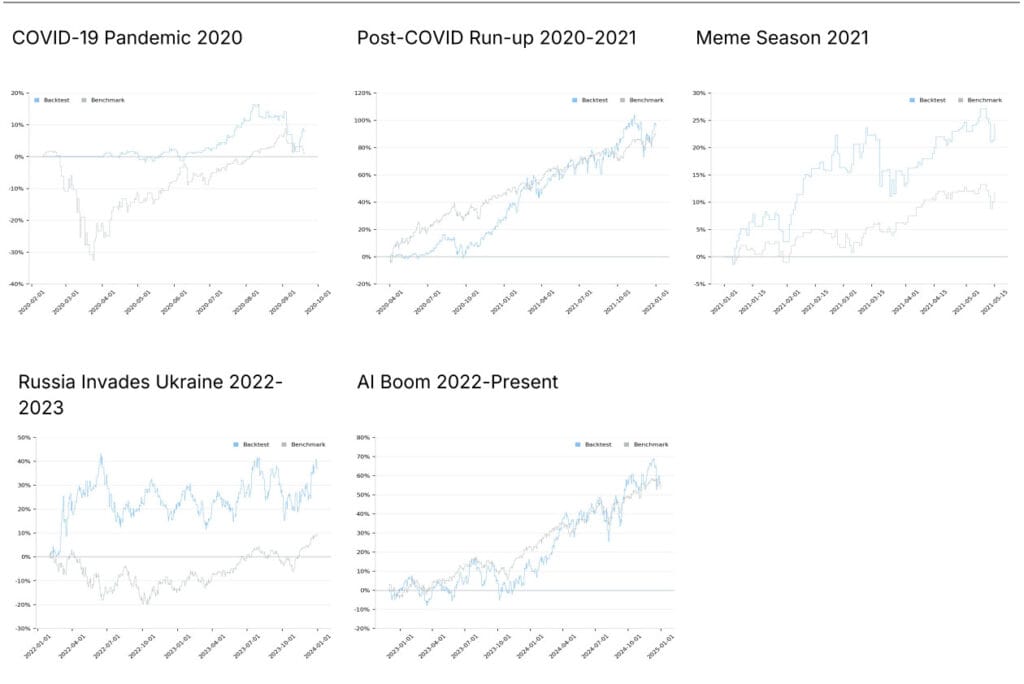
Universe selection is core to this strategy as it is long/short so choosing assets that adjust to the global macro environment either trending up, down, or not at all is imperative. So assets like Commodities, Currencies, Bonds, Emerging Markets and Developed Markets adjust up and down with the macro economic environment.
The strength of the trend, both long and short, is how positions are allocated, with a minimum trend score required.
This means that if nothing is trending, the system won’t be forced to take any trades. And if the trend is on, but weak, the system isn’t forced to take large positions.
Each month, the system looks at all the assets in the universe, gives each a score, then increases or decreases position sizing or outright exits the positions.
That’s it, once a month, and then we let it breathe.
All this sounds great. Now, let’s see what it looks like.
Period: Jan 1, 2020- Jan 1 , 2025
Starting Balance $100,000
Here’s the Equity Curve:
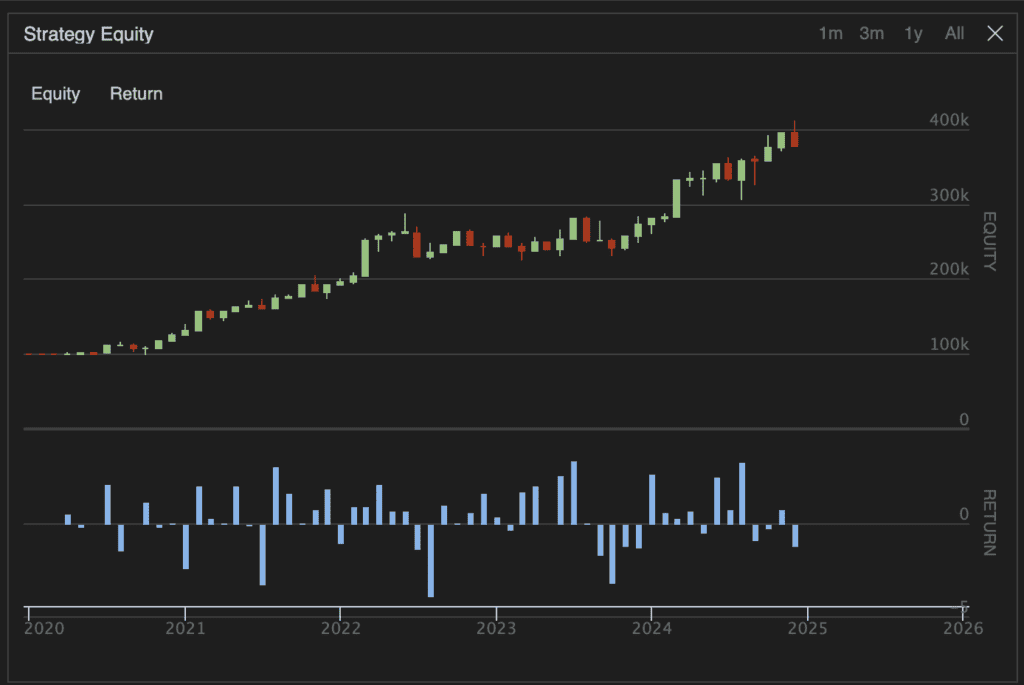
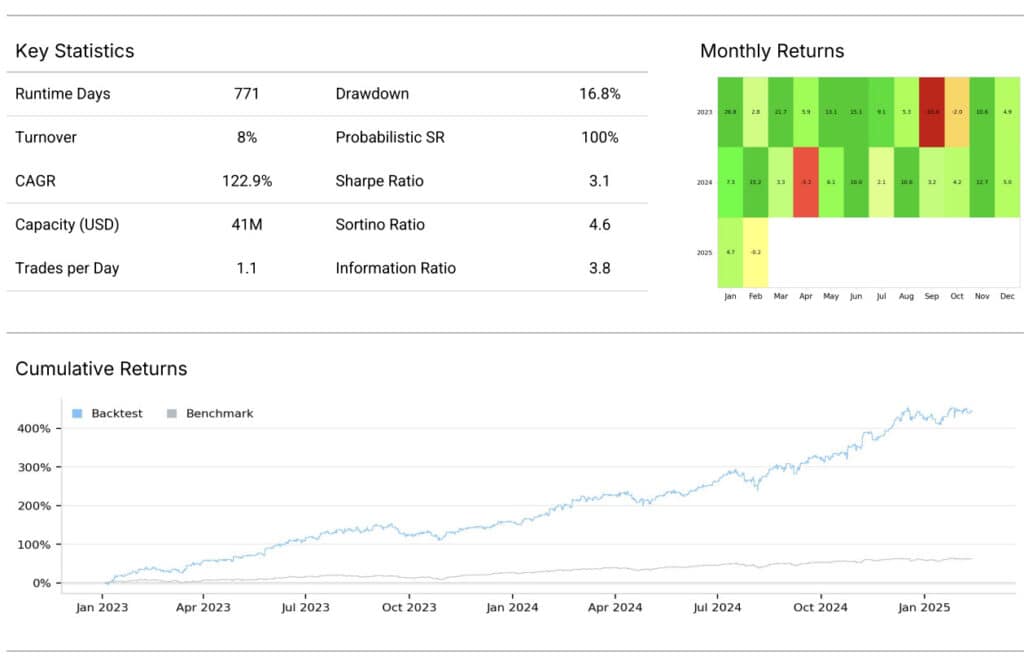
And here are the key metrics.
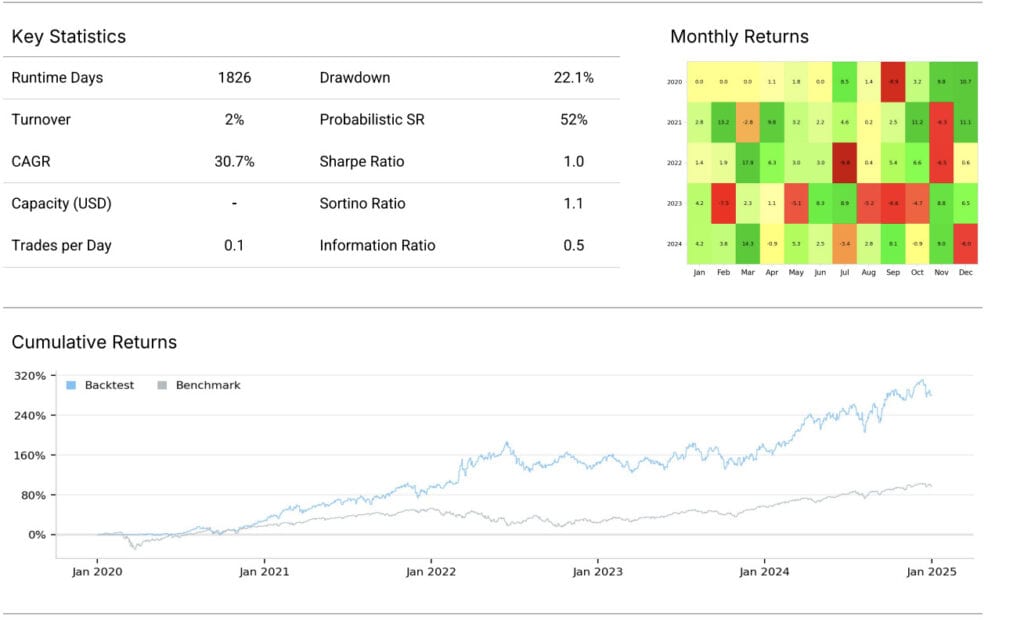
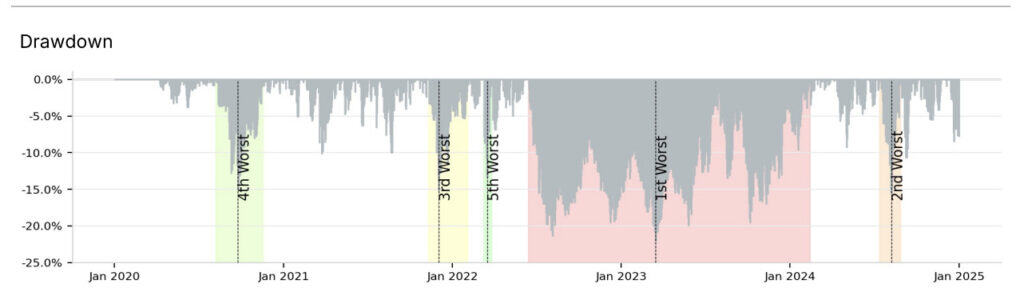
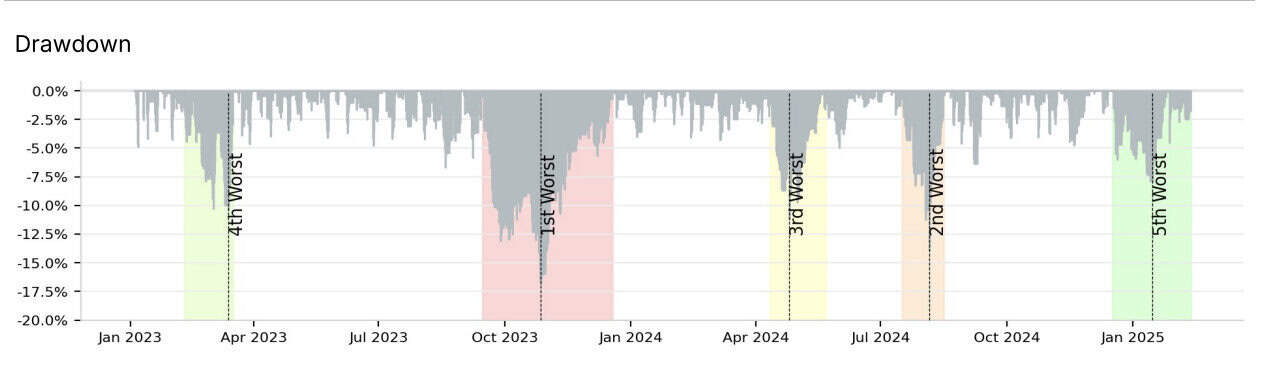
There’s a whole bunch of places to improve this system, but what I love about it is that it outperforms on both the upside with a >30% Compounded Annual Growth Rate (CAGR) while only having a -22% Drawdown.
Compared to buy and hold S&P500, 60/40 or QQQ, which all had drawdowns greater than -30% during the same period. They also weren’t anywhere near the 30% CAGR.
This is the sort of system that can keep you in the game when everyone else are losing their minds!
The system is like a modern-day family car, with a big V8 engine, seat warmers, four-wheel drive, TVs for all passengers, and Wi-Fi.
It’s comfortable, easy to drive, and super easy to maintain.
But it isn’t the car that Magnum P.I. would be caught dead in.

You wouldn’t see Sonny Crocket from Miami Vice anywhere near it.

Steve McQueen would just laugh at it.

Ok, I’ll stop.
These guys would go for the Italian race cars of trading strategies, aka—artificial intelligence-based algorithms.
These are all about top-end performance but a pain to drive in traffic.
Our next strategy uses Machine Learning to identify the market regime at the beginning of each day, then crafts a portfolio from the top stocks by market capitalization…
It then uses Machine Learning to identify the best strategies for each asset in the appropriate market regime…while also adjusting for risk and sizing…
This system represents a modern approach to quantitative trading, leveraging machine learning while maintaining traditional risk management principles. What’s particularly noteworthy is how it combines advanced ML techniques with time-tested technical indicators.
Innovative Features:
- Daily model retraining to adapt to changing market conditions
- Comprehensive technical feature set for regime detection
- Sophisticated volatility targeting system
- Clear risk parameters with fixed stop-loss and take-profit levels
The strategy’s use of multiple technical indicators (RSI, MACD, ATR, OBV, etc.) as input features for the XGBoost model shows a thoughtful approach to feature engineering, while the 2% per-trade risk limit and 20% volatility target demonstrate solid risk management principles.
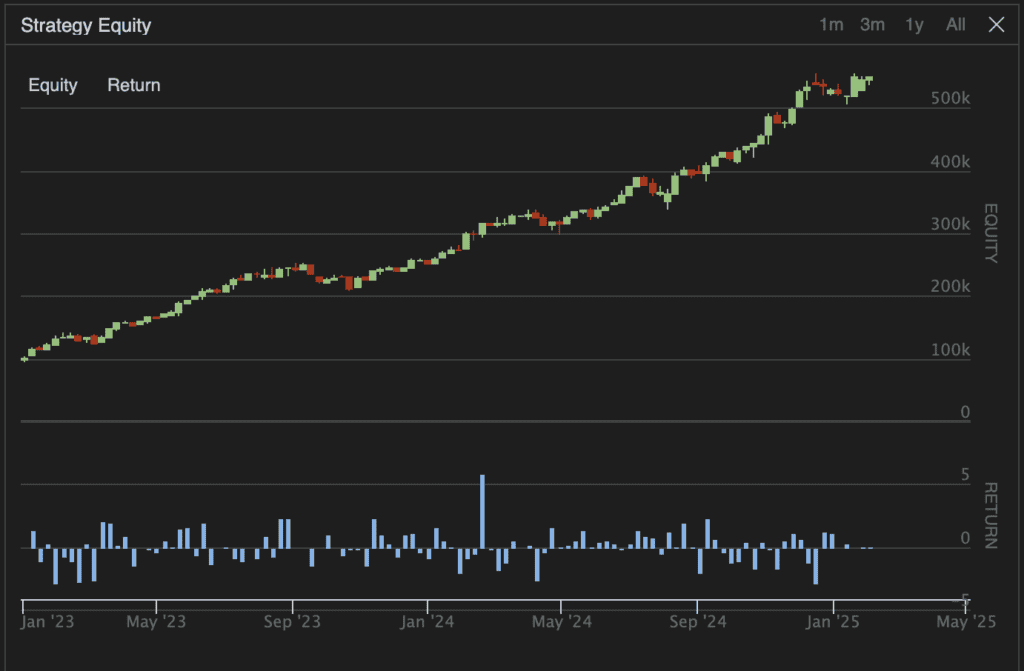
Let’s have a look at the results – this one doesn’t disappoint.
January 2023 to January 2025
Beginning Balance $100,000
Here’s the Equity Curve
Comparative Analysis
Both strategies share some common elements in their approach to risk management:
1. Both employ volatility targeting (30% for ETF Rotation, 20% for ML Regime)
2. Both use sophisticated position sizing algorithms
3. Both incorporate multiple market factors in their decision-making
However, they differ significantly in their execution:
- The ETF strategy focuses on monthly rebalancing, while the ML strategy trades daily
- The ML strategy has explicit stop-loss levels, while the ETF strategy relies on periodic rebalancing
- The ETF strategy can take larger individual positions (up to 40%) compared to the ML strategy’s more conservative approach
Implementation Considerations
For those considering implementing either strategy, here are key points to consider:
ETF Rotation Strategy:
- Requires reliable data for multiple ETFs across asset classes
- Monthly rebalancing reduces transaction costs
- Needs robust correlation calculation capabilities
- Consider adding explicit stop-loss mechanisms
ML Regime Detection:
- Requires significant computational resources for daily model training
- More frequent trading may lead to higher transaction costs
- Need for reliable technical indicator data
- More complex to maintain and monitor
Looking Forward…
Both strategies represent modern approaches to systematic trading, each with its own merits. The ETF Rotation strategy might be more suitable for larger portfolios due to its broader market exposure and lower trading frequency. The ML Regime Detection strategy could be more appropriate for traders who can handle higher operational complexity and have the necessary infrastructure for daily model training.
As always, proper backtesting and paper trading are recommended before implementing either strategy with real capital. Consider your specific circumstances, including trading costs, technological capabilities, and risk tolerance.