***Note: As a thank you for following along with us this year, we’re releasing three premium reports that were previously only available to our Collective members. The following is report number two.
This research is part of the work our team is doing to prepare for the 2023 Macro Regime Shift. If you want to protect your portfolio and prepare yourself for the big macro changes coming in the new year, then make sure you sign up for the Macro Ops Collective today. Enrollment will be open until Sunday, January 1st.
Inflation is one of the most important and yet least understood dynamics of the economic machine. It’s one of the Four Forces that drive long-term asset returns, these being:
- Real economic growth
- Inflation
- Asset supply
- Asset preferences
Inflation, like everything in economics, moves in cyclical waves due to the reflexiveness intrinsic to its dynamic process.
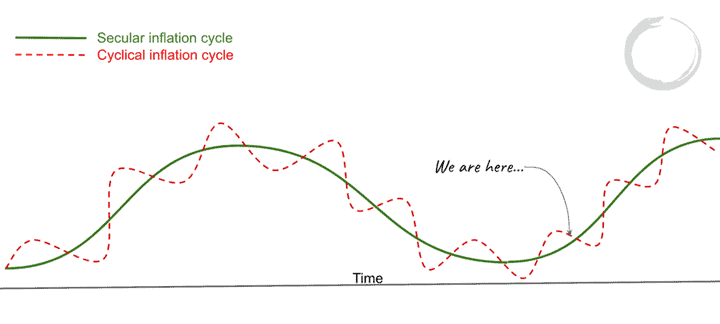
Like debt cycles, there are secular long-term waves and shorter cyclical ones. The lengths of each vary and are dependent on the drivers and conditions behind them.
There’s also a big difference in inflation dynamics between hard currency countries that are internally financed (DM countries) and soft ones, like most emerging markets which are dependent on external financing.
For the purposes of this piece, we’ll be focusing on the former, and in particular, on the US. We’ll leave the rest to explore at a later date.
We’ll start by going through cyclical inflation; exploring what it is, what its drivers are, and how it impacts markets. Then in a follow-up piece we’ll dive into the more misunderstood aspects of inflation including its longer-term secular dynamics.
The hope is that this discussion will enable you to more effectively navigate where we’re headed… which, I’ll argue, is into a new rising secular inflation regime following a cyclical decline in prices.
The result of this will be a new baseline level of inflation. This baseline will be in the 3%-6% range over the next decade, which is dramatically higher than what it’s been for the past 30+ years.
Milton Friedman is wrong…
In 2009, Warren Buffett wrote in his annual report to shareholders that (emphasis by me):
This debilitating spiral has spurred our government to take massive action. In poker terms, the Treasury and the Fed have gone “all in.” Economic medicine that was previously meted out by the cupful has recently been dispensed by the barrel.
These once-unthinkable dosages will almost certainly bring on unwelcome aftereffects. Their precise nature is anyone’s guess, though one likely consequence is an onslaught of inflation. Moreover, major industries have become dependent on Federal assistance, and they will be followed by cities and states bearing mind-boggling requests. Weaning these entities from the public teat will be a political challenge. They won’t leave willingly.
Inflation briefly spiked to 3.8% on the back of a major bull run in oil prices before rolling over to around 1.5% for the remainder of that cycle.
This is not to pick on Buffett. He was in good company with that bad inflation call. It was the popular take amongst most big-name investors at the time, all who clearly got it wrong.
The reason they got it wrong is that they didn’t understand the transmission mechanism of inflation — what drives it, and more importantly, what makes it stick.
In 09’, Bernanke’s Fed embarked on a new financial experiment. It was something called quantitative easing (QE), which we are now all too familiar with, but which was a novel concept at the time.
The process involved the Fed buying assets from the financial sector, swapping reserves (cash balances that banks hold at the Fed) for financial assets (USTs and MBSs). This raised M0, a measure of the monetary base, also known as “high-powered money.”
Market participants, like Buffett and Druckenmiller, looked at this large-scale increase in the monetary base and, working off Milton Friedman’s famous dictum that “Inflation is always and everywhere a monetary phenomenon,” predicted prices would skyrocket.
But this new “money” just sat on bank balance sheets because consumers weren’t in a position to borrow and banks weren’t in a mood to lend. So the total money in the system actually stayed muted and spending (demand) flat. In addition, the lack of real stimulus in the system (due to Tea Party popularity and hawkish tendencies in DC) meant the labor market was slow to recover and so a lot of capacity in the system sat idle.
The result, of course, was low inflation.
To really understand this dynamic, we need to discuss the Transactions Based Approach (TBA) and the real nature of money.
Here’s a section from Bridgewater’s 2015 Debt Cycle framework PDF (link here) with a good description of what the TBA is (emphasis by me).
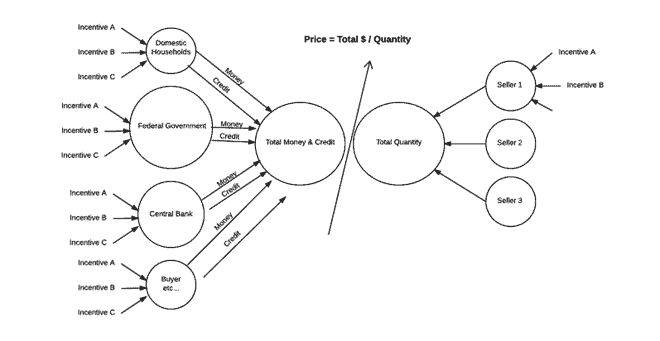
The traditional way of looking at the relationship between supply, demand and price measures both supply and demand via the same quantity number (i.e., at any point the demand is equal to the supply which is the amount of quantity exchanged) and the price is described as changing via what is called velocity.
There is no attention paid to the total amount of spending that occurred, who spent it, and why they spent it. Yet, in any time and across all time frames, the relationship between the change in the quantities exchanged and the change in the price will change based on these factors that are being ignored. Throwing all buyers into one group (rather distinguishing between them and understanding their motivations) and measuring their demand in terms of quantity bought (rather than in the amount spent) and ignoring whether the spending was paid for via money or credit, creates a theoretical and imprecise picture of the markets and the economy.
Most of what economists call the velocity of money is not the velocity of money at all – it is credit creation. Velocity is a misleading term created to explain how the amount of spending in a year (GDP) could be paid for by a smaller amount of money. To explain this relationship, people divided the amount of GDP by the amount of money to convey the picture that money is going around at a speed of so many times per year, which is called velocity. The economy doesn’t work that way. Instead, much of spending comes from credit creation, and credit creation doesn’t need money to go around in order to occur. Understanding this has big implications for understanding how the economy and markets will work.
For example, whereas one who has the traditional perspective might think that a large increase in the amount of money will be inflationary, one using a transactions based approach will understand that it is the amount of spending that changes prices, so that if the increase in the amount of money is offsetting a decrease in the amount of credit, it won’t make a difference; in fact, if the amount of credit is contracting and the amount of money is not increased, the amount of spending will decline and prices will fall.
Money = cash + credit. Most people think of money as cash. In reality, money is mostly credit. There’s approximately $5trn in physical US dollars in existence, while there’s something like $70trn in USD credit.
And because credit (demand) is more easily created and destroyed than the production of goods (supply) — like the excavation of a copper mine or the building of a lumber mill — we get price cycles.
These swings in prices then drive monetary policy, which then drives economic cycles, and so on and so forth.
This sequence is what creates the short-term Risk Cycle (aka Credit/Debt Cycle, Business Cycle, Bull/Bear Market, etc…).
Here’s an illustration of the three stages of the Risk-Cycle:
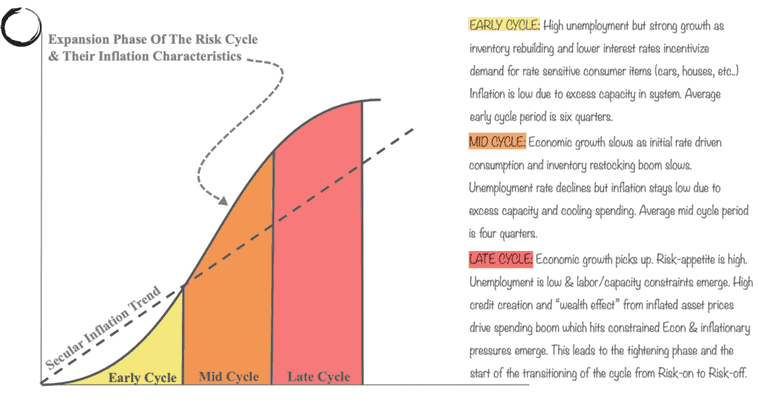
- Early Cycle: We have a mix of high unemployment (aka, lots of slack/capacity) but strong rebounding growth, due to post recession inventory rebuilding and improving demand from lower yields in more rate sensitive consumer items (ie, cars, homes, etc…) But inflation stays low as there’s plenty of capacity in the system to meet the rebounding demand. The average early cycle period lasts six quarters.
- Mid Cycle: Economic growth begins to slow as initial rate driven consumption and the tailwinds from inventory restocking subside. The unemployment rate falls but inflation remains subdued as cooling growth and excess capacity keep price pressures as bay. The average mid cycle period last 12-months.
- Late Cycle: Economic growth begins to accelerate again. The “Risk Cycle” kicks into full gear. Fears and inhibitions over the previous recession give way to new animal spirits and willingness to take on more risks. Rising asset prices create a “wealth effect” as people feel richer and borrow and spend more. This drives an acceleration in demand which runs up against an increasingly tight labor market. Wage growth begins to pick up and prices start to rise. This leads to a tightening phase and the start of the cycle’s transition from Risk-on to Risk-off.
This is the sequence of cyclical inflation.
This is what Paul Tudor Jones is referring to when he says, “You look at every bear market and they’ve always basically occurred because of an uptick in inflation and an uptick in interest rates.”
This is why there’s a well-documented relationship between the output gap and forward equity returns (link here).
The chain of causation goes from too much spending (demand) running up against too little capacity (supply). This closed output gap sparks inflationary pressures. Rising inflation leads to a restrictive Fed and higher rates, which drives equities to rerate lower and liquidity to tighten in a vicious cycle.
In our next piece we’ll define what part of the risk cycle we’re currently in and how that’ll impact inflation. And we’ll follow that up with a discussion into the causes behind secular inflation, which is where things get particularly interesting. We’ll also apply all this information in a practical manner that’ll help us better navigate the market.
Having a framework to understand the real causes of inflation will give you the insights you need to prepare for multiple market scenarios. The work our team has done in this area is part of why the Macro Ops portfolio is up over 10% this year while the the market is down -25%.
If you’d like to work with us going into the new year, make sure you join the Macro Ops Collective — our premium research service.
Collective members receive:
- Institutional Level Research: Each week, you’ll get market analysis, portfolio breakdowns, equity deep dives, and alerts of every trade we make. We do all the heavy lifting for you and share everything with 100% transparency.
- Proprietary Quant Tools: You’ll have access to the MO dashboard — our version of the Bloomberg terminal — that contains all the tools we use to find highly profitable trades.
- Profitable Time-Tested Strategies: We provide in-depth training videos to teach you how to identify the current market regime, find the best entries, manage risk, and more. You’ll be able to confidently trade any asset class under any condition.
- Superior Macro Process: You’ll gain an edge with our professional-level trading process that has given our members a consistent, repeatable way to extract profits from the market.
- Community: You’ll be able to join our private Slack group, where traders from around the world share their best ideas. You’ll also get a live Q&A session with Alex and the rest of the Macro Ops team once a month.
Click Here To Learn More And Join The Collective!
Enrollment ends Sunday January 1st at midnight. Please join before then.