There is a very important difference between being a theoretical contrarian and dealing with it in practical terms. In order to win as a contrarian, you need the right timing and you have to put on a position in the appropriate size. If you do it too small, it’s not meaningful; if you do it too big, you can get wiped out if your timing is slightly off. The process requires courage, commitment, and an understanding of your own psychology. ~ Michael Steinhardt
In this week’s Dirty Dozen [CHART PACK], we highlight persistent bearish spec positioning across US indices — except for the Nasdaq where specs are now dangerously crowded long. We then look at positive real rates, Big Trouble in Brittle China, a breakout in the loonie, and whales dumping their shares in megas, plus more…
**Note: We’re opening enrollment to the Macro Ops Collective next week.
The Collective is our premium service that offers institutional-level research, proprietary quant tools, actionable investment strategies, and a killer community of dedicated investors and fund managers from around the world.
** Enrollment opens next week on Monday, June 26th and will remain open until Sunday, July 2nd.
You can learn more about the Collective and what it can do for your investing here.
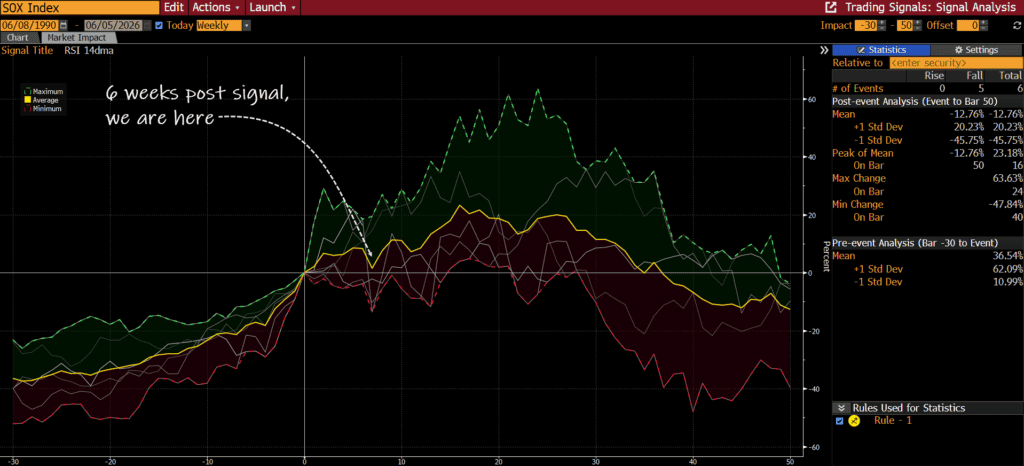
- The market remains short-term overbought. This makes it more susceptible to a pullback/consolidation in the near term. And though the Narrative Pendulum is starting to swing in the other direction, bearish positioning remains a strong persistent tailwind for equities.
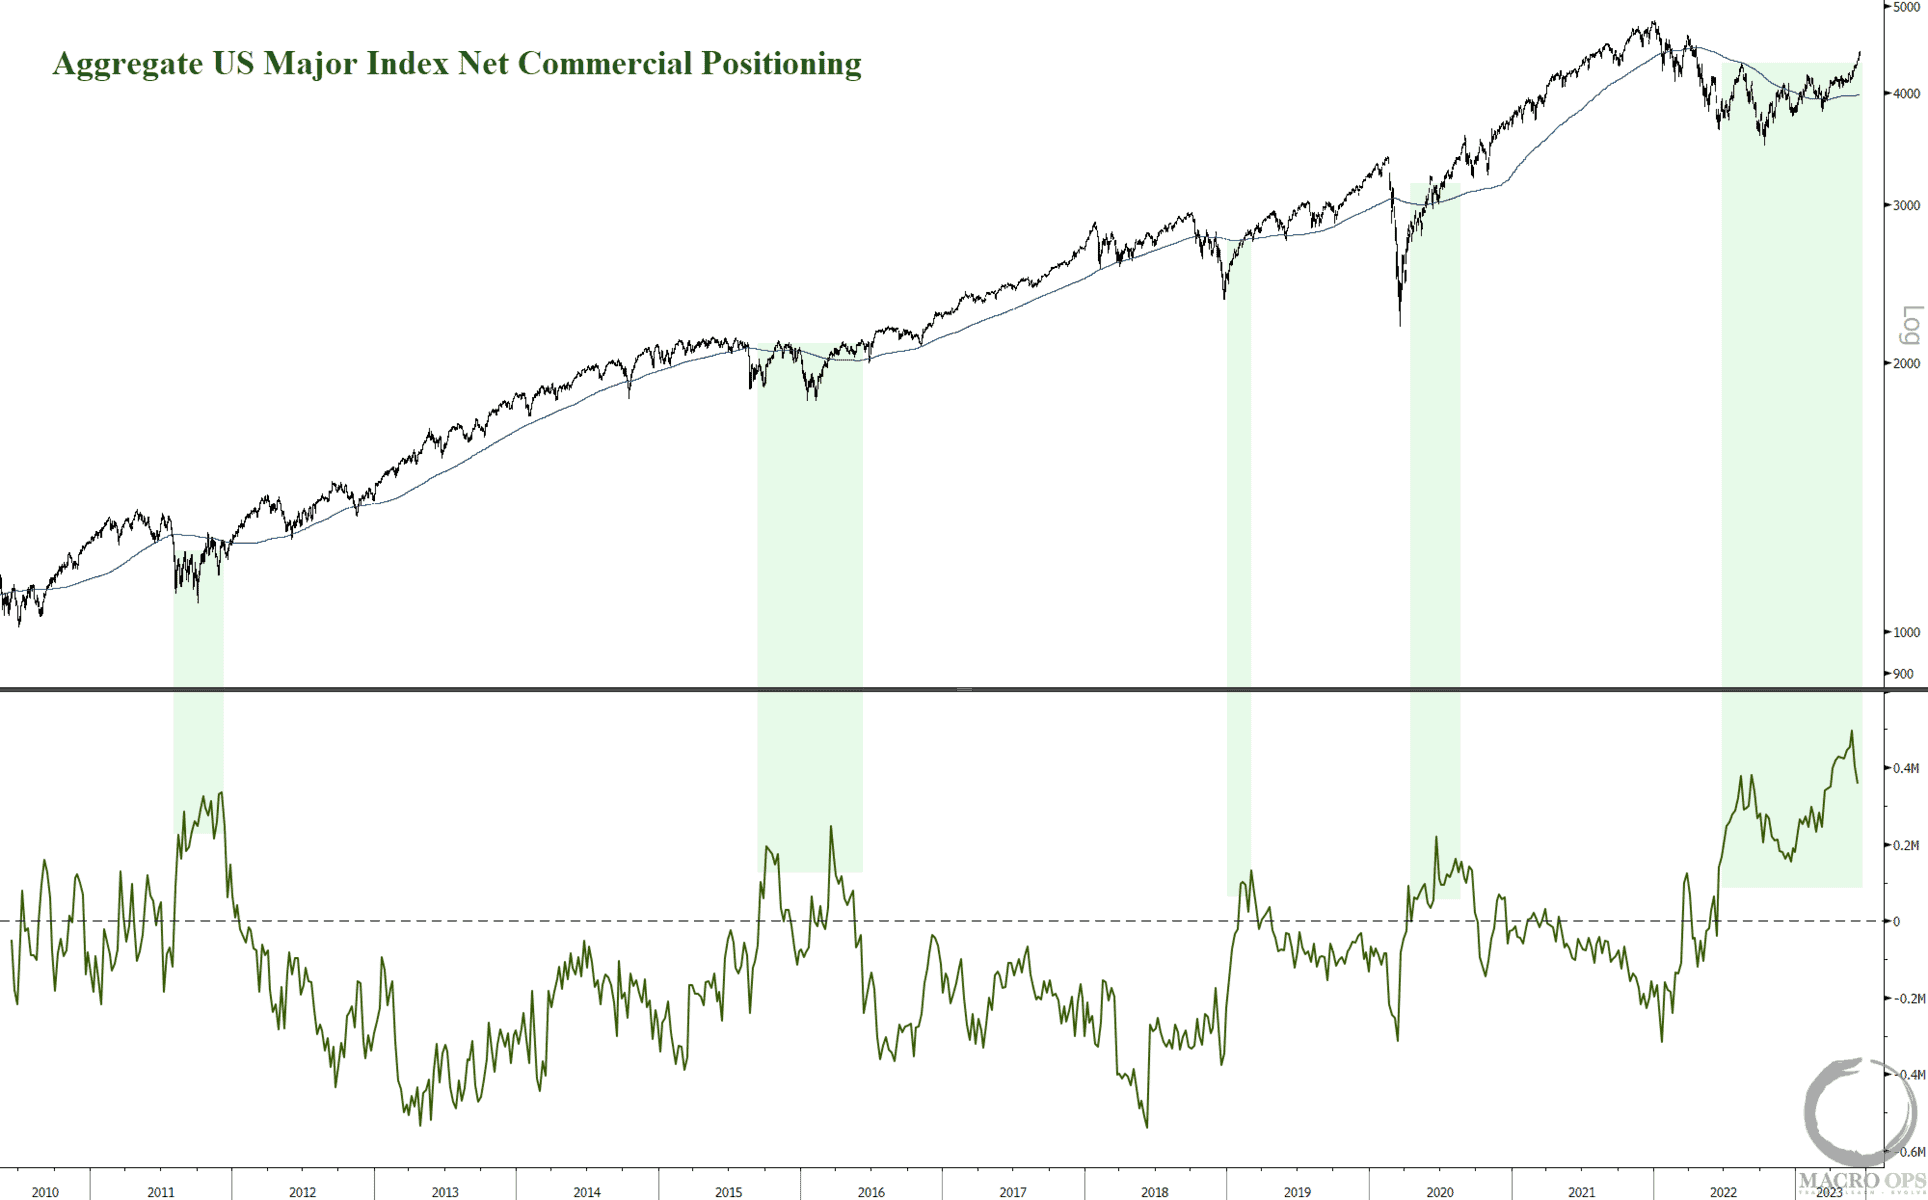
The chart below shows the aggregate US major index net commercial positioning. Commercials are very long, meaning specs are very short. This is a lot of fuel for a continued move higher.
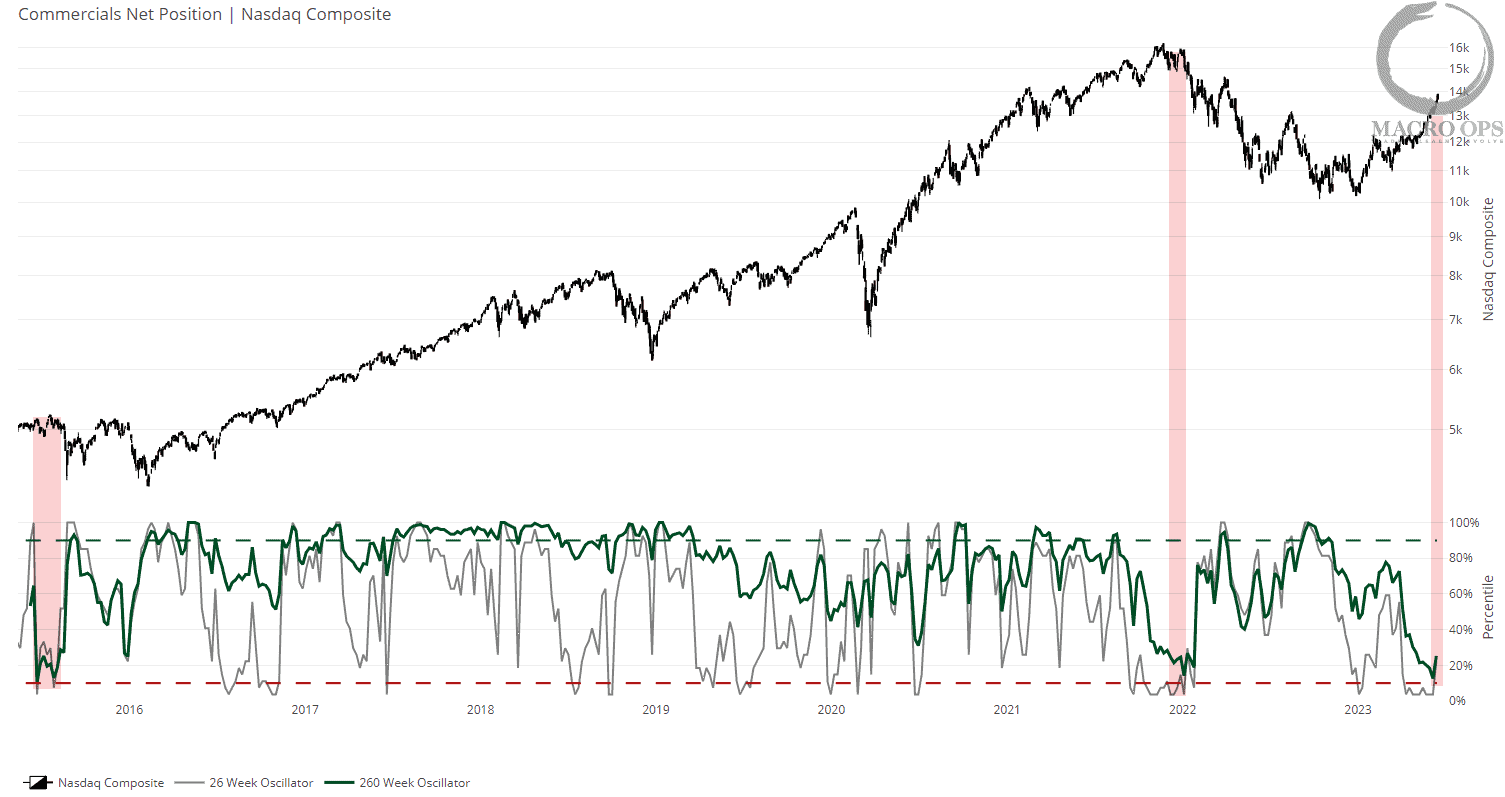
- With that said, not all indices are showing the same level of pessimism. Here’s net commercials on an OI-adjusted basis for the Nasdaq.
They contrast with the chart above with commercials here being very short (specs very long). The previous two times commercials were this short Qs, the index soon rolled over into an extended volatile patch.
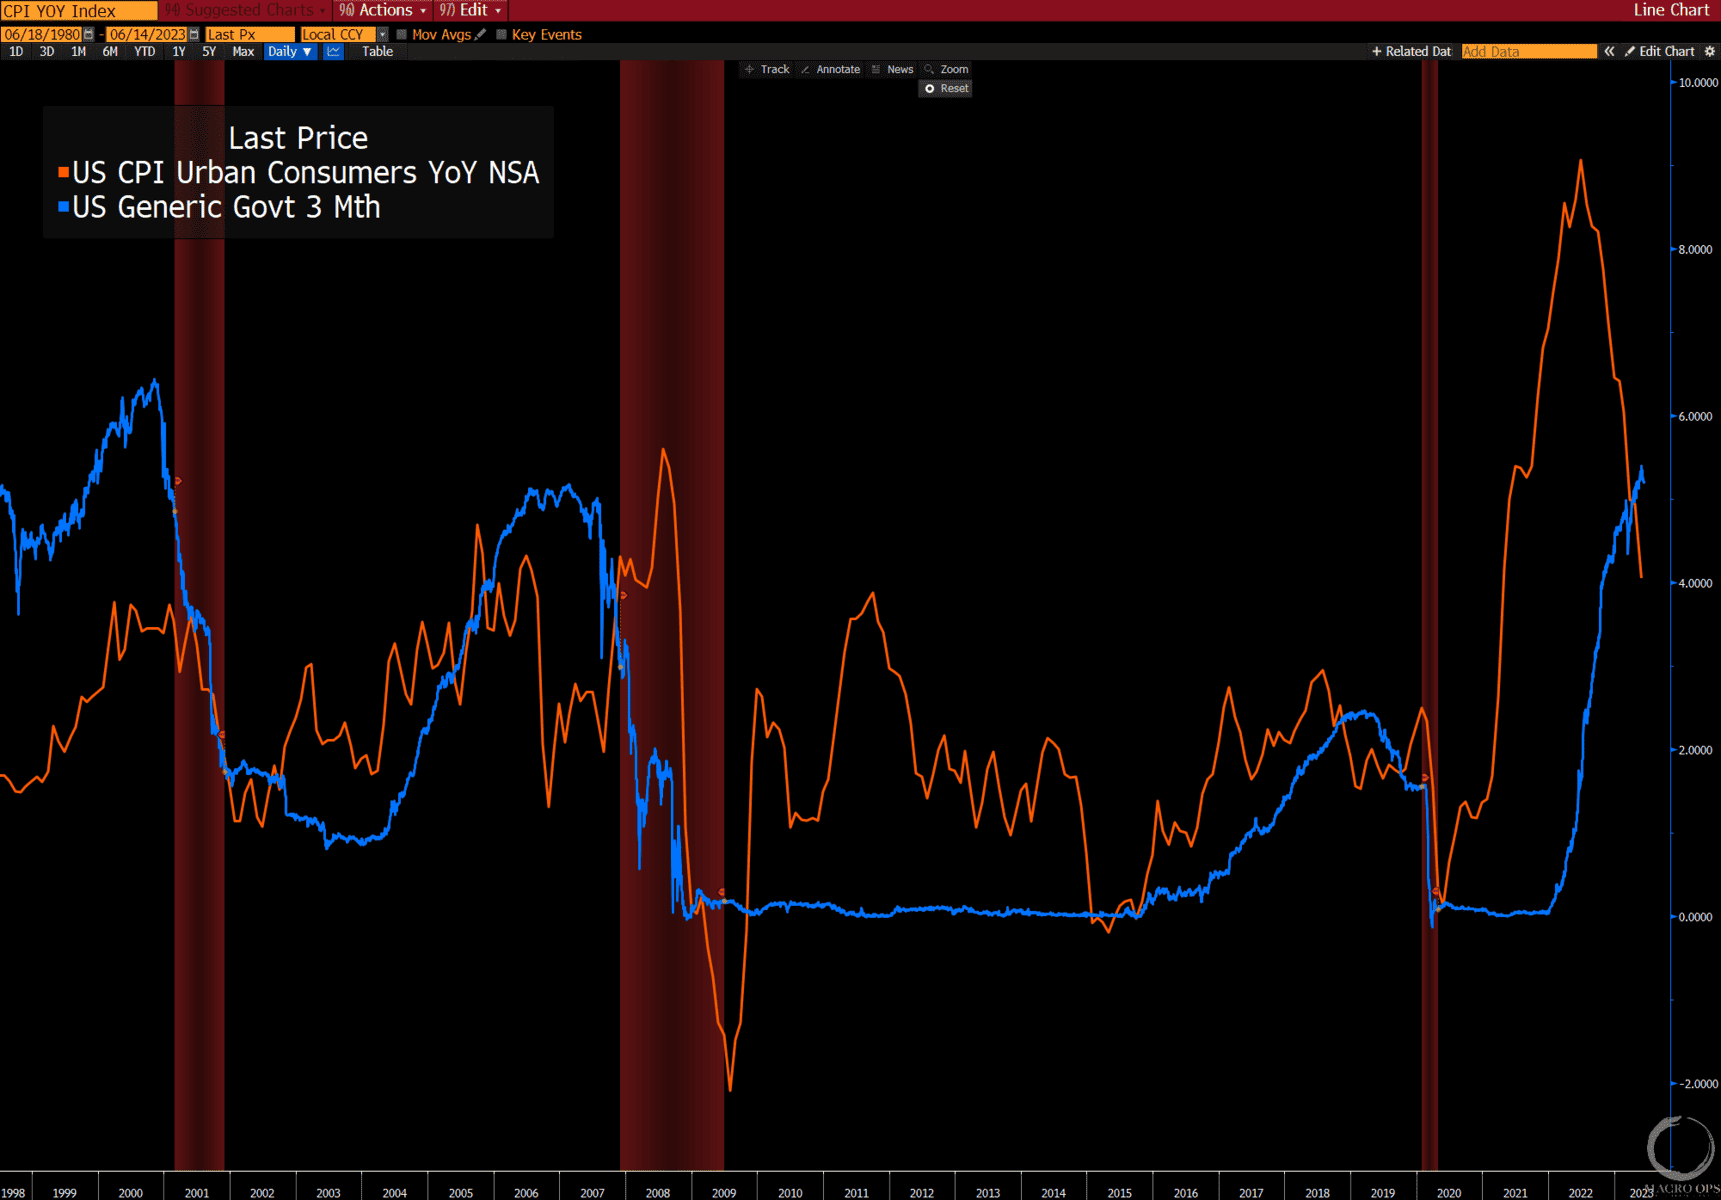
- The US 3m yield (blue line) is now above CPI for the first time since late 19’ (meaning real yields are positive). As CPI continues its trend lower, real rates will continue to rise even as the Fed stays pat, effectively tightening liquidity.
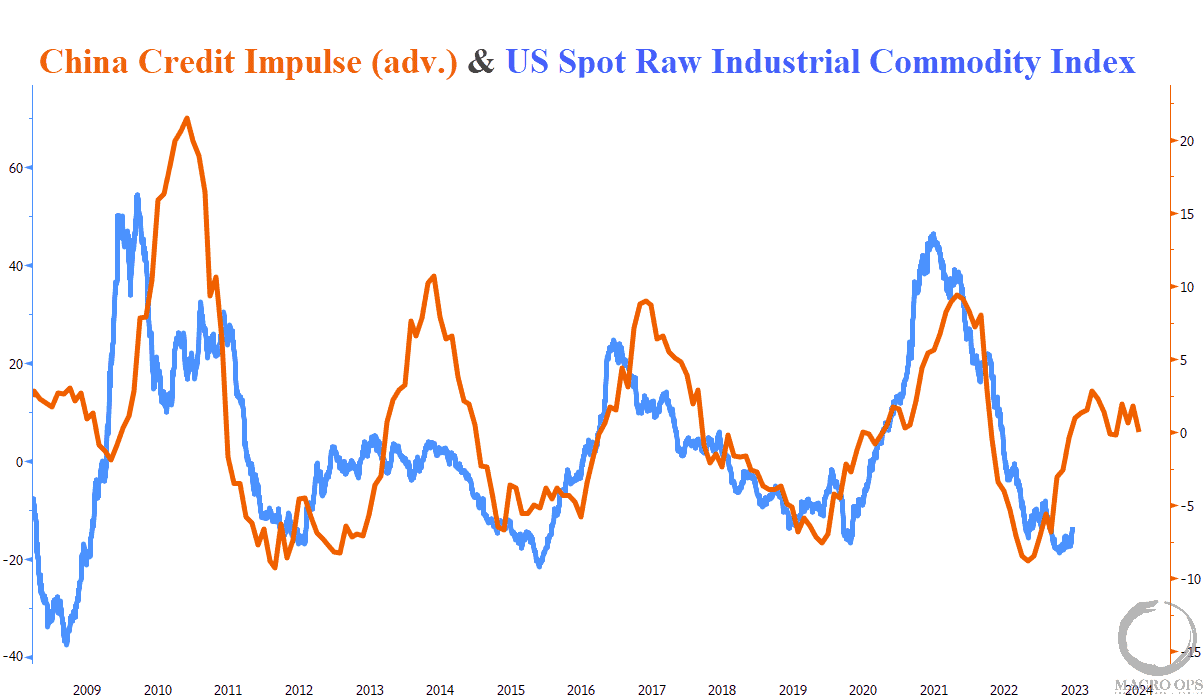
- I’ve been keeping a close eye on metals here, specifically copper. It’s been trading as if a recession is coming around the corner (a real possibility by Q4, imo). Positioning is quite bearish but so far it’s been unable to hold a durable bid.
China recently cut deposit rates in an effort to stimulate. A strengthening credit impulse has been a big driver of metals in the past (see chart below). We’ll have to see if this correlation continues.
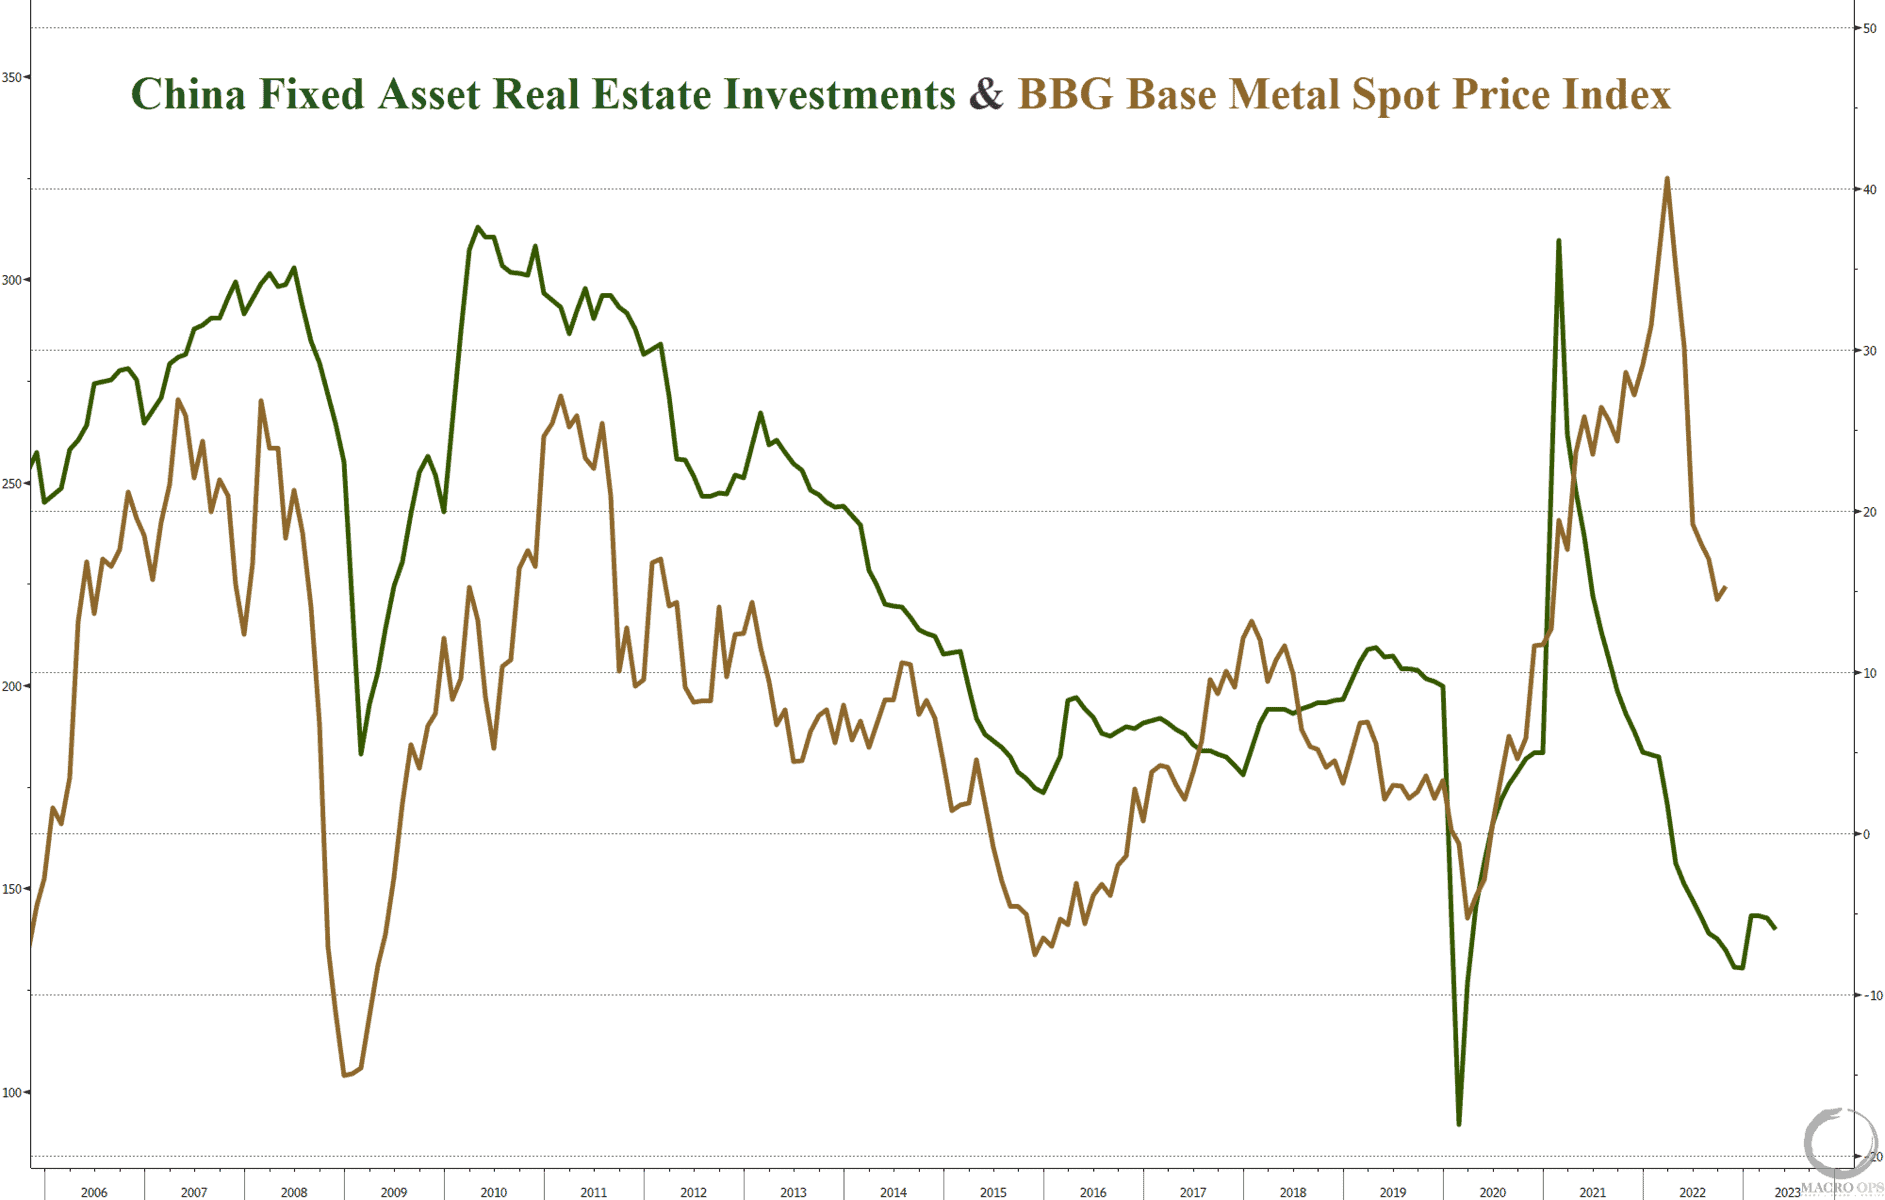
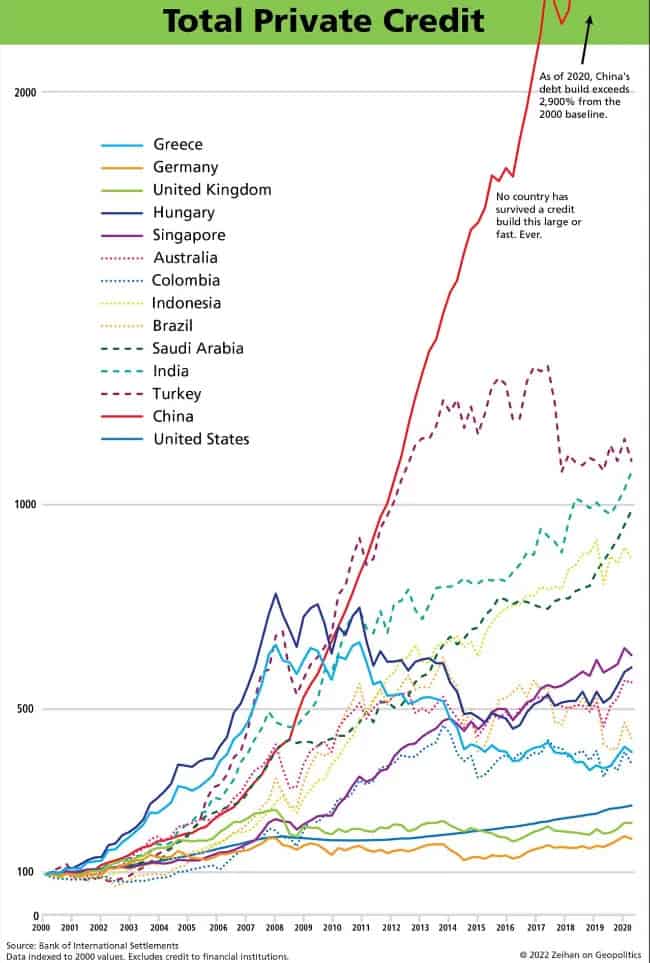
- But there’s a real possibility that China has finally crossed its Minksy moment and has started its 1990s Japan-style decline, which would be a considerable headwind for commodities
- Speaking of China, Michael Kao wrote a great post over the weekend sharing his takeaways from a recent geopolitical panel he chaired discussing the threat of a Chinese invasion of Taiwan (link here).
Peter Zeihan was the keynote and if you’ve read his thoughts on China, then you know he falls squarely into the bear camp on the country, with demographics, debt, and geography being the big reasons why.
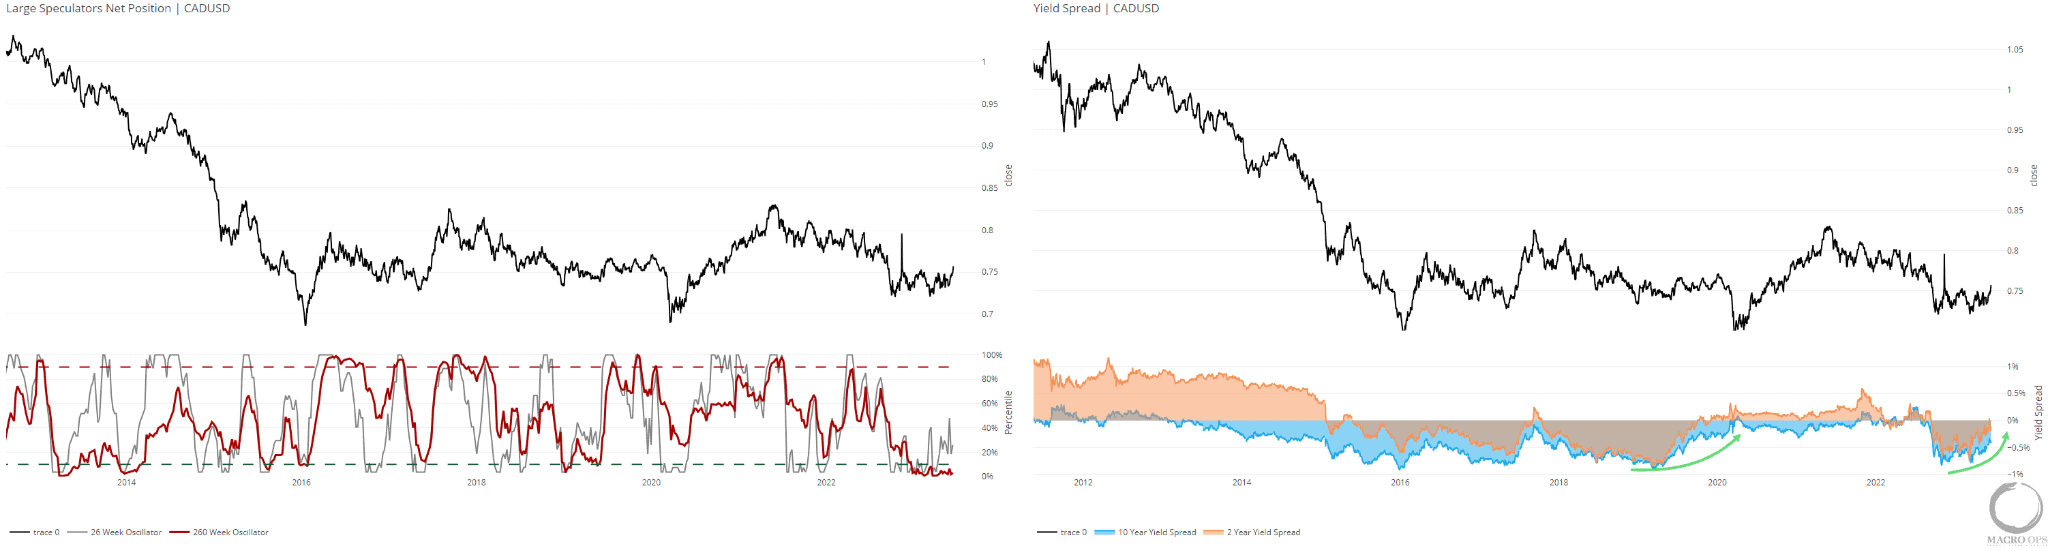
- The Canadian dollar has strongly broken out of its 8-month consolidation zone. It’s overbought over the short-term but we’re looking to enter if given an entry on pullback or consolidation near Bollinger midline.
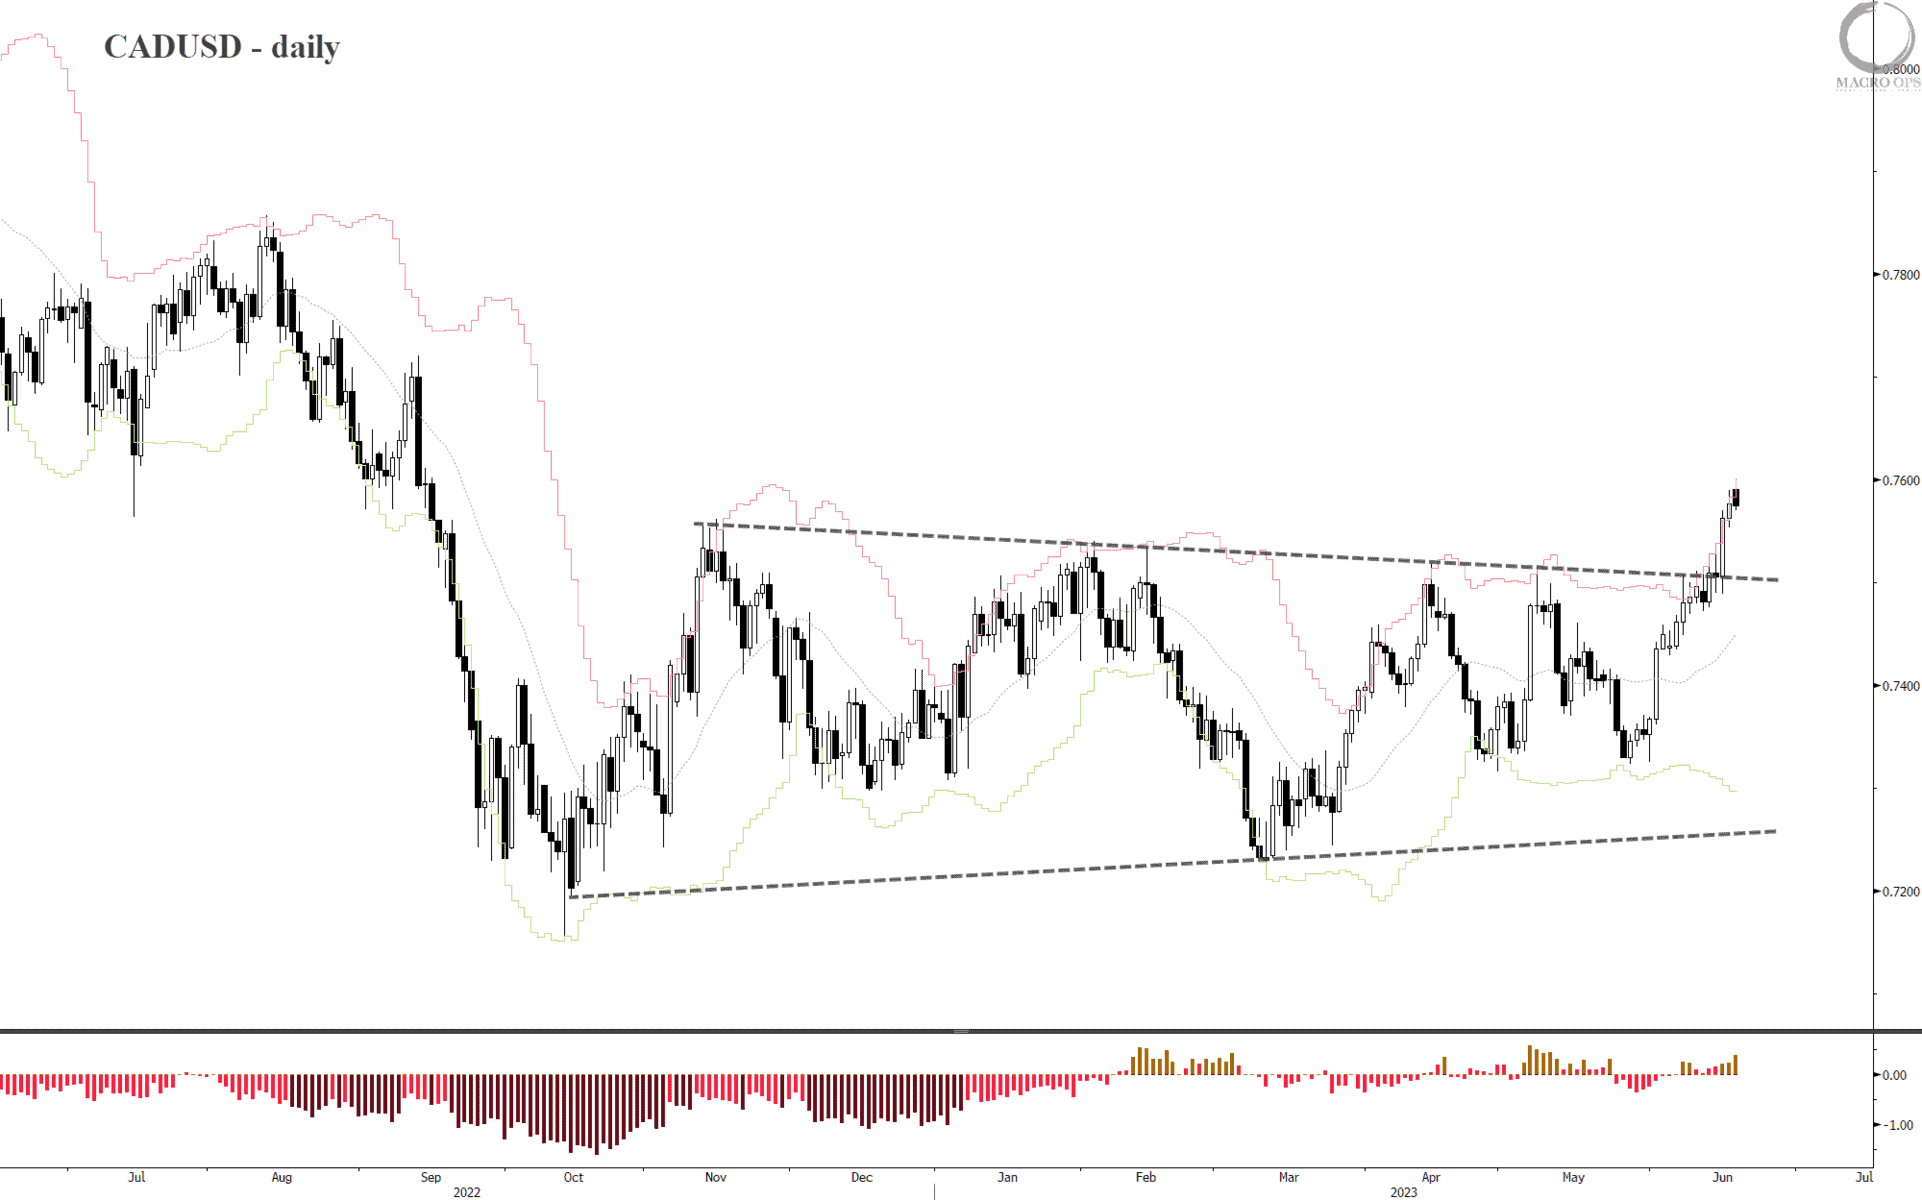
- Positioning and yield spreads are favorable to a continuation of this breakout. Large specs are crowded short while yield spread momentum is moving in CAD’s favor against USD (charts below from our HUD).
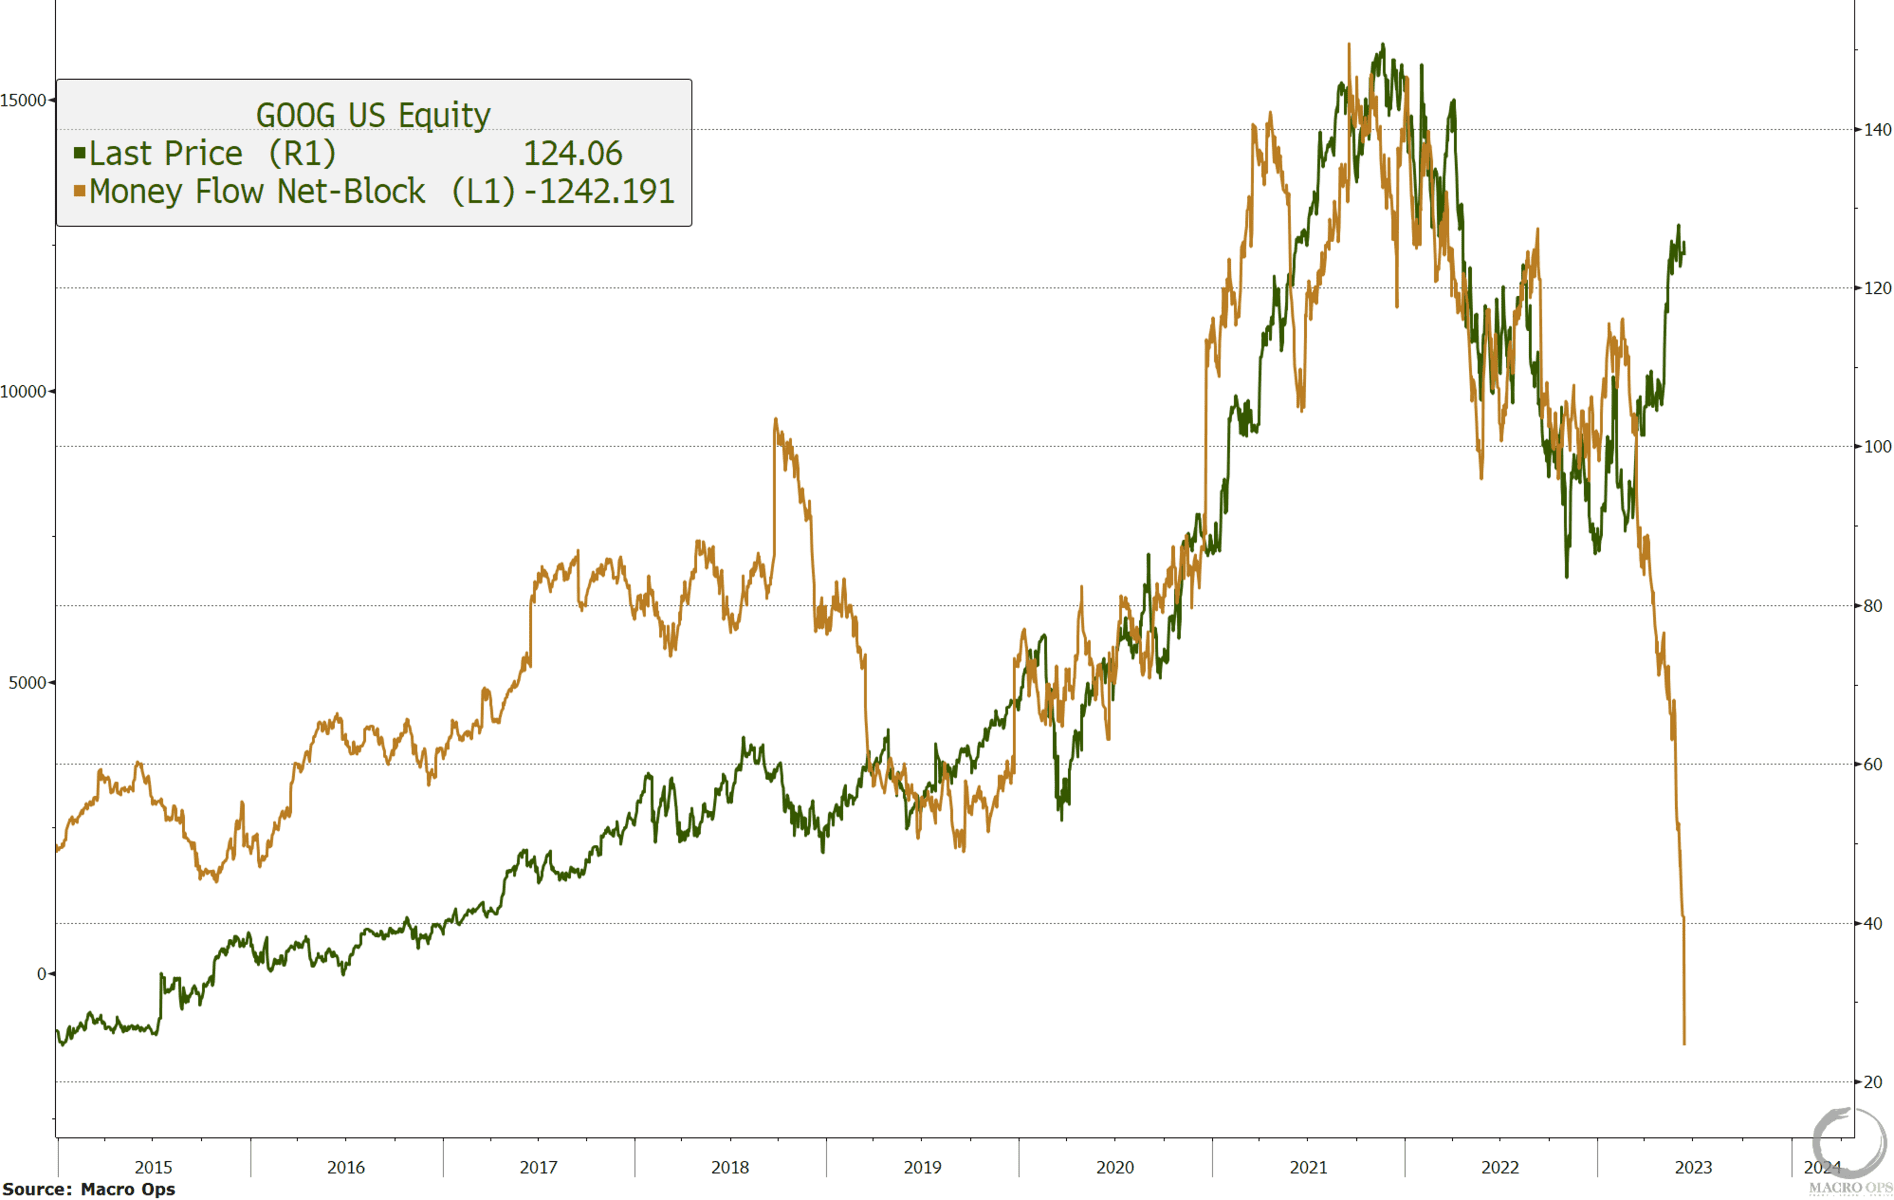
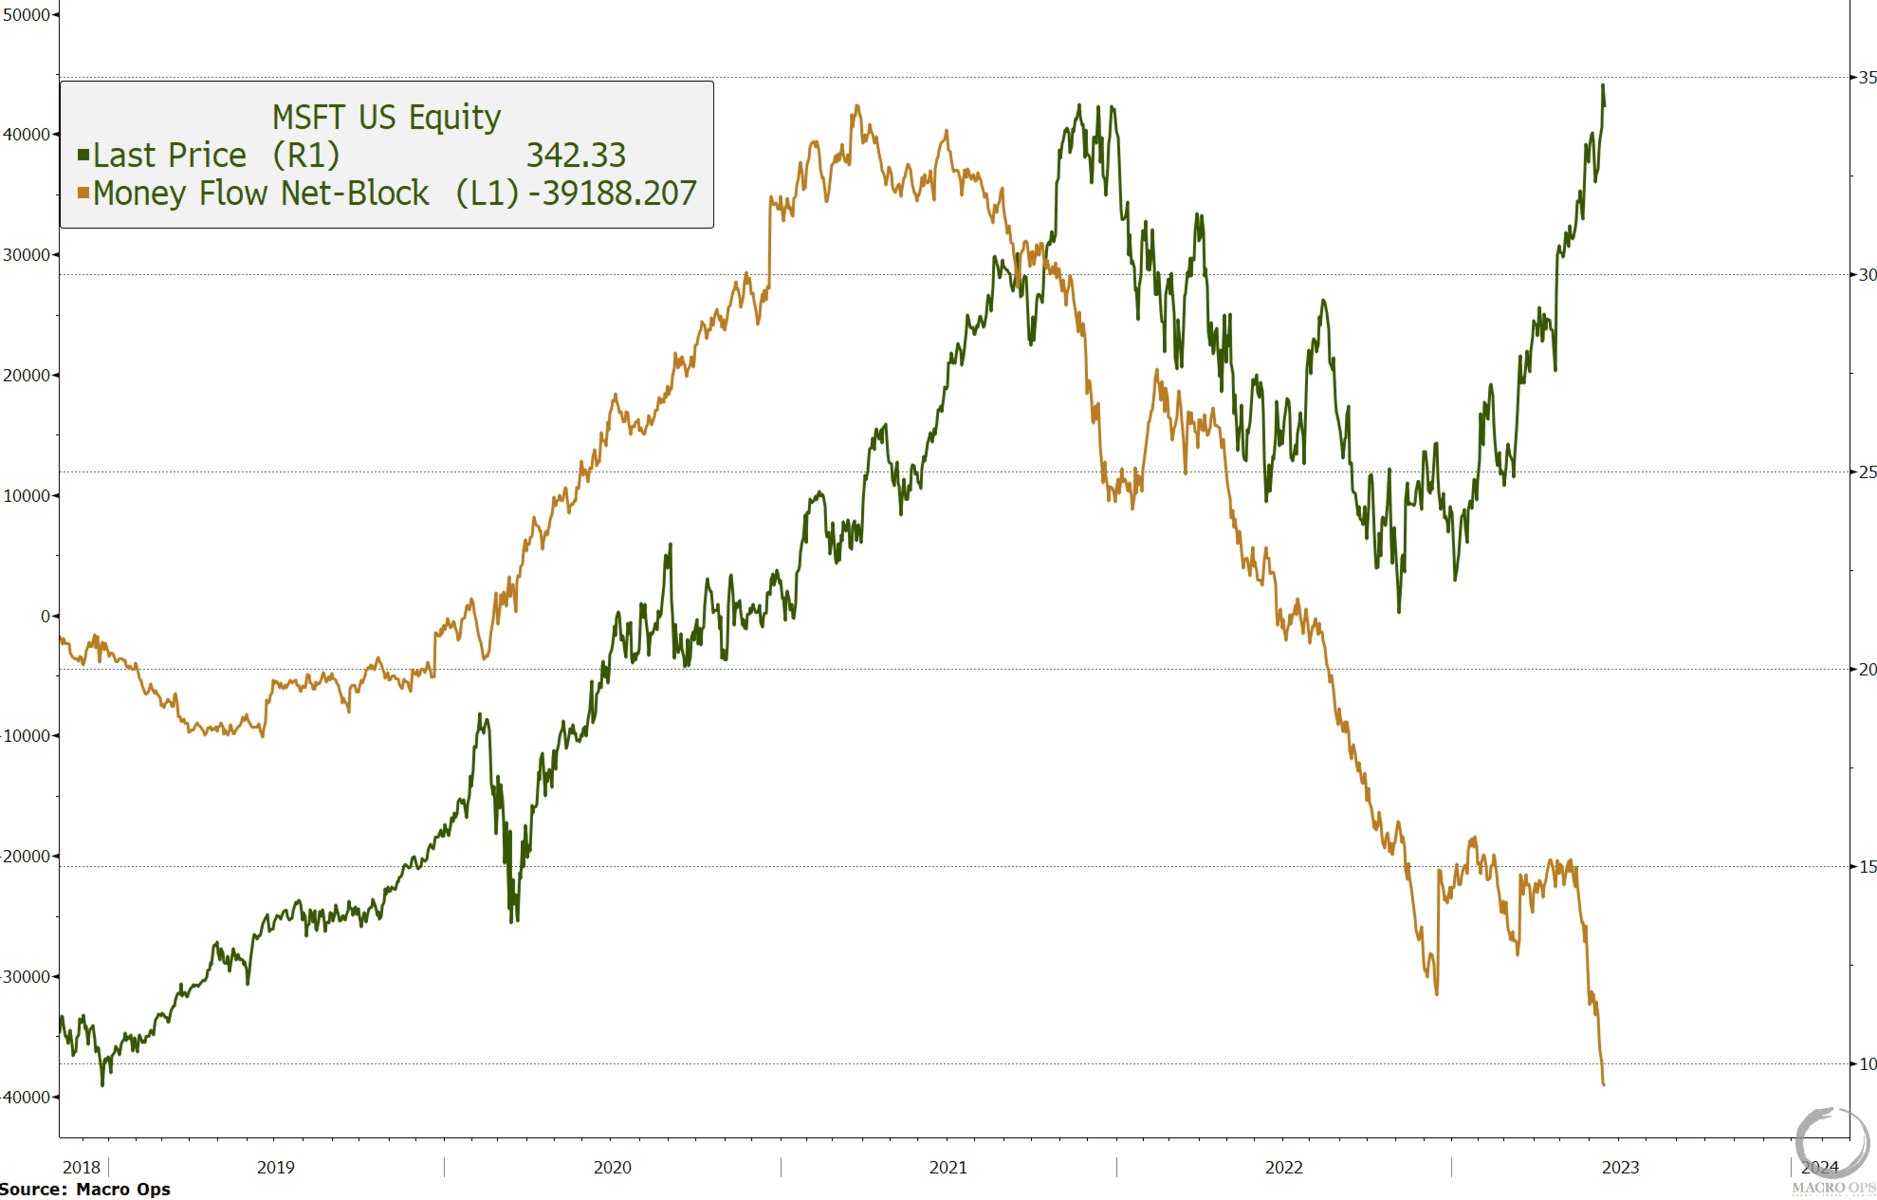
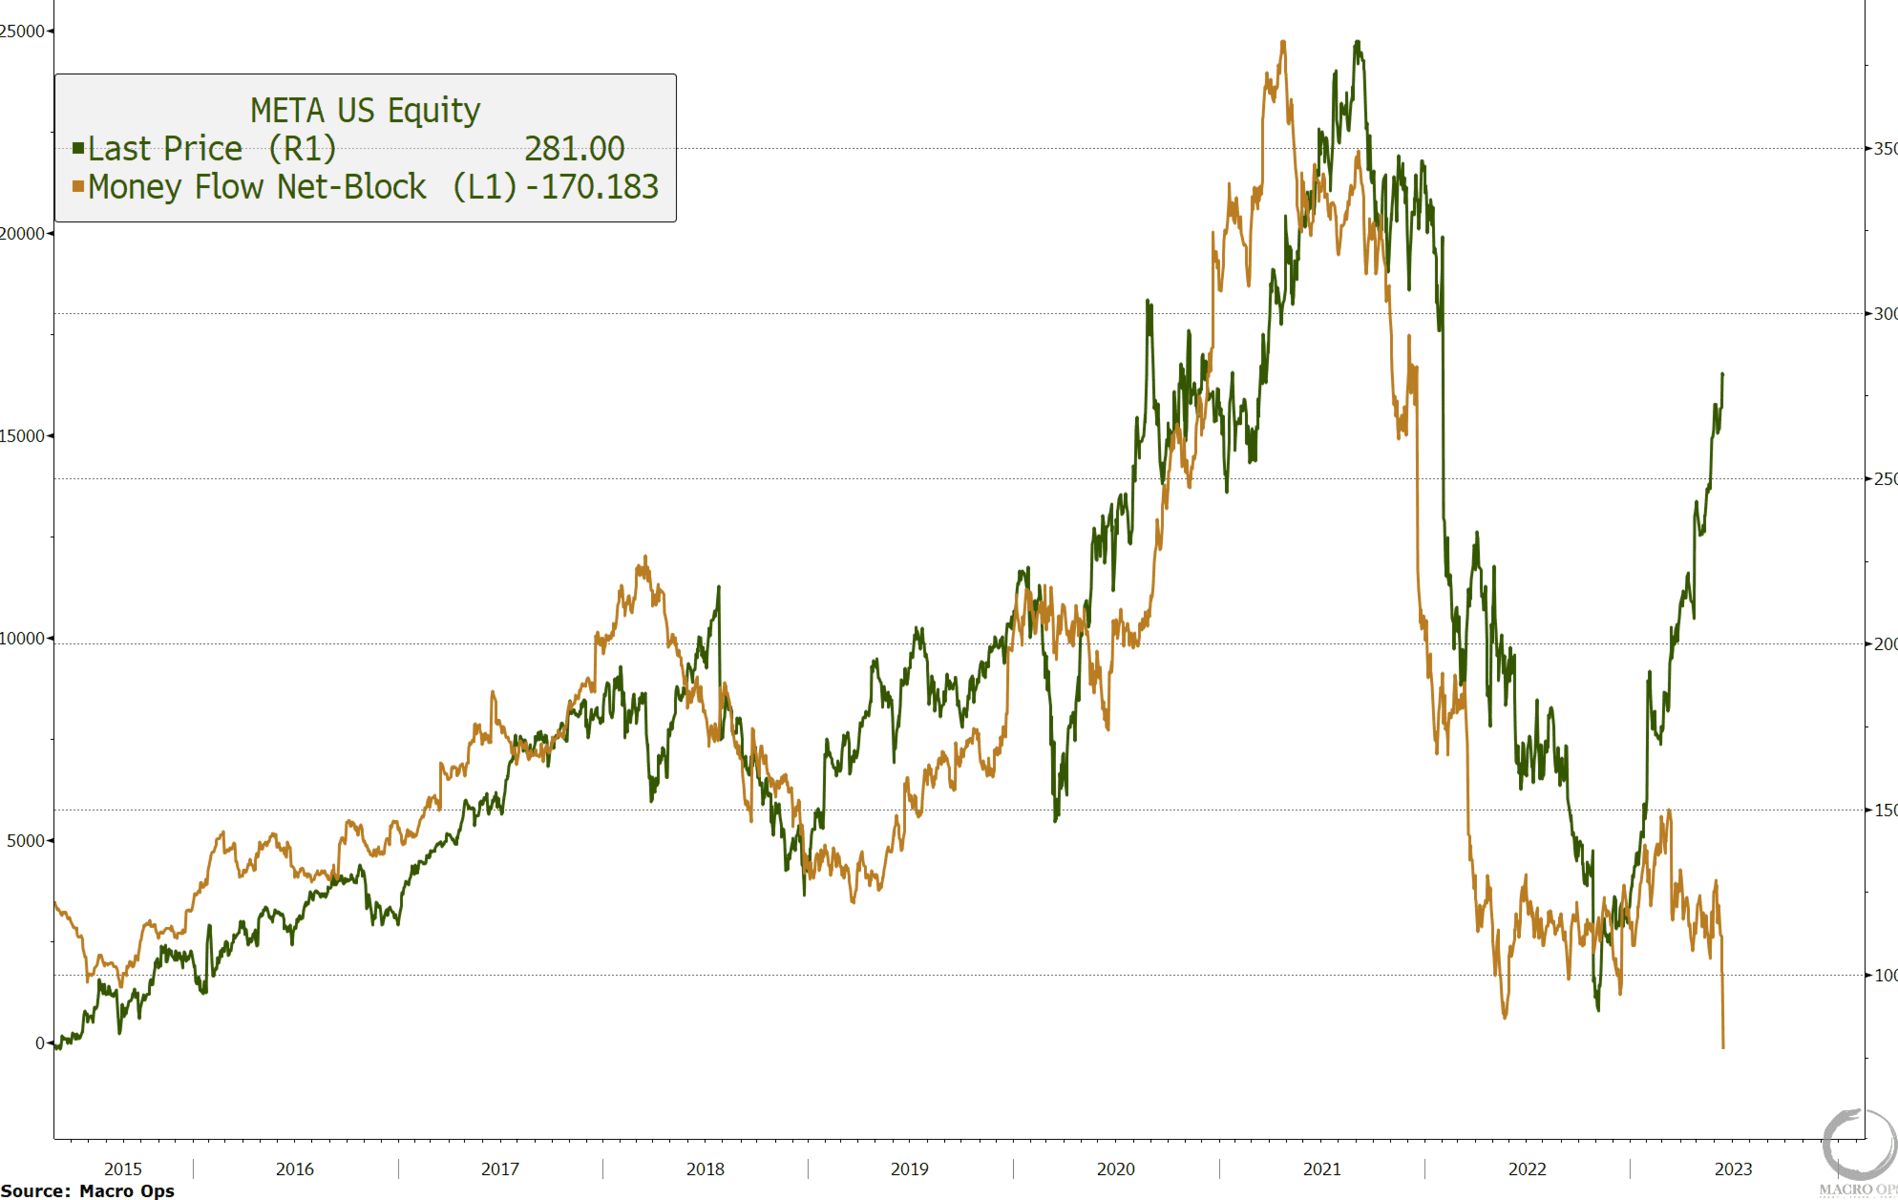
- Net block order flow is an indicator that tracks the net trend of large block orders amongst mega-cap stocks. It’s something I occasionally check in on, though it’s not something I’d make a trade decision on alone. But I do think it can be valuable context to see what the whales are doing as divergences with price, both positive and negative, often provide good leads.
Well, the past few months show one of the largest — and growing — negative divergences I’ve seen amongst the leading mega-cap stocks. Below is GOOG (green line is the stock price and tan is the net block order flow).
- Here’s NVDA and AAPL…

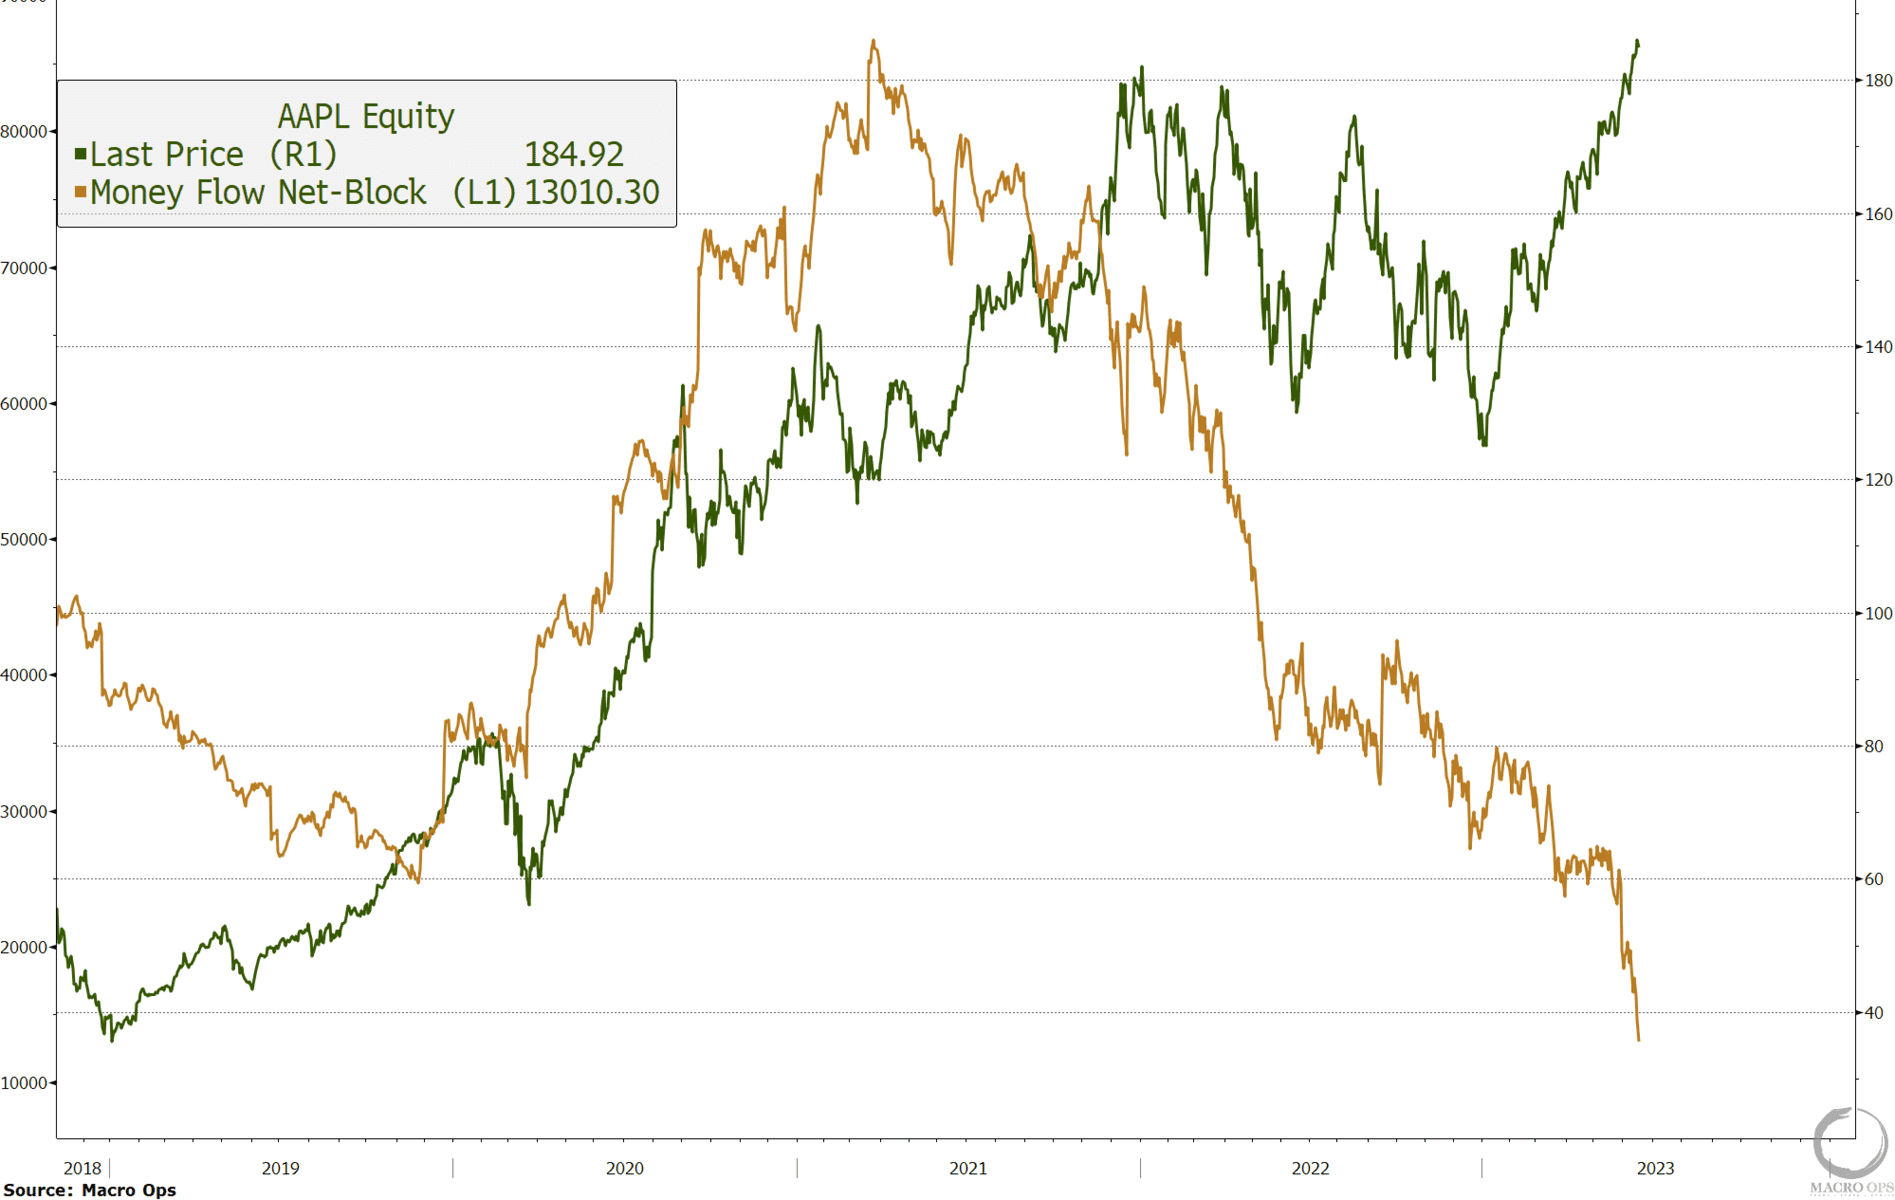
- And MSFT and META…
Make of this what you will, but it’s interesting nonetheless.
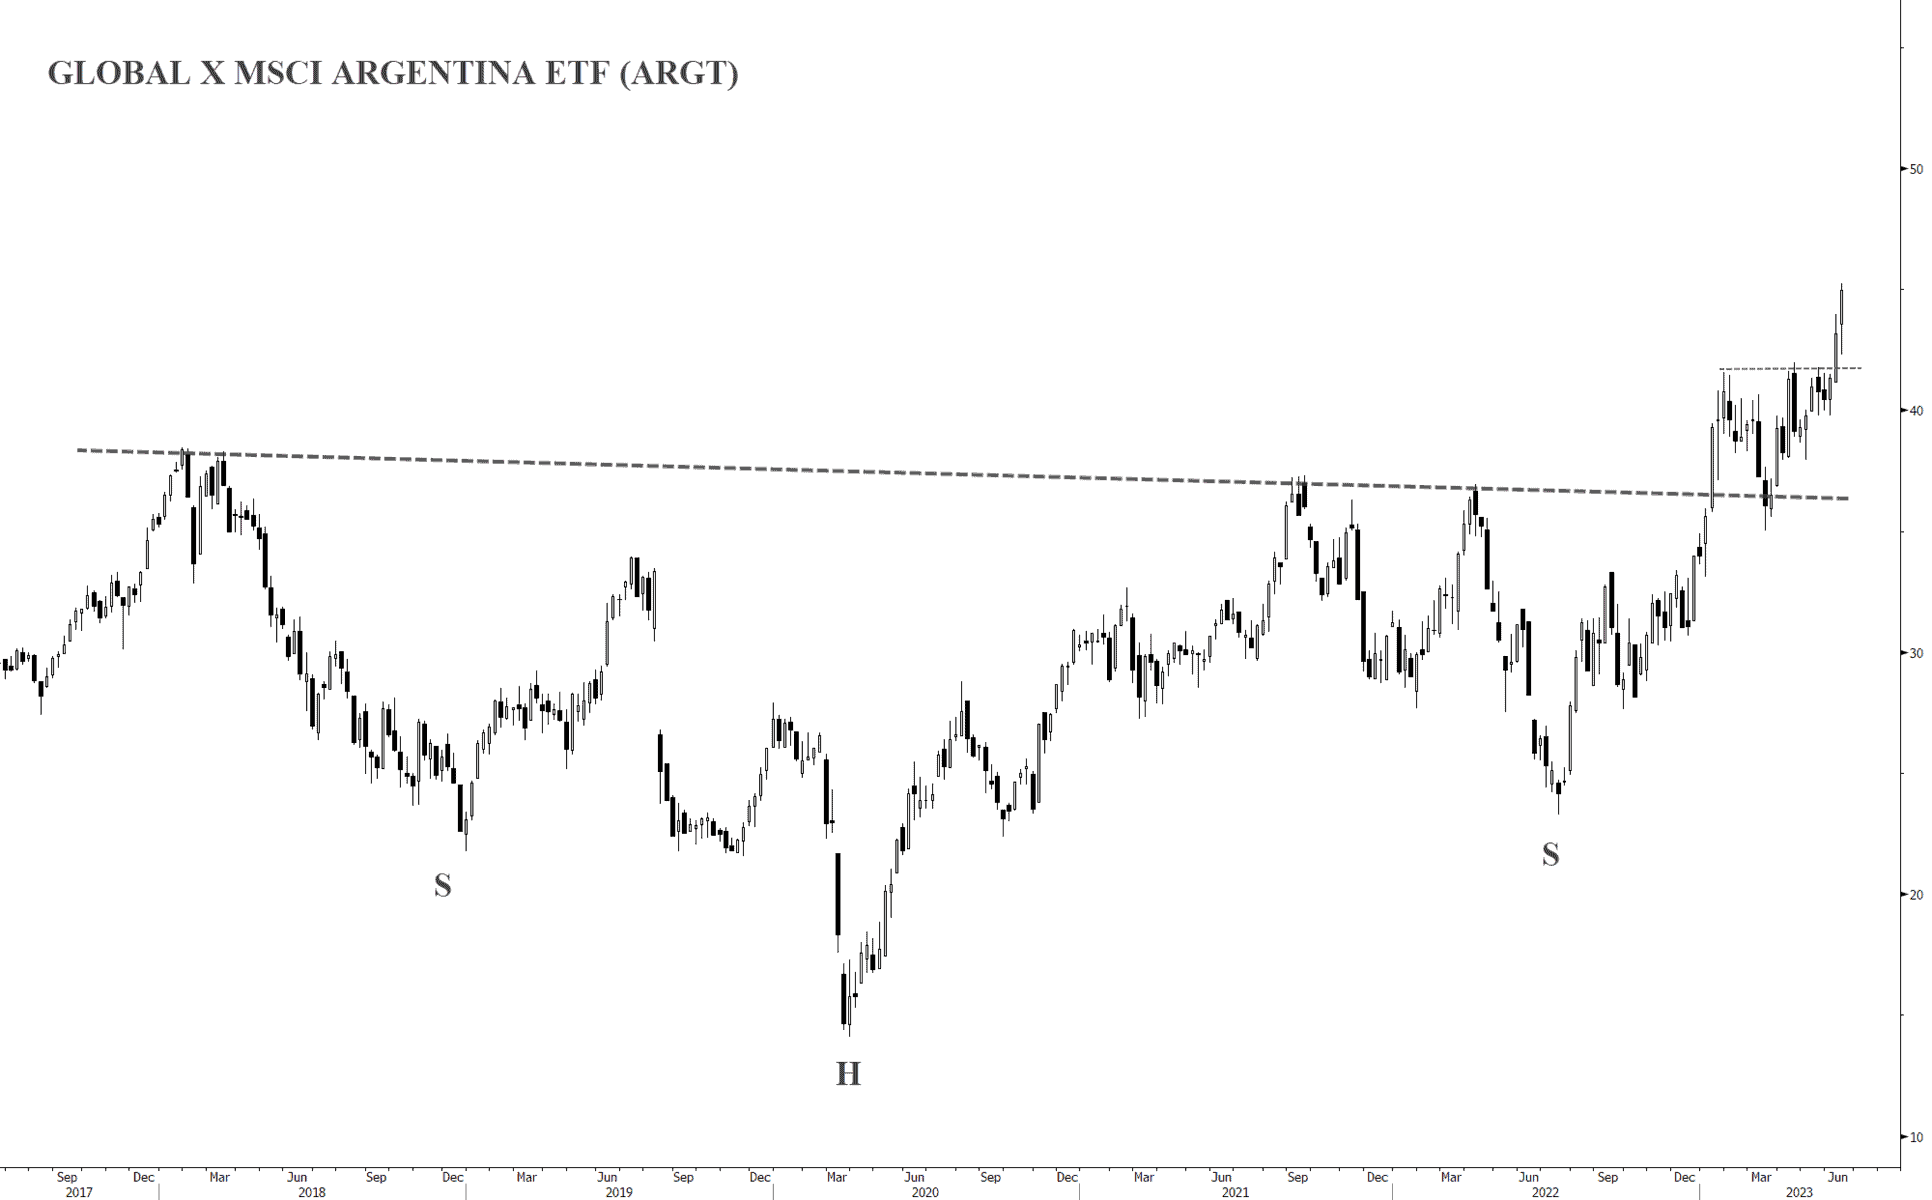
- Argentina (ARGT) completed a 5-year inverted H&S continuation pattern earlier this year. And it recently broke out from another multi-month consolidation zone. This is an incredibly bullish tape and one you want to be long. Our largest position (and winner over the past year) is in the Mexican / Argentinian oil and gas play, VIST, which is up 220%+ over the past 12 months.
Thanks for reading.