Broad Market Thoughts
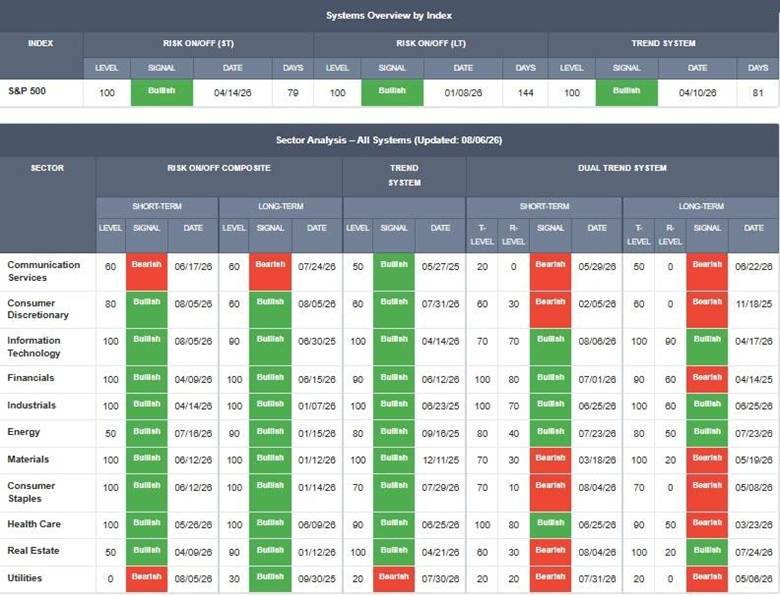
The S&P 500 ripped to a new all-time high on Tuesday, its first record following a multi-month consolidation. The breakout was accompanied by an improvement in our indicators, with the short-term Risk-On/Off Composite jumping back to 100%—meaning every trend and breadth measure is now bullish.
Sector-level conditions also improved, with consumer discretionary and technology both shifting back to bullish short-term Risk-On/Off profiles. Importantly, the vast majority of groups are now showing bullish trend and breadth conditions, a characteristic we typically see during healthy uptrends.
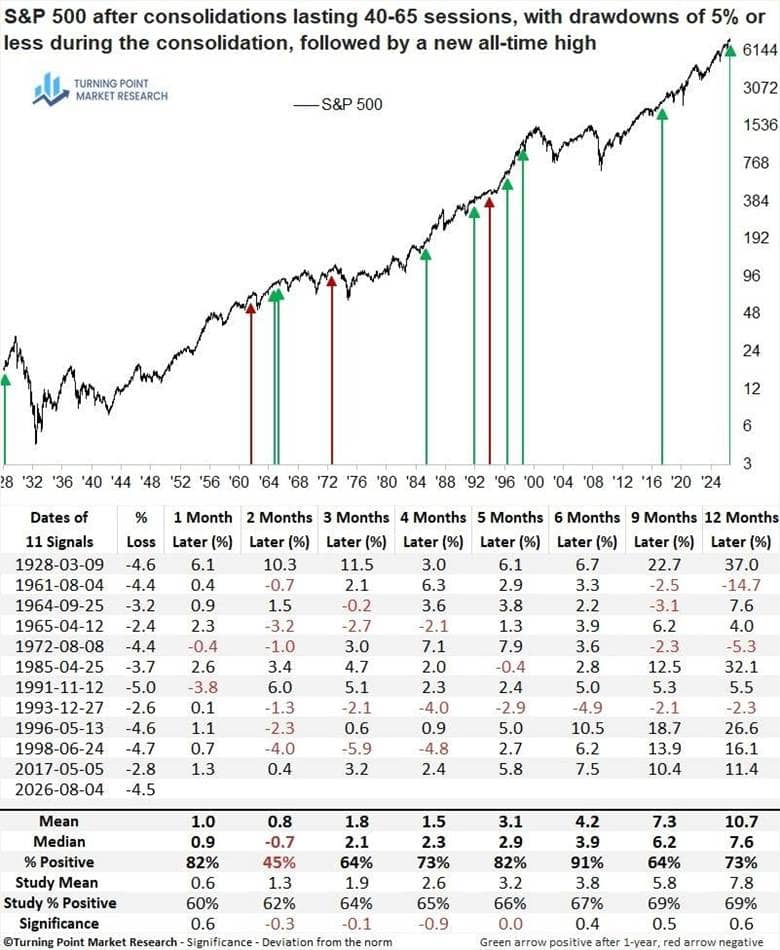
This most recent record high followed a 42-day consolidation. Screening the S&P 500 for consolidations lasting between 40 and 65 sessions identified 23 other instances. Narrowing the sample to periods in which the index declined no more than 5% during the consolidation left 11 precedents similar to the current setup.
Although the two-month results were somewhat weak, the six-month outcomes were notably stronger, with the S&P 500 higher in 10 of the 11 cases.
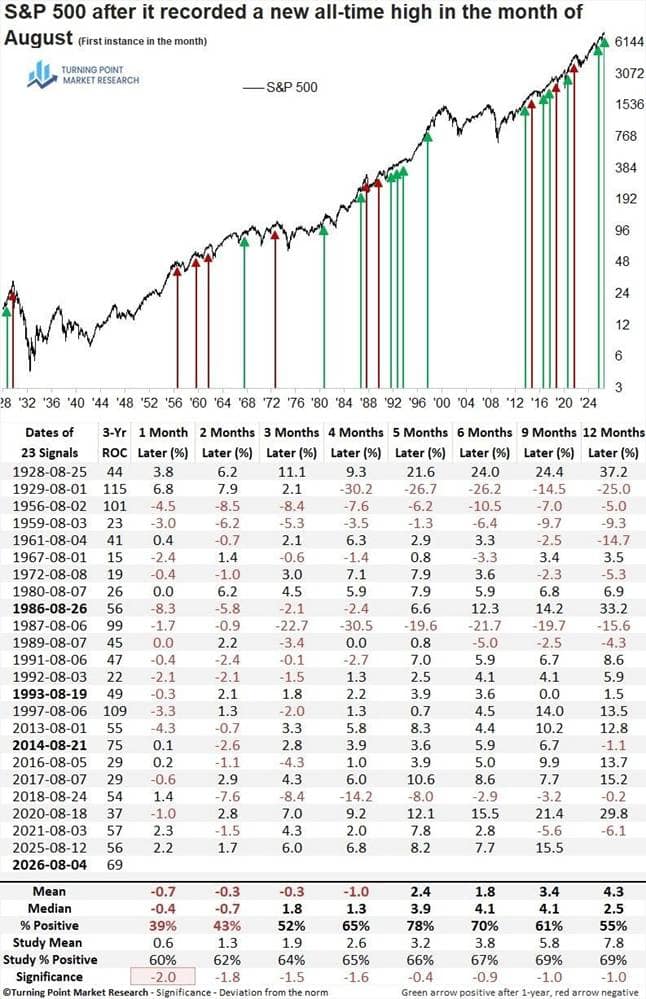
Given that the S&P 500 recorded a new all-time high in August, I wanted to examine its potential path forward after similar events, particularly with September historically the weakest month of the year and October often bringing periods of heightened volatility.
The table below includes every year in which the S&P 500 recorded a new high in August, measuring subsequent performance from the date of that first new high. Not surprisingly, the initial few months tended to be challenging.
Bottom line: despite a healthy underlying market backdrop, investors should not rule out increased volatility over the next few months before more favorable seasonality takes hold.
Bold dates indicate instances when July was a negative month.
Research this week
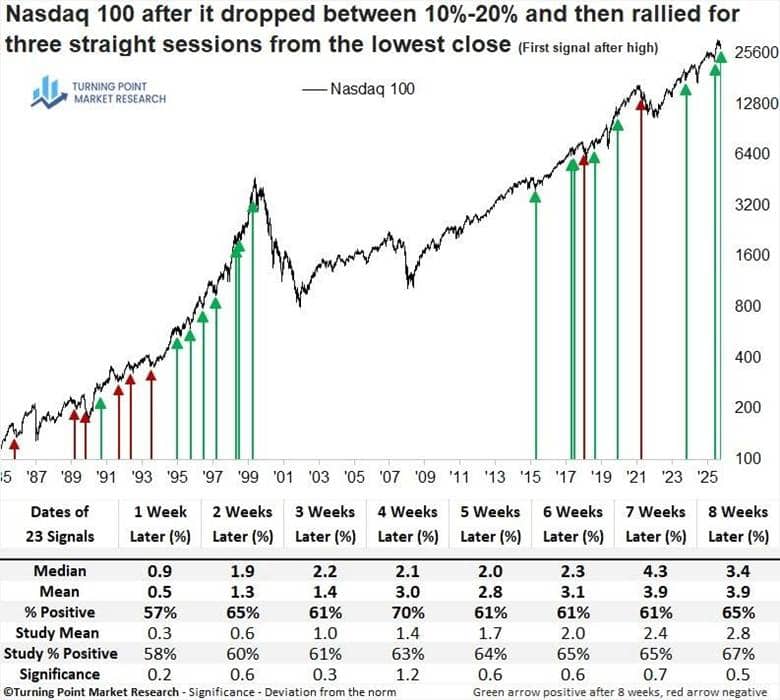
Tuesday’s report examined the Nasdaq 100’s three-day rally from a correction low.
Although the full historical results were weighed down by outcomes from 1986 through 1994, the signal has been considerably stronger since 1995, with only two occurrences posting losses eight weeks later.
Given that many investors, including us, have scaled back technology exposure over the past several months, the rebound may continue as traders chase the group to maintain exposure to the market’s most influential sector.
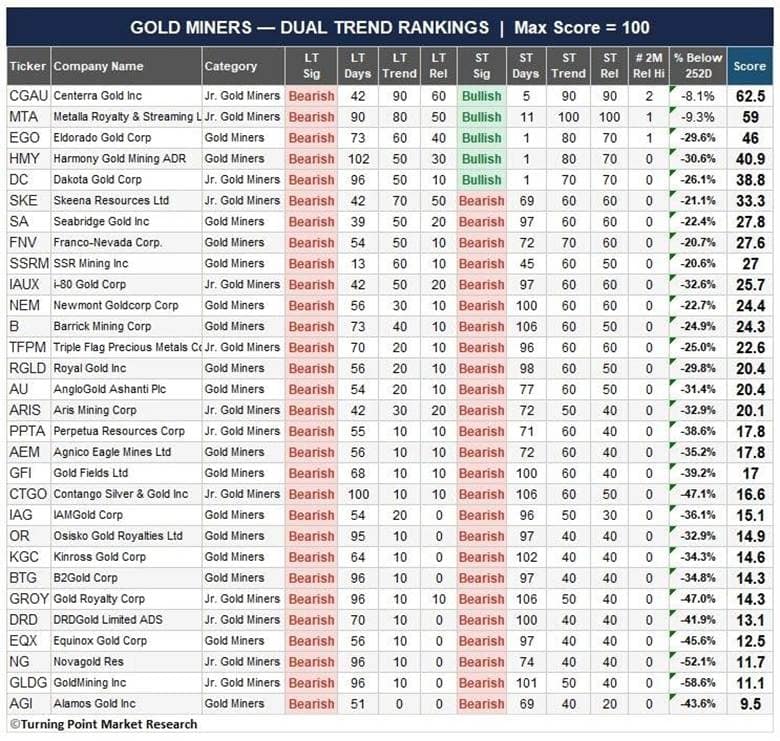
Thursday’s report examined trends across precious and industrial metals, both of which have rebounded recently as the dollar has weakened. While the overall backdrop remains weak, it is beginning to improve, and we highlighted a handful of names in both groups that are showing bullish setups.
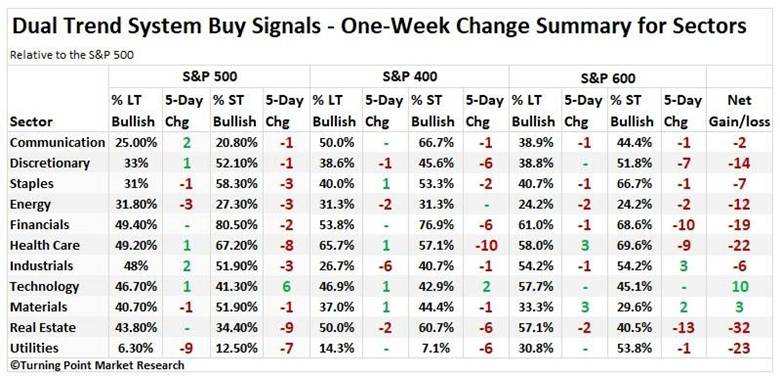
Dual trend analysis
Technology and materials were the only sectors to post a net increase in Dual Trend buy signals over the past week, with technology adding 10 signals and materials adding 3. The broader market backdrop was weaker, with notable deterioration across defensive sectors, including health care, real estate, and utilities.
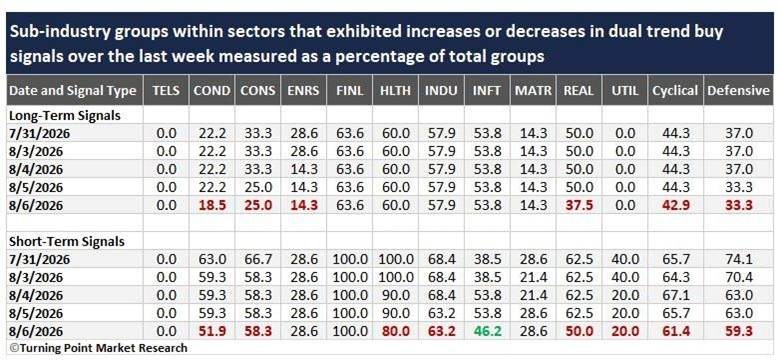
Across sub-industry groups, a similar pattern emerged, with defensive groups weakening. At the same time, technology was the only sector to record a week-over-week increase in Dual Trend buy signals, driven by improvement in the short-term model.
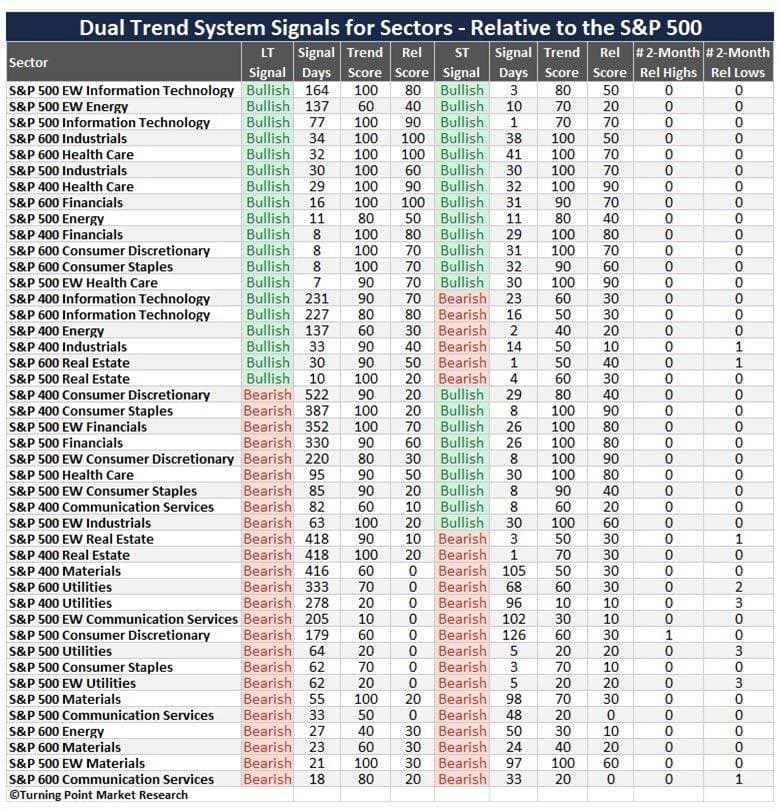
Both the S&P 500 cap-weighted and equal-weight technology sectors shifted back to a short-term Dual Trend buy signal this week, with the equal-weight index turning bullish Tuesday and the cap-weighted version following Thursday. This brings the short- and long-term models back into alignment for tech.
Importantly, the equal-weight signal suggests the improving backdrop in technology is not being driven solely by mega-cap stocks.
Portfolio update
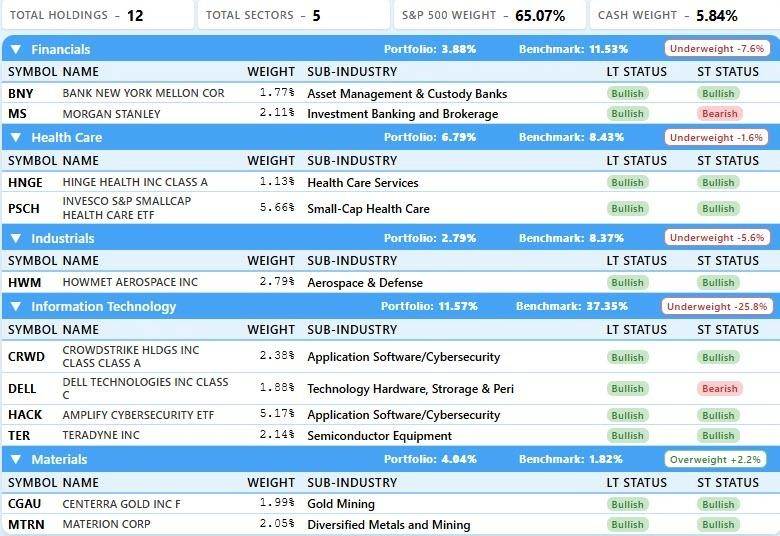
During the week, we continued to put cash to work, increasing our exposure across several areas. On Monday, we added to our position in the cybersecurity ETF (HACK). On Tuesday, we increased our allocation to Dell Technologies (DELL), initiated positions in Teradyne (TER), and reduced cash by adding to the S&P 500 ETF (SPYM). On Friday, we initiated new positions in Centerra Gold (CGAU), Materion Corp. (MTRN), and Hinge Health (HNGE), funded by trimming our SPYM position.
Cash now stands at 5.84%, reflecting a more bullish portfolio posture.
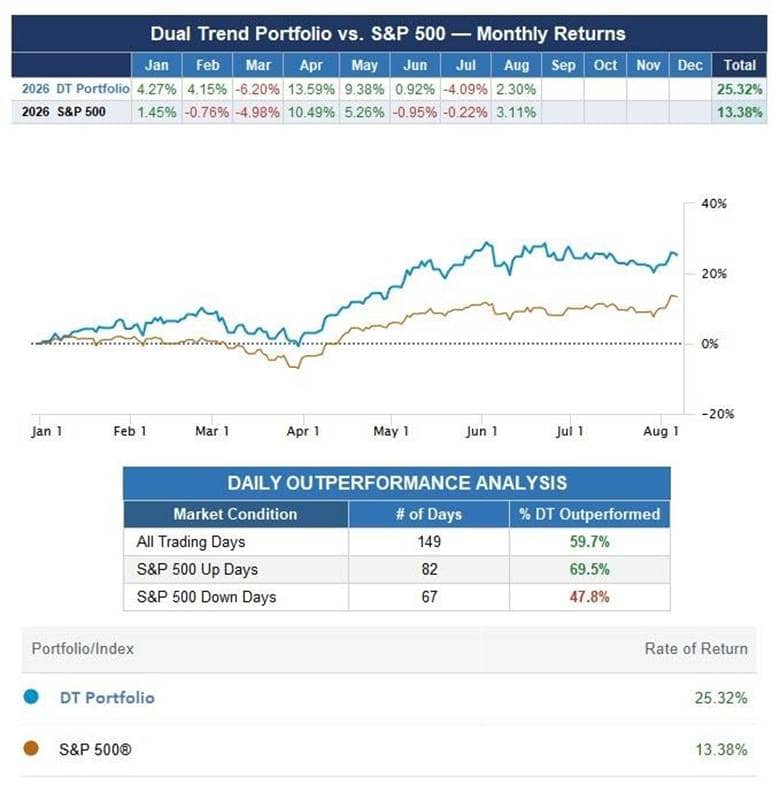
Through Thursday’s close, our Dual Trend portfolio had gained 25.32%, outperforming the S&P 500’s 13.38% return.
While July was a challenging month, the impact would have been significantly worse had we not proactively reduced and eliminated several of our AI-related holdings.
Final thoughts
The market backdrop remains constructive, with our models showing improving trend and breadth characteristics. Technology has emerged from a corrective phase, with improving conditions across individual stocks, sectors, and sub-industry groups, suggesting investors may increasingly return to the group given its importance to major indexes. Beyond technology, precious and industrial metals are also showing improving technical conditions, prompting us to initiate several positions this week with the potential to add further exposure if trends continue to strengthen. While the historically weaker September-October period could produce bouts of volatility, particularly if inflation data or Federal Reserve communication becomes less favorable, the weight of the evidence suggests the market’s underlying structure remains supportive.