Steve here.
You wouldn’t wear a coat in the dead of summer, would you? The same goes for trading. Why would you go long in a market dominated by a bearish trend?
Our Heads Up Display (or HUD) has several tools that allow operators to examine the market from a regime-based perspective.
Our tools use Van Tharp’s time-tested tool, the System Quality Number (or SQN), as a backdrop to help spot regimes and regime changes. It also allows us to wait out the chop and volatility, rather than spending the mental and physical capital worrying we’re in the “right” or “wrong” trade.
This quick email will explain how we used our HUD tools to develop a thesis around our long Natural Gas trade.
This has been one of the year’s best trades, netting us ~6R in profit.
MO Backtester (MOB)
The MO Backtester (MOB) is a momentum-based tool. Updated daily, it uses observed price action from the last 20-25 years to highlight the magnitude and direction of a setup, configurable from the following parameters:
- Number of Consecutive Bars (1-10)
- Bull or Bear (consecutive) bars
- Bar Time Period (daily, weekly, monthly)
- SQN Regime (optional configuration)
While not available for individual equities, all major commodities and major indexes are available for analysis.
This tool is handy when an operator wishes to check the expected return for an underlying.
Let’s use one of our best trades this quarter, long Natural Gas.
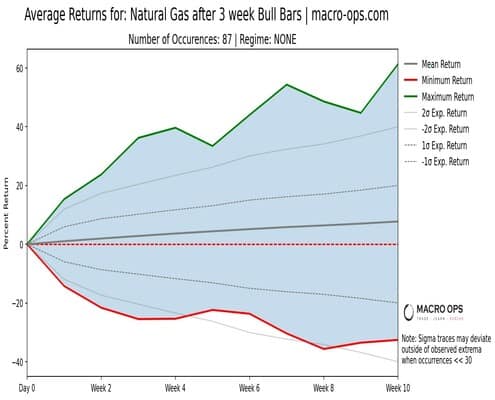
We’ll poll for all historical returns after 3 weekly bull bars and daily bear bars within all SQN regimes. After the ‘Conduct Backtest’ button is clicked, a figure will be displayed below the selector menu within a few seconds.
The shaded area represents the historical maximum and minimum returns observed from this selected configuration.
The gray traces display more statistical information such as the expected returns at +/- 1 & 2 sigma and the mean return (bolded gray line).
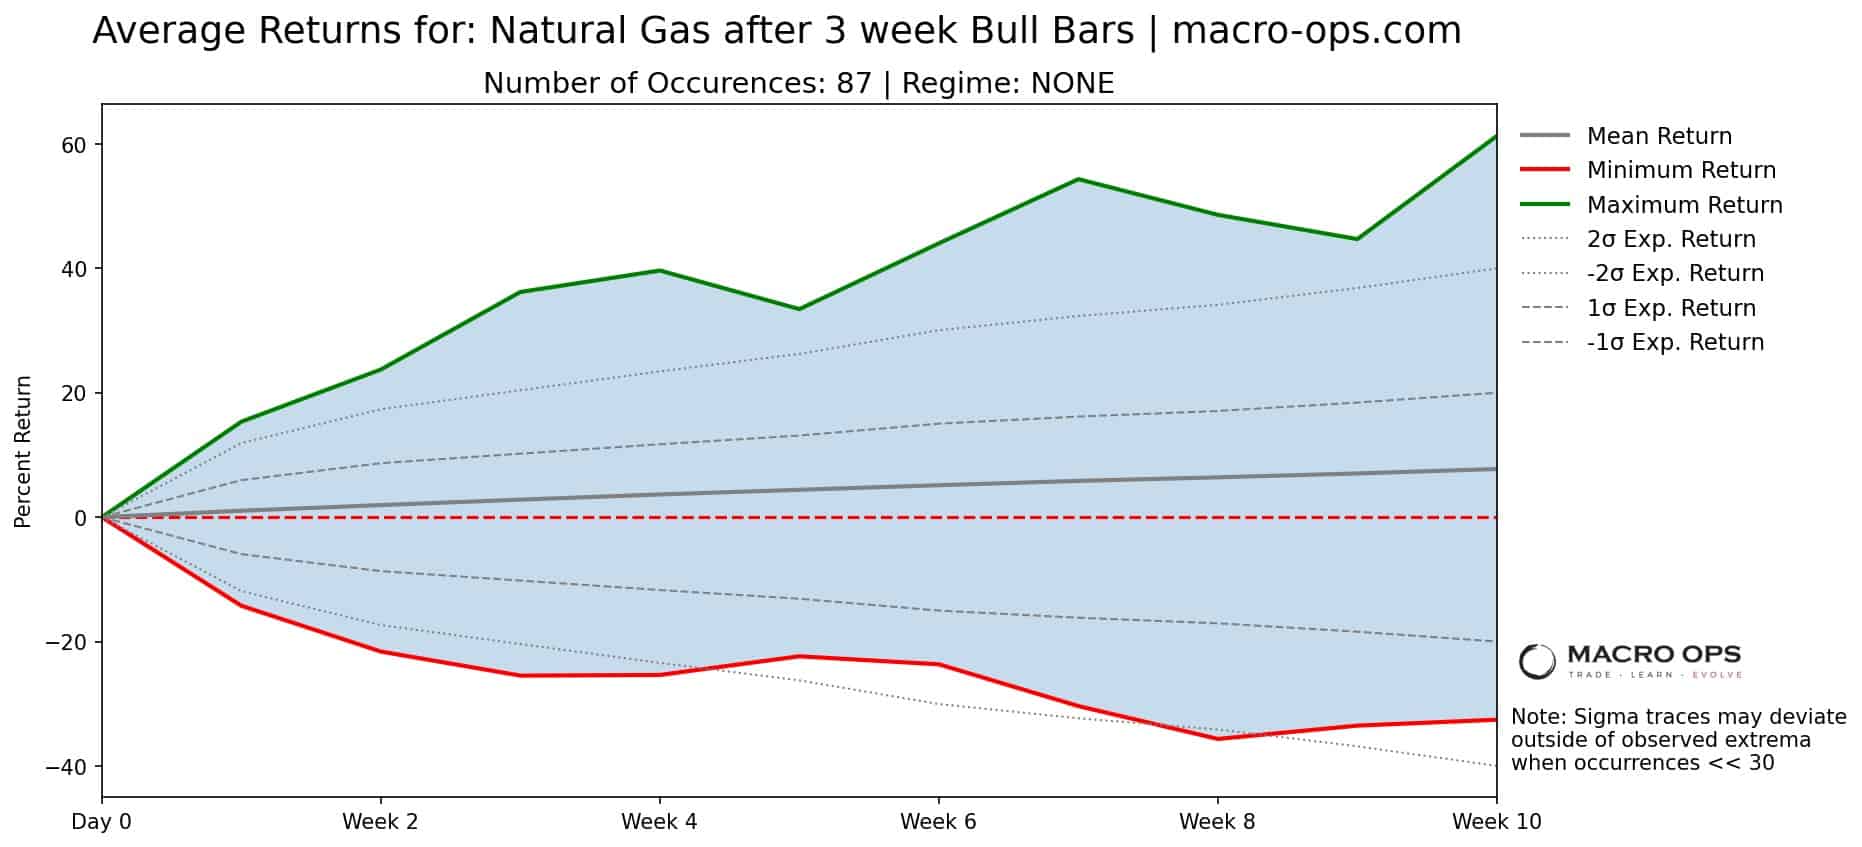
We see on this figure that a slight rebound is expected as trend exhaustion is observed, as Nat Gas has been observed to climb 4% in 10 weeks after three weekly bull bars.
Note: Mean returns can be volatile if the number of previous matches is deficient. If you get a return frequency of less than 30, it is advisable to incorporate other elements of conviction and MOB output.
MO Summary Predictor (MOS)
We use the Summary Predictor as a supplemental tool in concert with the MO Backtester. It automatically selects the current SQN regime and bar-by-bar pattern.
In other words, it’s designed to show the directionality of price action over the next ten weeks and highlight expected over/underperformers.
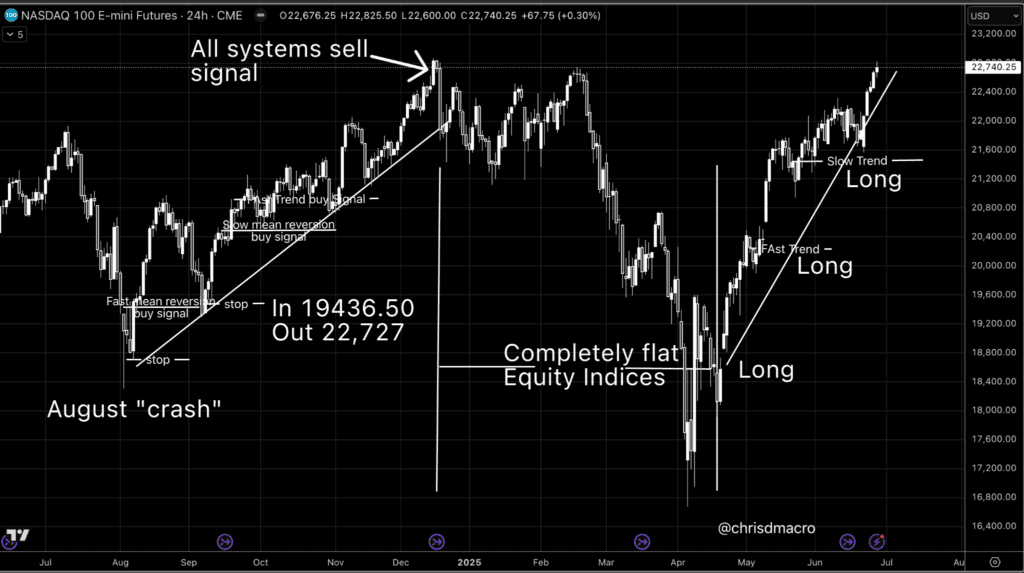
Let’s go back to our Natural Gas trade as an example.
During mid-to-late March, the MOS revealed continued underperformance in large tech and considerable overperformance in natural gas relative to other assets.
We initiated the position on a breakout to new highs on the 23rd, and now that a month has elapsed, we can see that the predictions were accurate from a directionality perspective ( weekly bars are shown).
At current, the trade is up ~6R in just over a month.
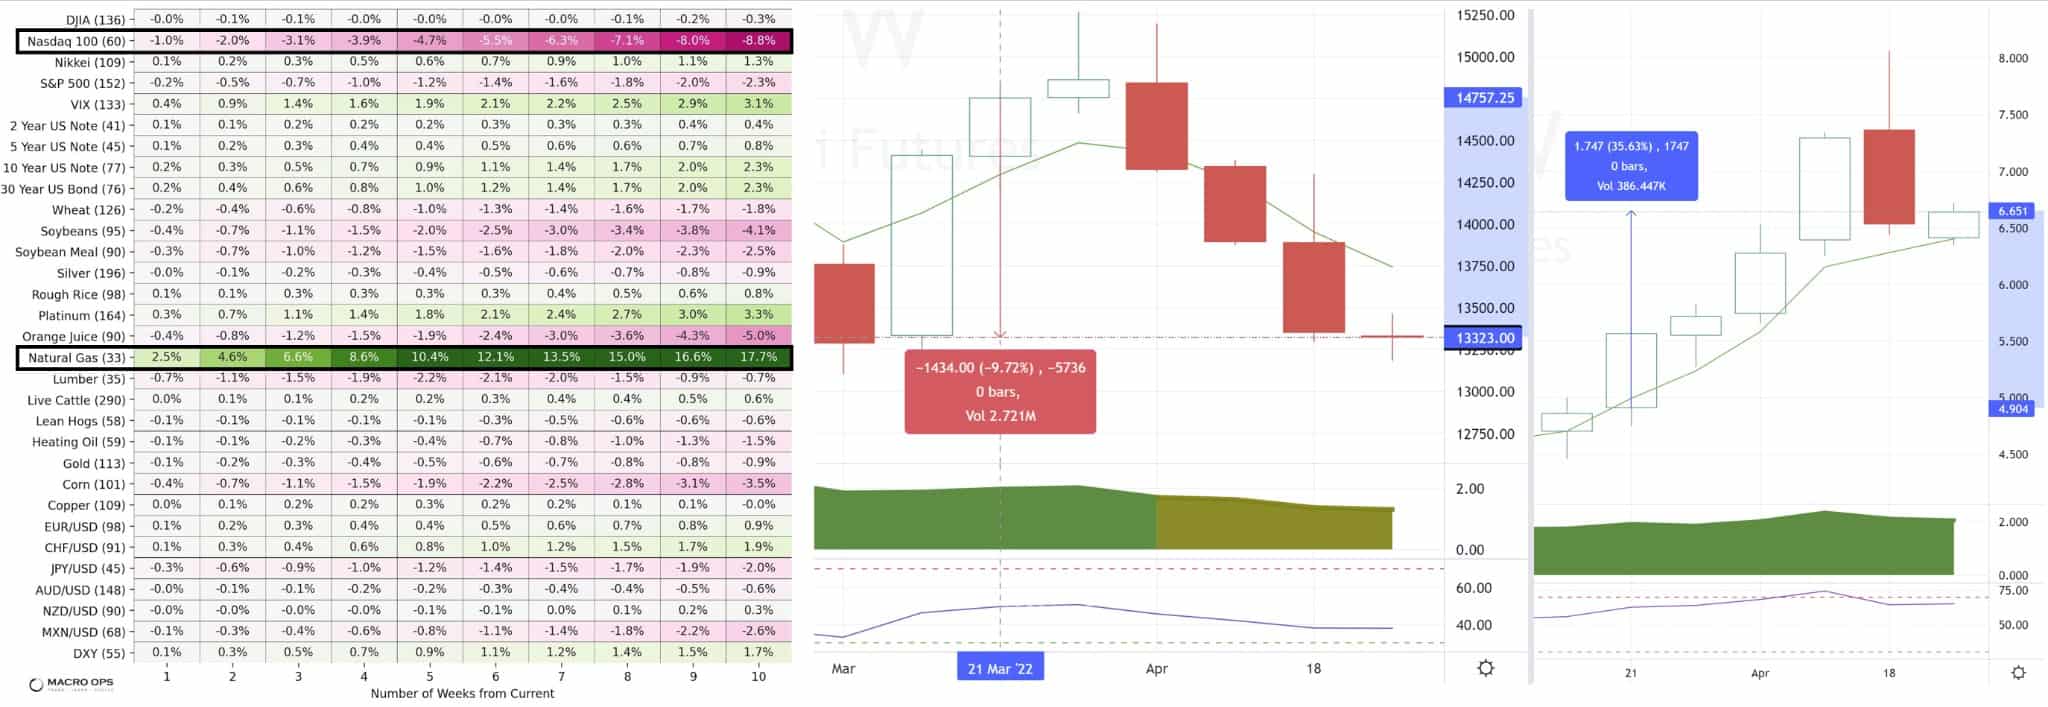
Note: During internal testing, daily signals returned were found to under-represent actual returns due to the mean-reversion tendencies. This tool updates weekly.
SQN Statistics Library
Our statistics library is like the MOB, but provides a more granular look at per-regime returns. This tool shows the average daily return that has been observed at each time period throughout an SQN regime as long as the underlying stays in that regime.
Information regarding the current regime, such as recent return, date of regime switch, and time spent in the regime in the first few columns at page top and is filterable/sortable.
To vslightetailed statistics in image format for each ticker, click the underlined ticker name. Again we’ll use our nat gas trade as an example through the UNG ETF.
The first figure and attendant table denotes the average return observed at each time period per regime. The second figure denotes the number of times a ticker has stayed in the same regime as a function of time. This lets an operator know how many times the underlying has achieved a return in a given time period.
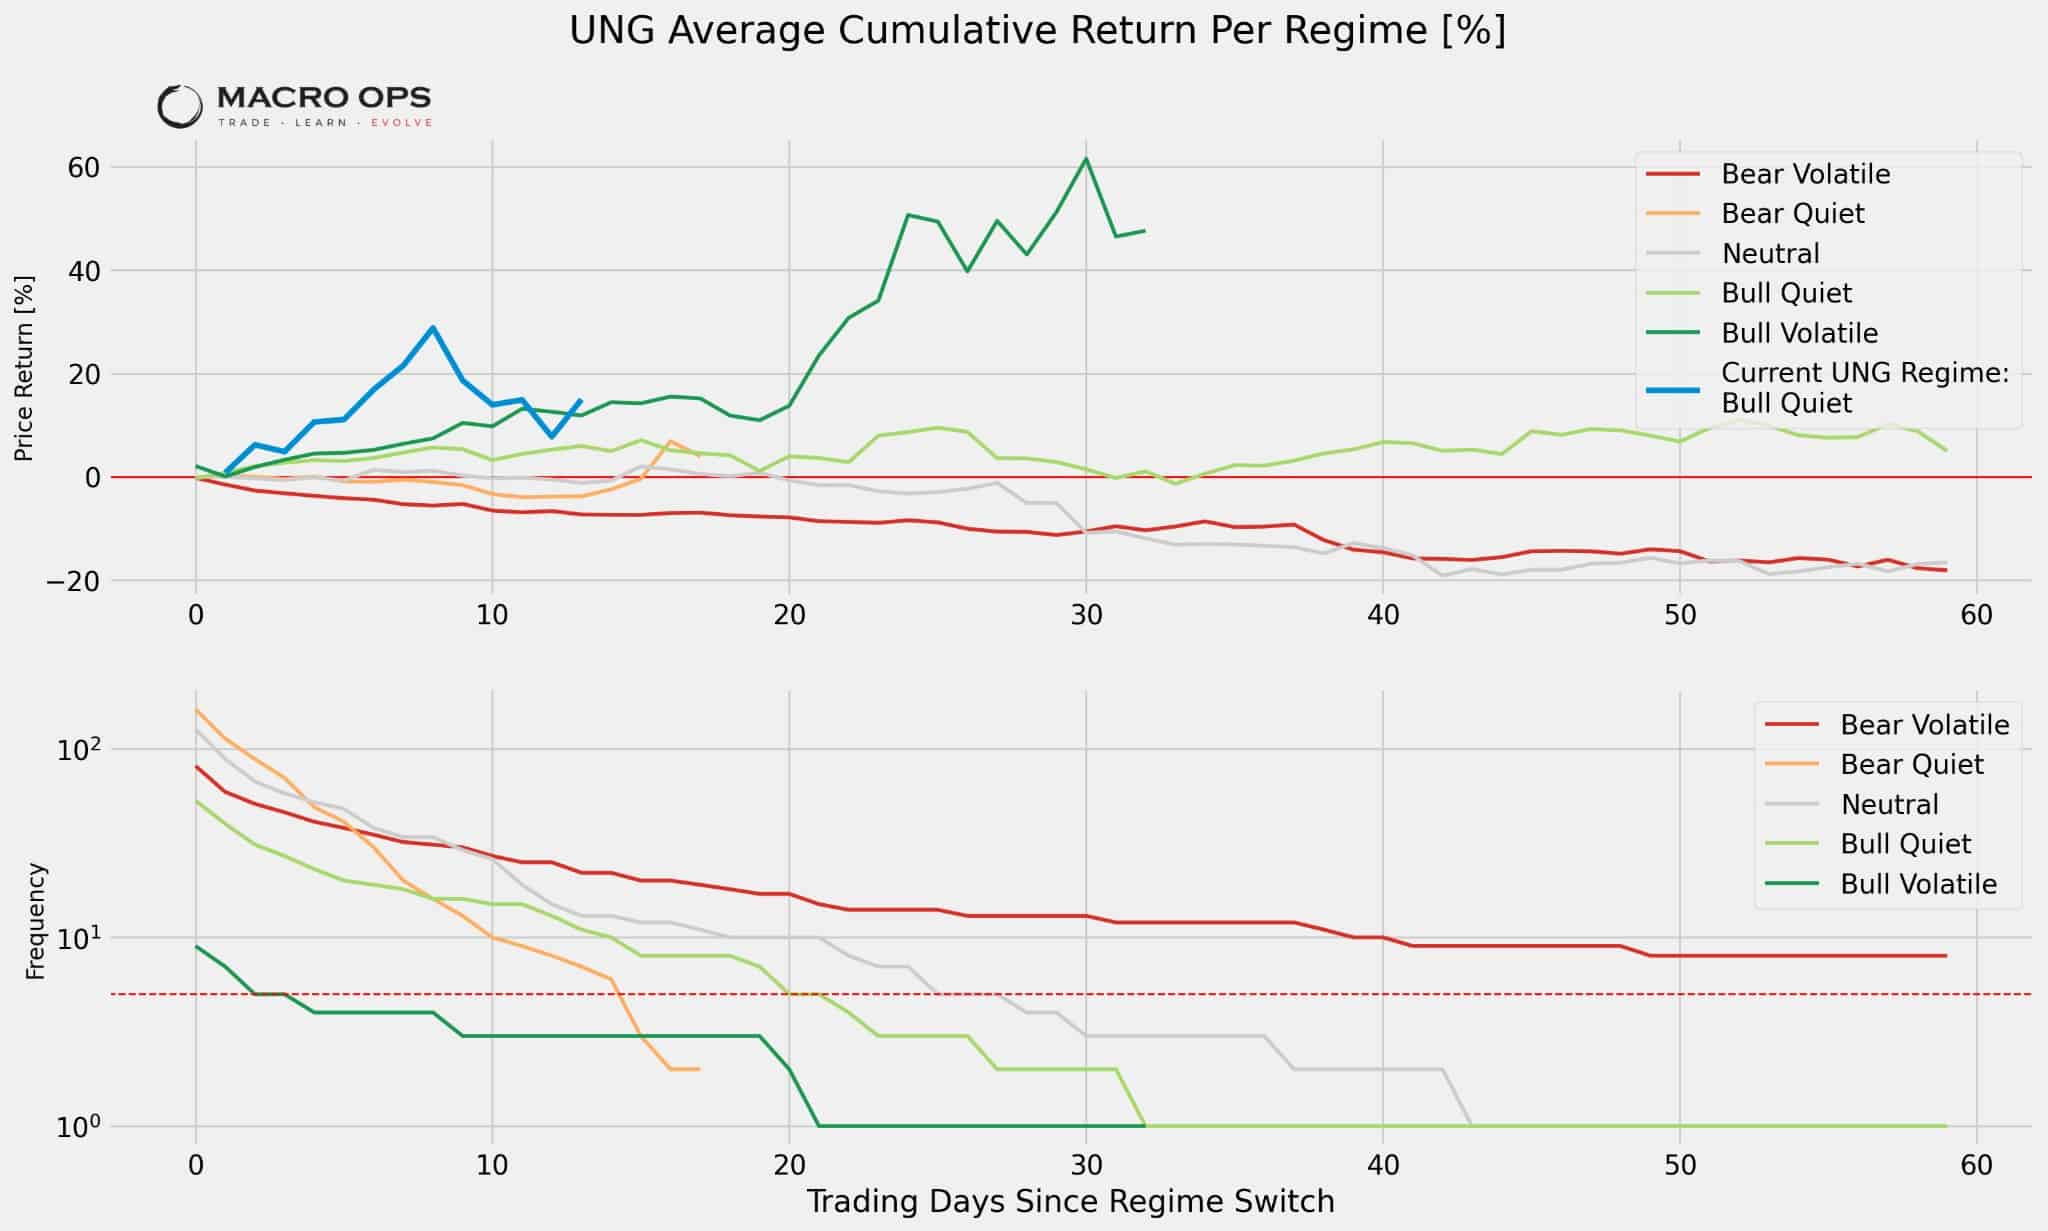
Tip: If current price action becomes especially divergent from how it’s behaved several times in the past, it may be time to reevaluate a thesis!
Example: If the underlying is in a bull-quiet regime and has been observed to return 10% in 20 days several times in the past, confidence is statistically high for it to return ~10% the next time it is in a bull-quiet regime. When frequency falls below the dashed line (5 occurrences), future returns may deviate sharply from historical data.
Concluding Thoughts
These are just some of the tools we’re building inside our Collective. We hope to share more of our process over the next few weeks. We’re also excited to share the trades that didn’t work (as they often prove more insightful).
Also, let us know if you’d like us to dive deeper into one specific aspect of our HUD Dashboard. Maybe you want to learn more about the MO Backtester or the SQN Statistics Library!
We’d love to tailor content to what you want to learn about most!