They think that intelligence is about noticing things that are relevant (detecting patterns); in a complex world, intelligence consists in ignoring things that are irrelevant (avoiding false patterns).. ~ Nassim Taleb via The Bed of Procrustes
Good morning!
In this week’s Dirty Dozen [CHART PACK] we look at the incredible strength of the US housing market and explore some reasons why we should expect this strength to persist… We then dive into the short-term outlook for the SPX, add some data to our longer-term bull thesis for risk-assets, including a record level of people expecting a crash + very positive late election year stimulus seasonality. And finally, we end with a look at one of the worst performing markets year-to-date, energy assets, plus more…
Let’s dive in.
***click charts to enlarge***
- Back in July we put out a report laying out the long-term bull case for US housing. Well, the latest prints are definitely supportive of this take. Home sales saw a record jump last month to new 14-year highs.
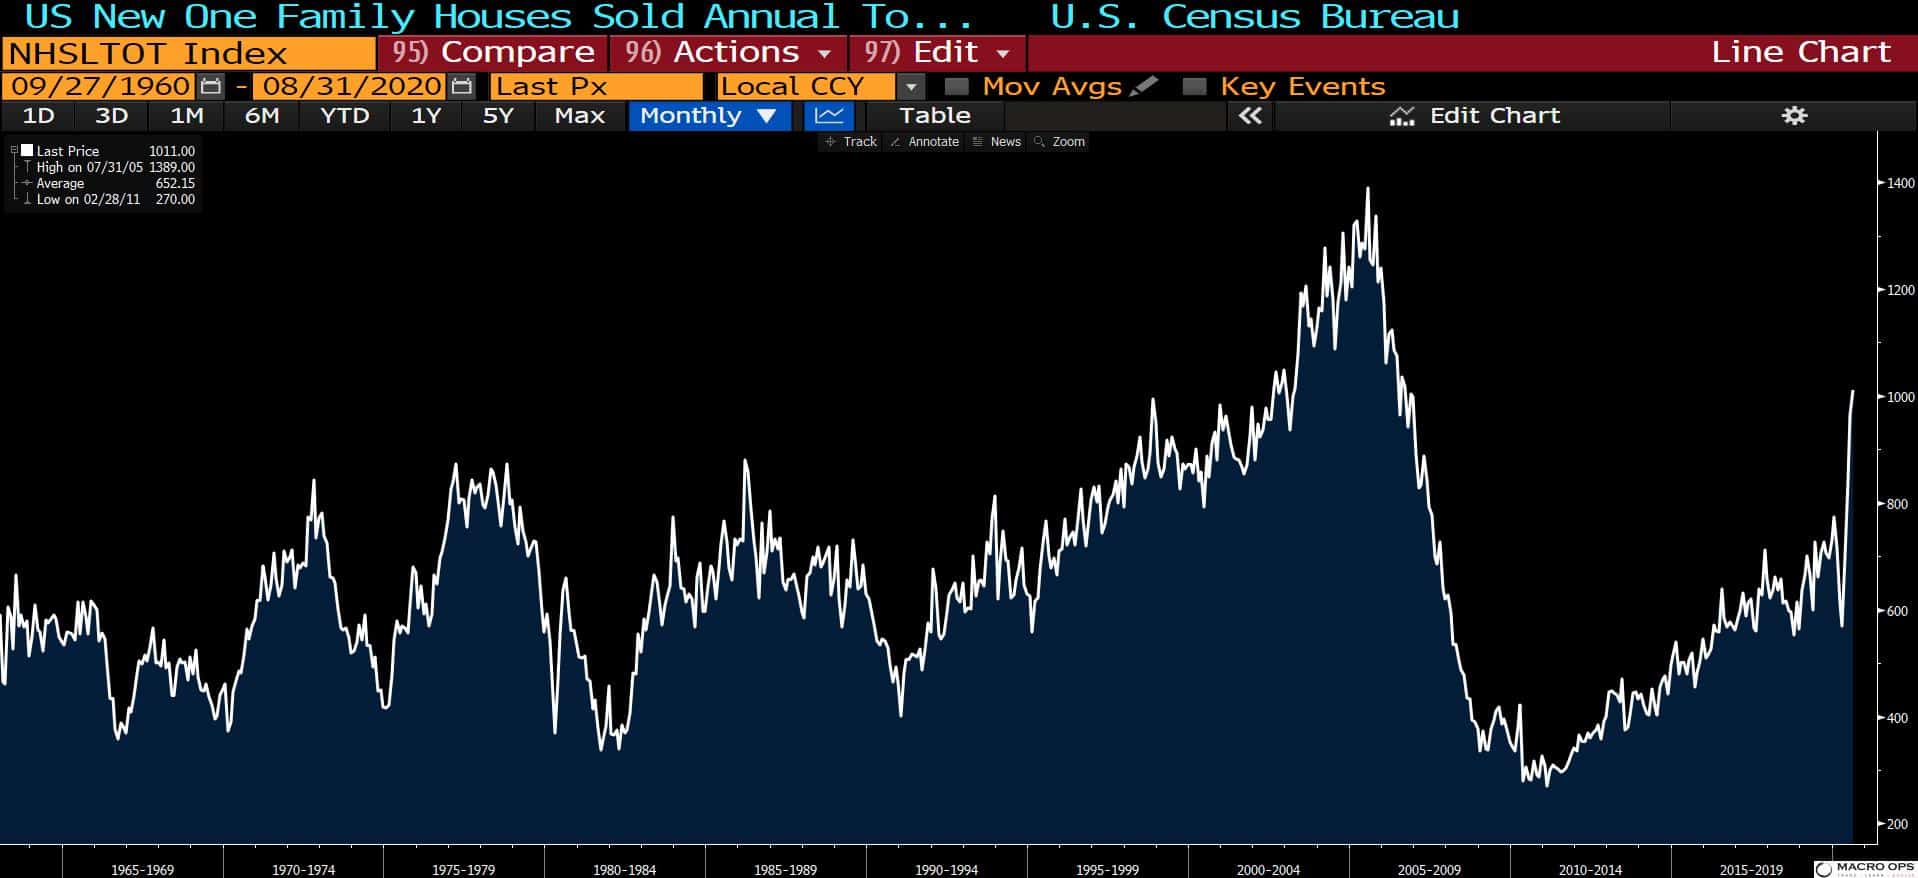
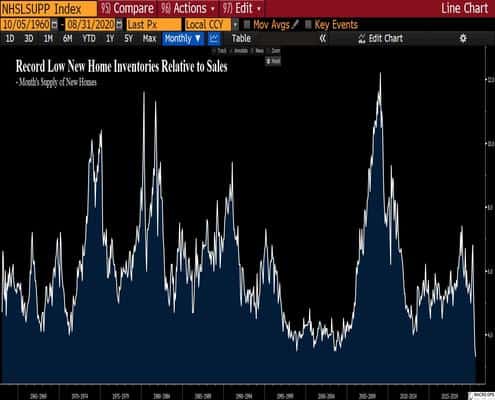
- This incredibly strong backdrop of demand is mirrored by a record low in relative new home inventories…

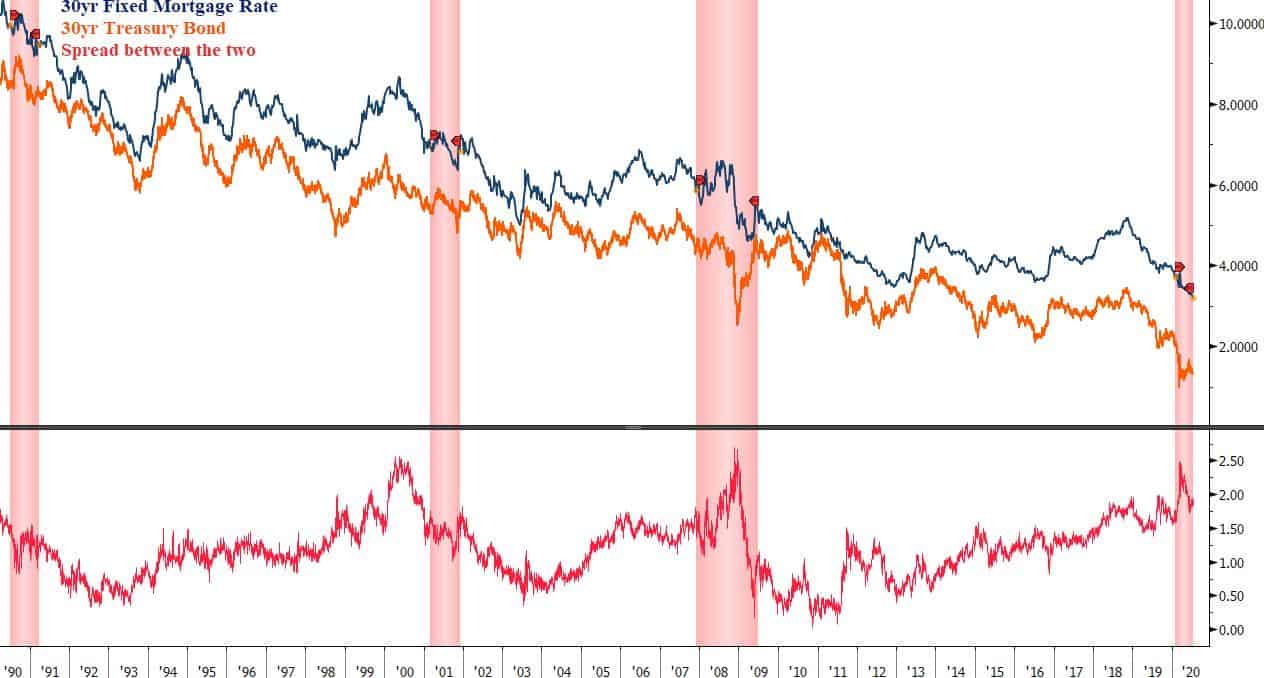
- Interest rates are the fulcrum of the global economy. They underpin the valuation of all global assets. The housing market being no different. Falling interest rates lead to falling mortgage rates which bring down the monthly payments on mortgages, thus making housing more affordable.
The chart below tracks the 30-year fixed mortgage rate (blue line) and the 30-year Treasury Bond (orange line). The red line tracks the spread between the two.
When we see the spread elevated, like it is now, it typically precedes a large move lower in mortgage rates as they tend to follow treasury yields with a lag. So not only are mortgage rates at all-time record lows. If history is any guide, they’re about to move even lower.
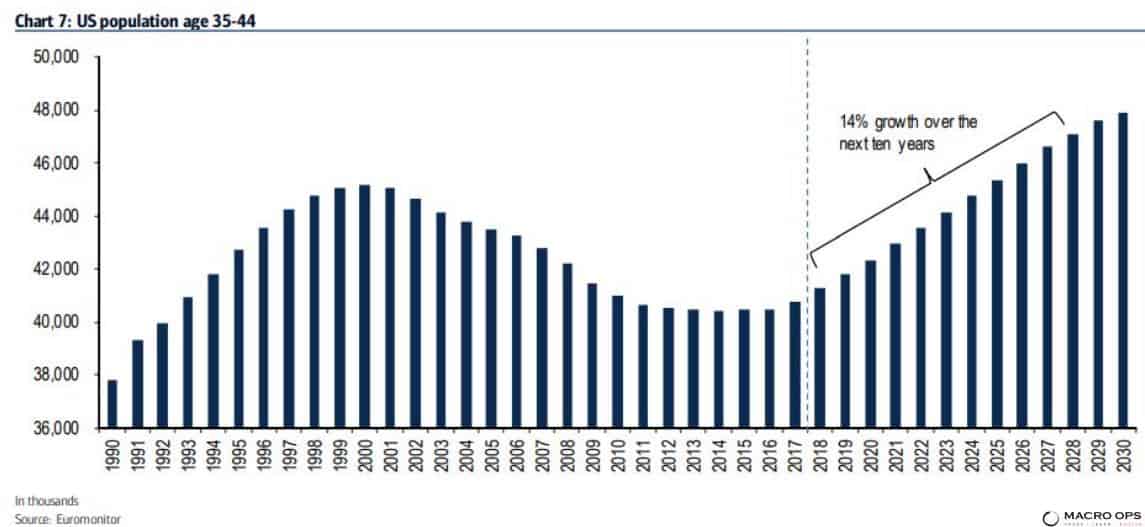
- The US demographic trends are incredibly favorable to the housing market over the coming decade. BofA notes that the “population of 35-44 year-olds is expected to grow 14% over the next ten years.”
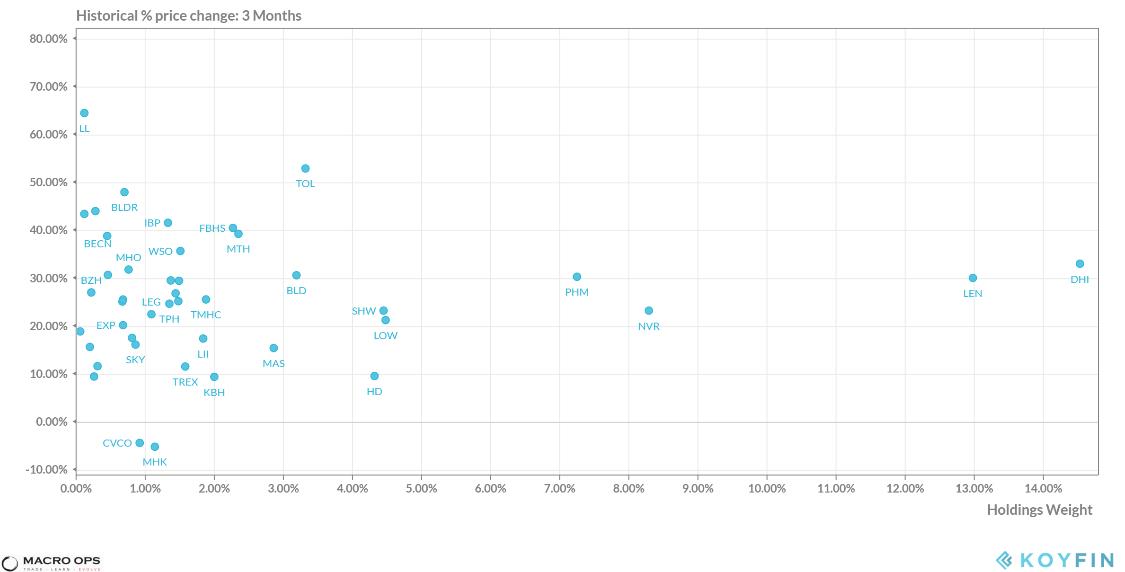
- Here’s the 3-month returns of top holdings from the US Home Construction etf (ITB) via Koyfin. This is a good starting point for finding some names. There’s plenty of good looking charts in this bunch.
- Hedge Fund manager John Huber tweeted the following last week regarding $TOL’s recent mid-quarter update. “Incredible numbers from housing lately. Existing home inventory falling to levels not seen in decades, at same time demand is flying. Sweet spot for builders, which are reporting numbers that are almost hard to believe. Here’s $TOL’s mid-quarter update (& 2019 wasn’t a bad yr)”
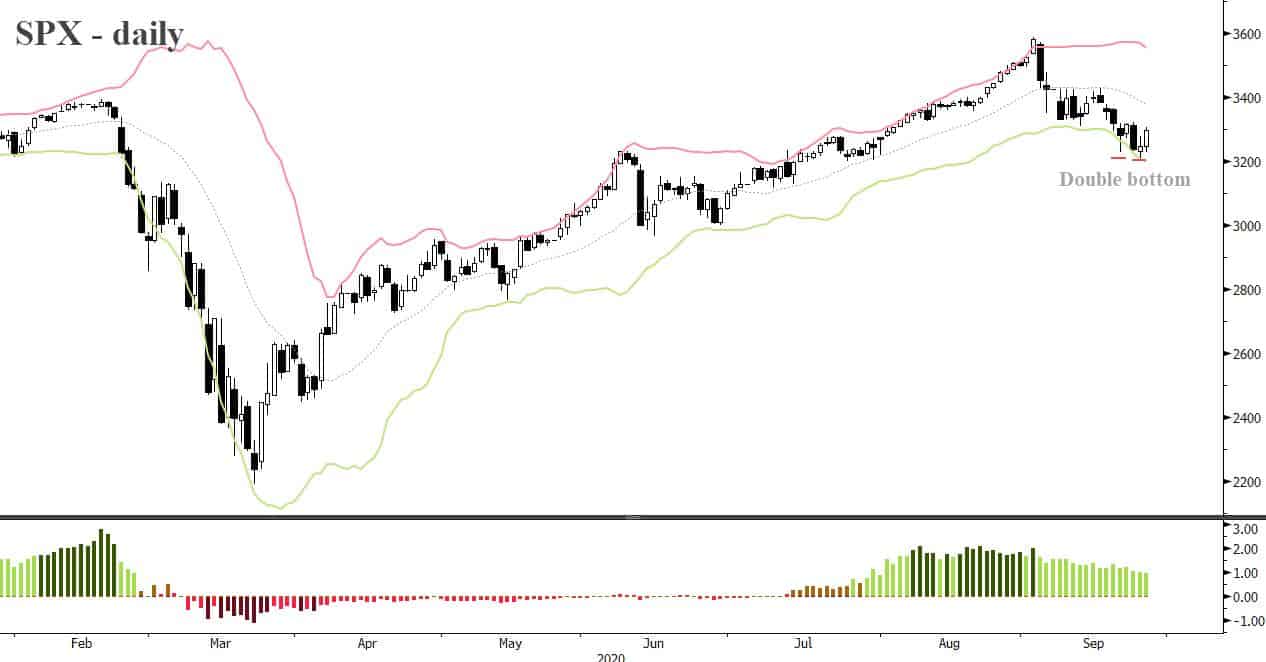
- SPX put in a double-bottom on the daily basis last week and it looks like we’ll get at least a small bounce this week. In addition, the SPX has seen four consecutive weekly bear bars which is unusual. Since 09’, the SPX has printed a positive week 7 out of 8 times following four consecutive weekly bear bars.
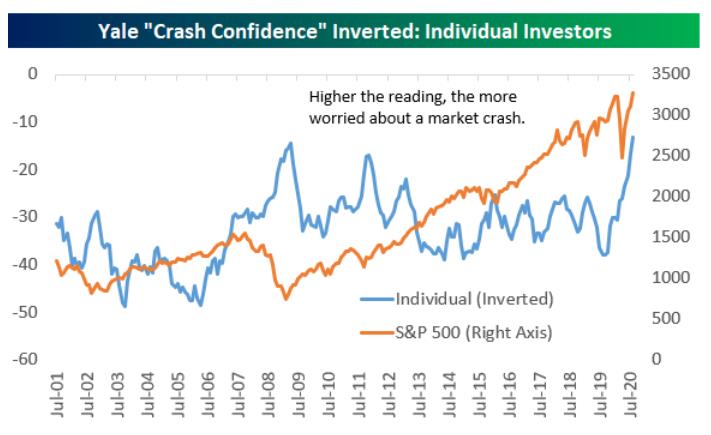
- The Yale “Crash Confidence” Index recently hit record levels. There’s a lot of people worried about a “market crash”. This fear gauge typically spikes directly following a crash. Which is funny because that’s exactly when a crash becomes least likely. This fits in with all the other indications of large cash piles and under-positioning that we’ve been talking about for over a month. At MO we’re worried about a crash too, but it’s a crash up… (chart via Bespoke Research)
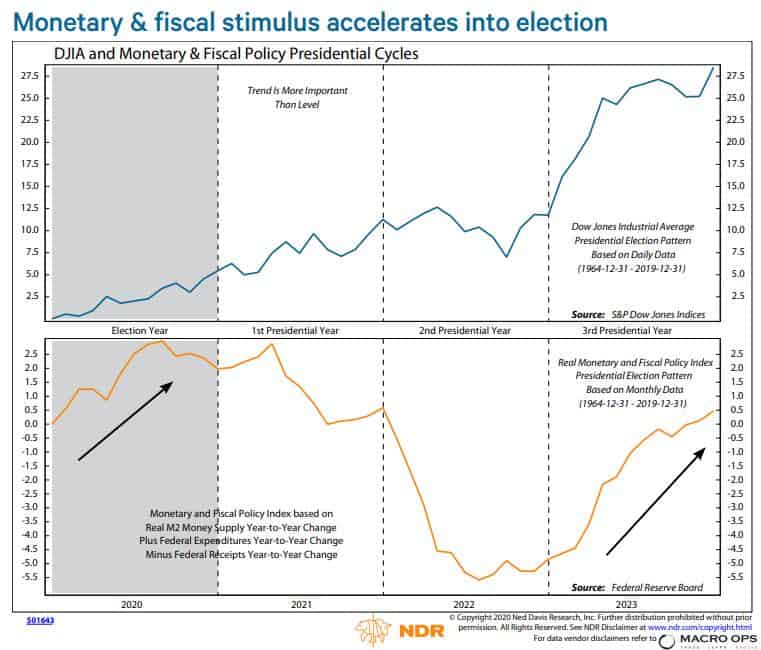
- High expectations of market crashes, investors sitting on large cash piles, a real estate market (a significant driver of household wealth) that’s incredibly tight and turning hot, and election year stimulus (to be seen, but I think we get it). That’s quite a potent bullish cocktail.
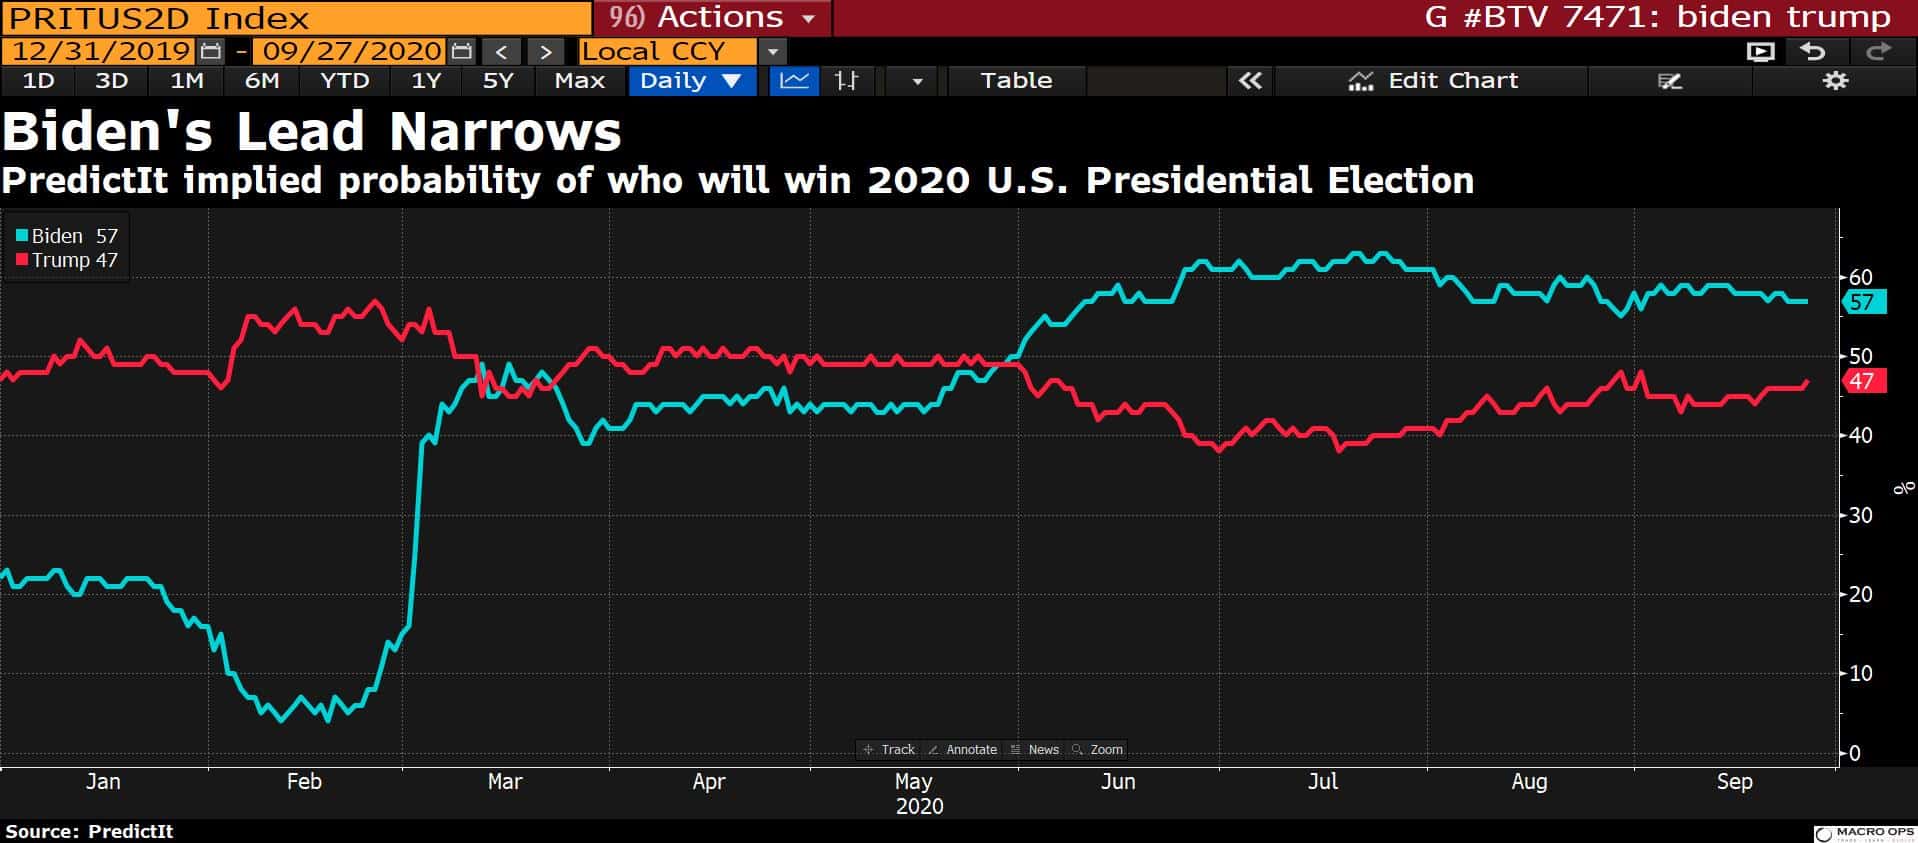
- Speaking of the election… Biden’s lead continues to narrow.
- With the first presidential debate this Tuesday, we could see some market moves if there’s a blowout performance by either Trump or Biden. This chart from NDR shows the 120-year election year market returns following various outcomes.

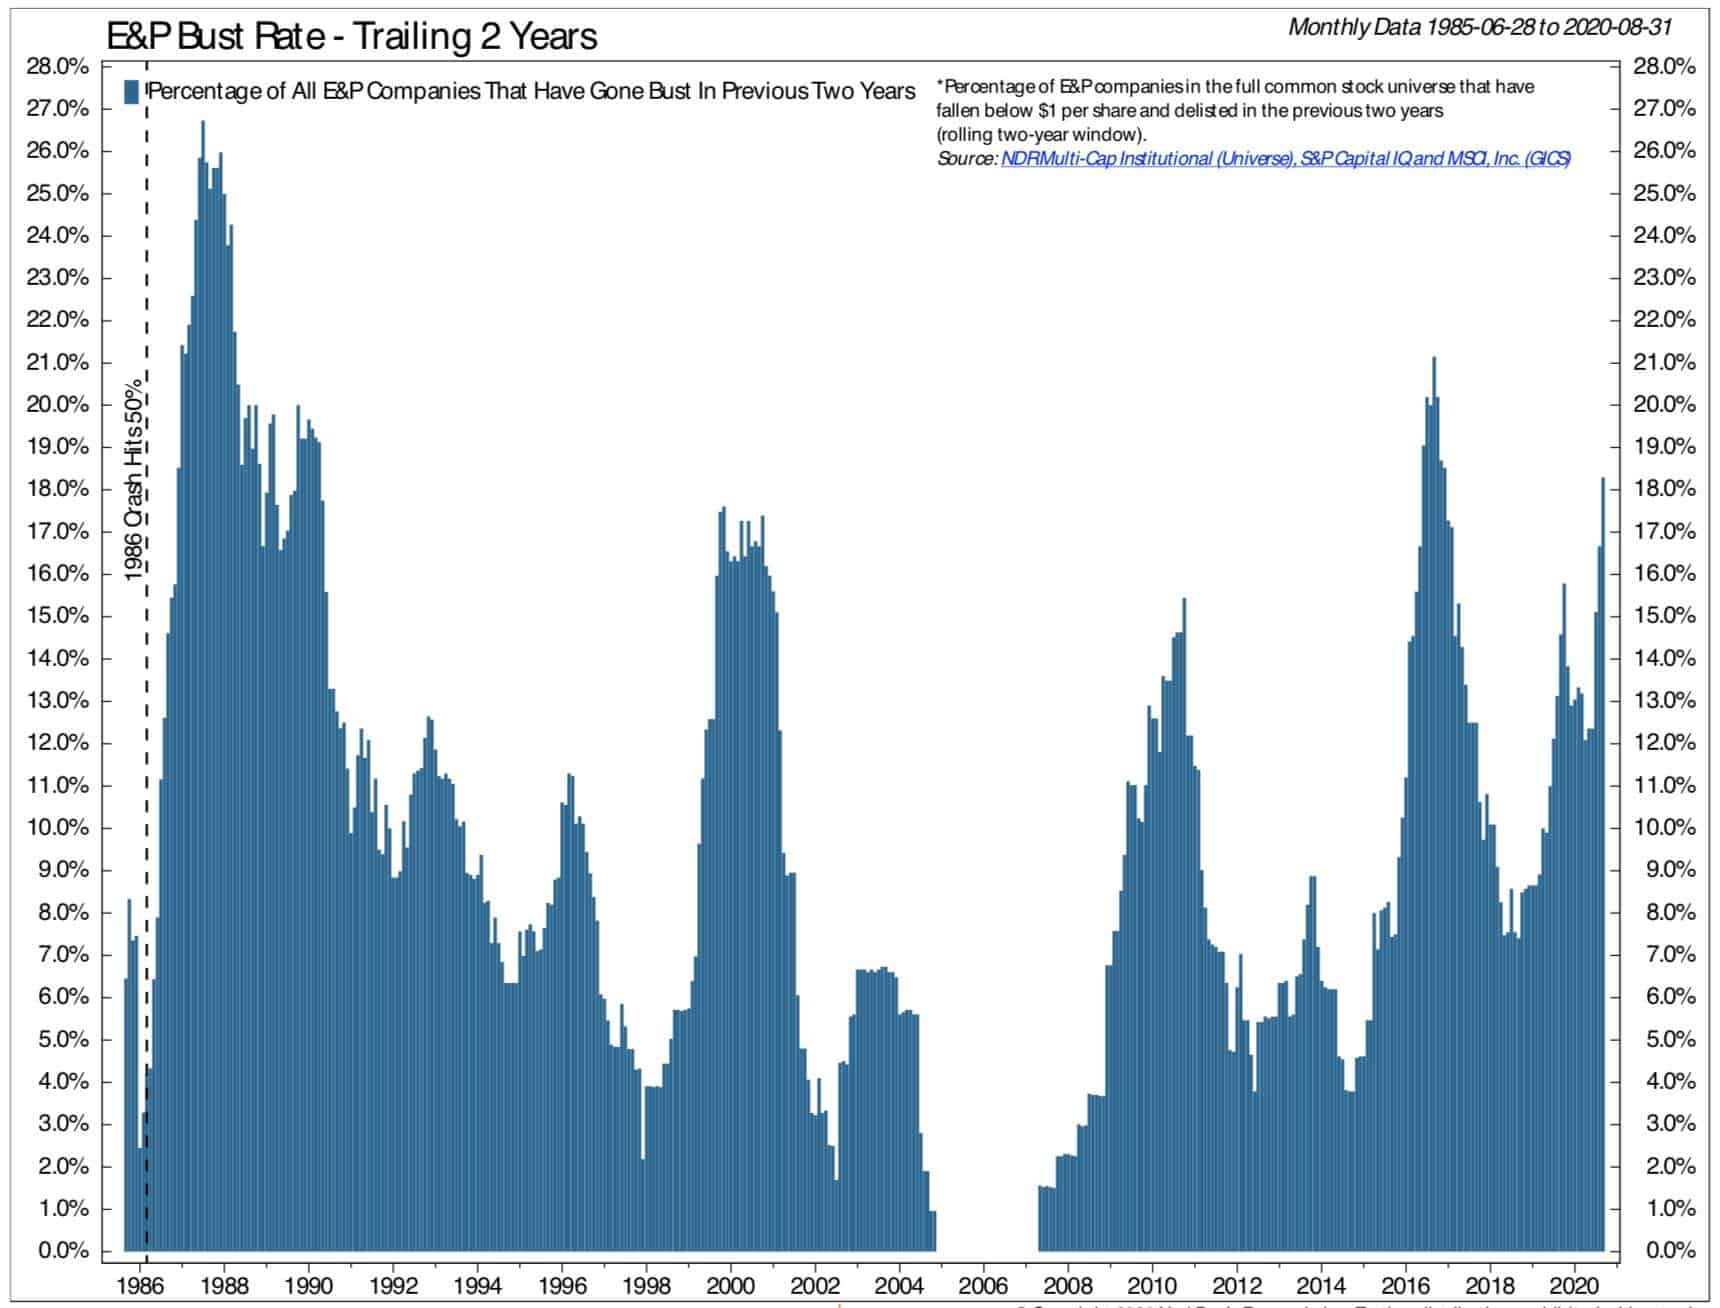
- I’m still watching the big bust in oil and related names play out. There’ll be some incredible deals once the dust settles, but I’m in no rush to buy. These cycle turns take some time and while the pieces are coming together, there’s still a few missing ingredients needed to put in a cyclical bottom. NDR’s energy strategist Warren Pies tweeted the following chart last week along with:
“The Bull case =
(1) Decreased excess capacity:
-E&P bankruptcies spike to new ATH (chart),
-Refinery closures (watching Europe/Japan)
2) Demand normalization (watch air travel)
Unfortunately, these things take time…”
Stay safe out there and keep your head on a swivel.