“In Japan, in the early-mid 90s one often heard the term “トリプル安” (‘triple yasu’) which meant when yen, the nikkei, and JGBs all fell on the day.
It was a sign of “decline of Japan in the world.”
Interestingly, the Nikkei used that reference for the US today.” ~@bauhiniacapital
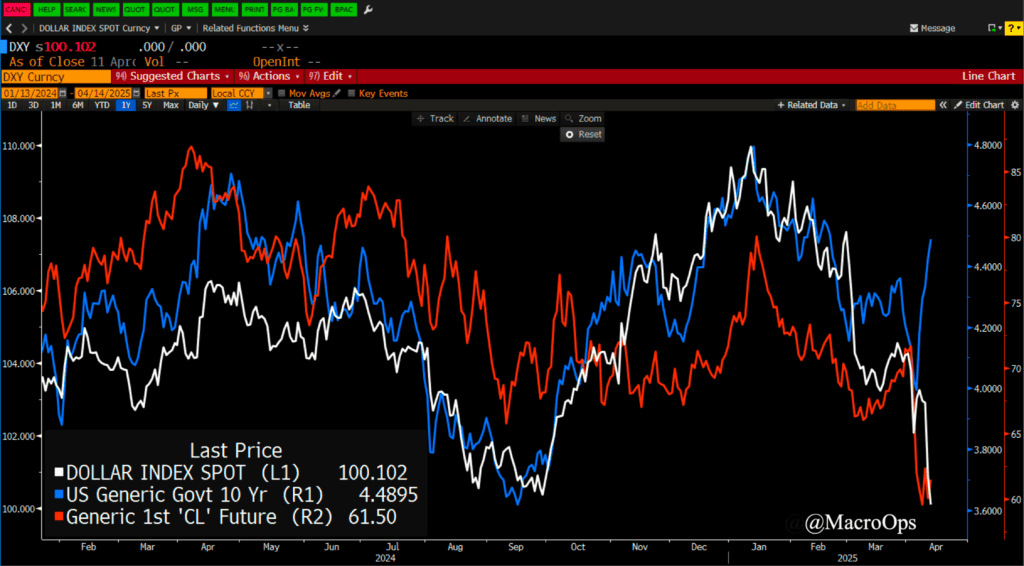
Summary: US is trading like an emerging market. This isn’t solely due to trade war developments but just as importantly due to the recent Republican tax proposals which would further widen the already sizable deficit. This is why bonds are experiencing historic volatility and DXY is having its worst start to a year, ever. Short-term indicators suggest continued bounce but the macro and actual positioning say that these rips should be sold into (or just hold lots of cash!). Long cash, long the front end, short USD, and long gold continue to be our preferred trades.
***The MO Macro portfolio is up +7.2% on the year. If you’d like to join our Collective as we tackle 2025 head-on, just click here. ***
Alright, let’s get to it.
1. “Still, the aggregate price action is little short of remarkable. By my reckoning, this is just the third week since the dollar was floated more than 50 years ago that the DXY has fallen at least 2.5% in a week in which the 10-year Treasury yield was up at least 25bps. The others were in July 1985 and May 2009, and both saw the dollar go on to post fairly substantial losses in the weeks and months ahead (in the former case, abetted by the Plaza Accord, of course).” ~ BBG’s Cameron Crise.
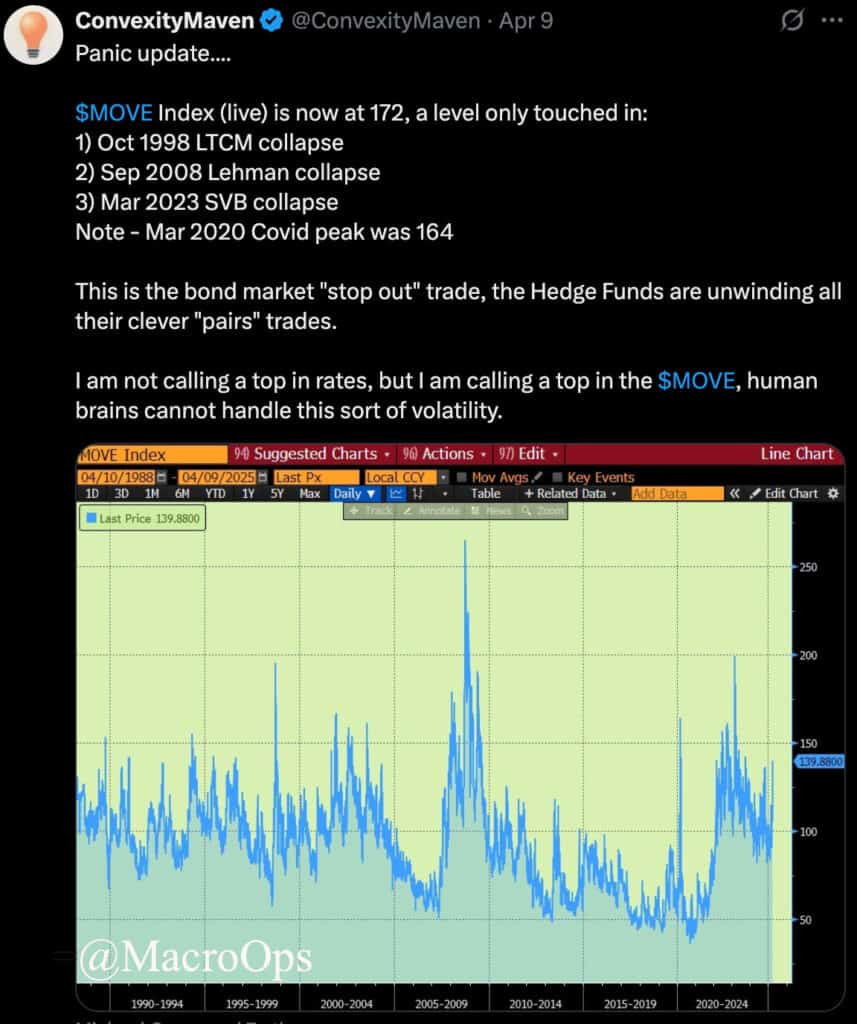
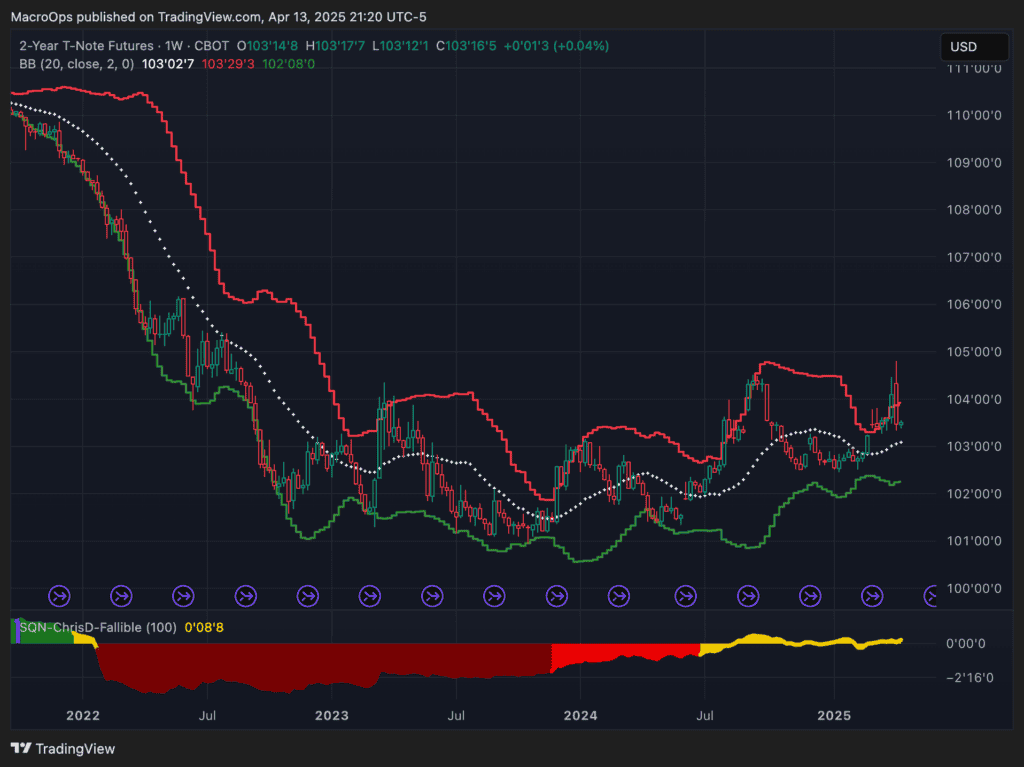
2. Bond vol hit historic highs last week…
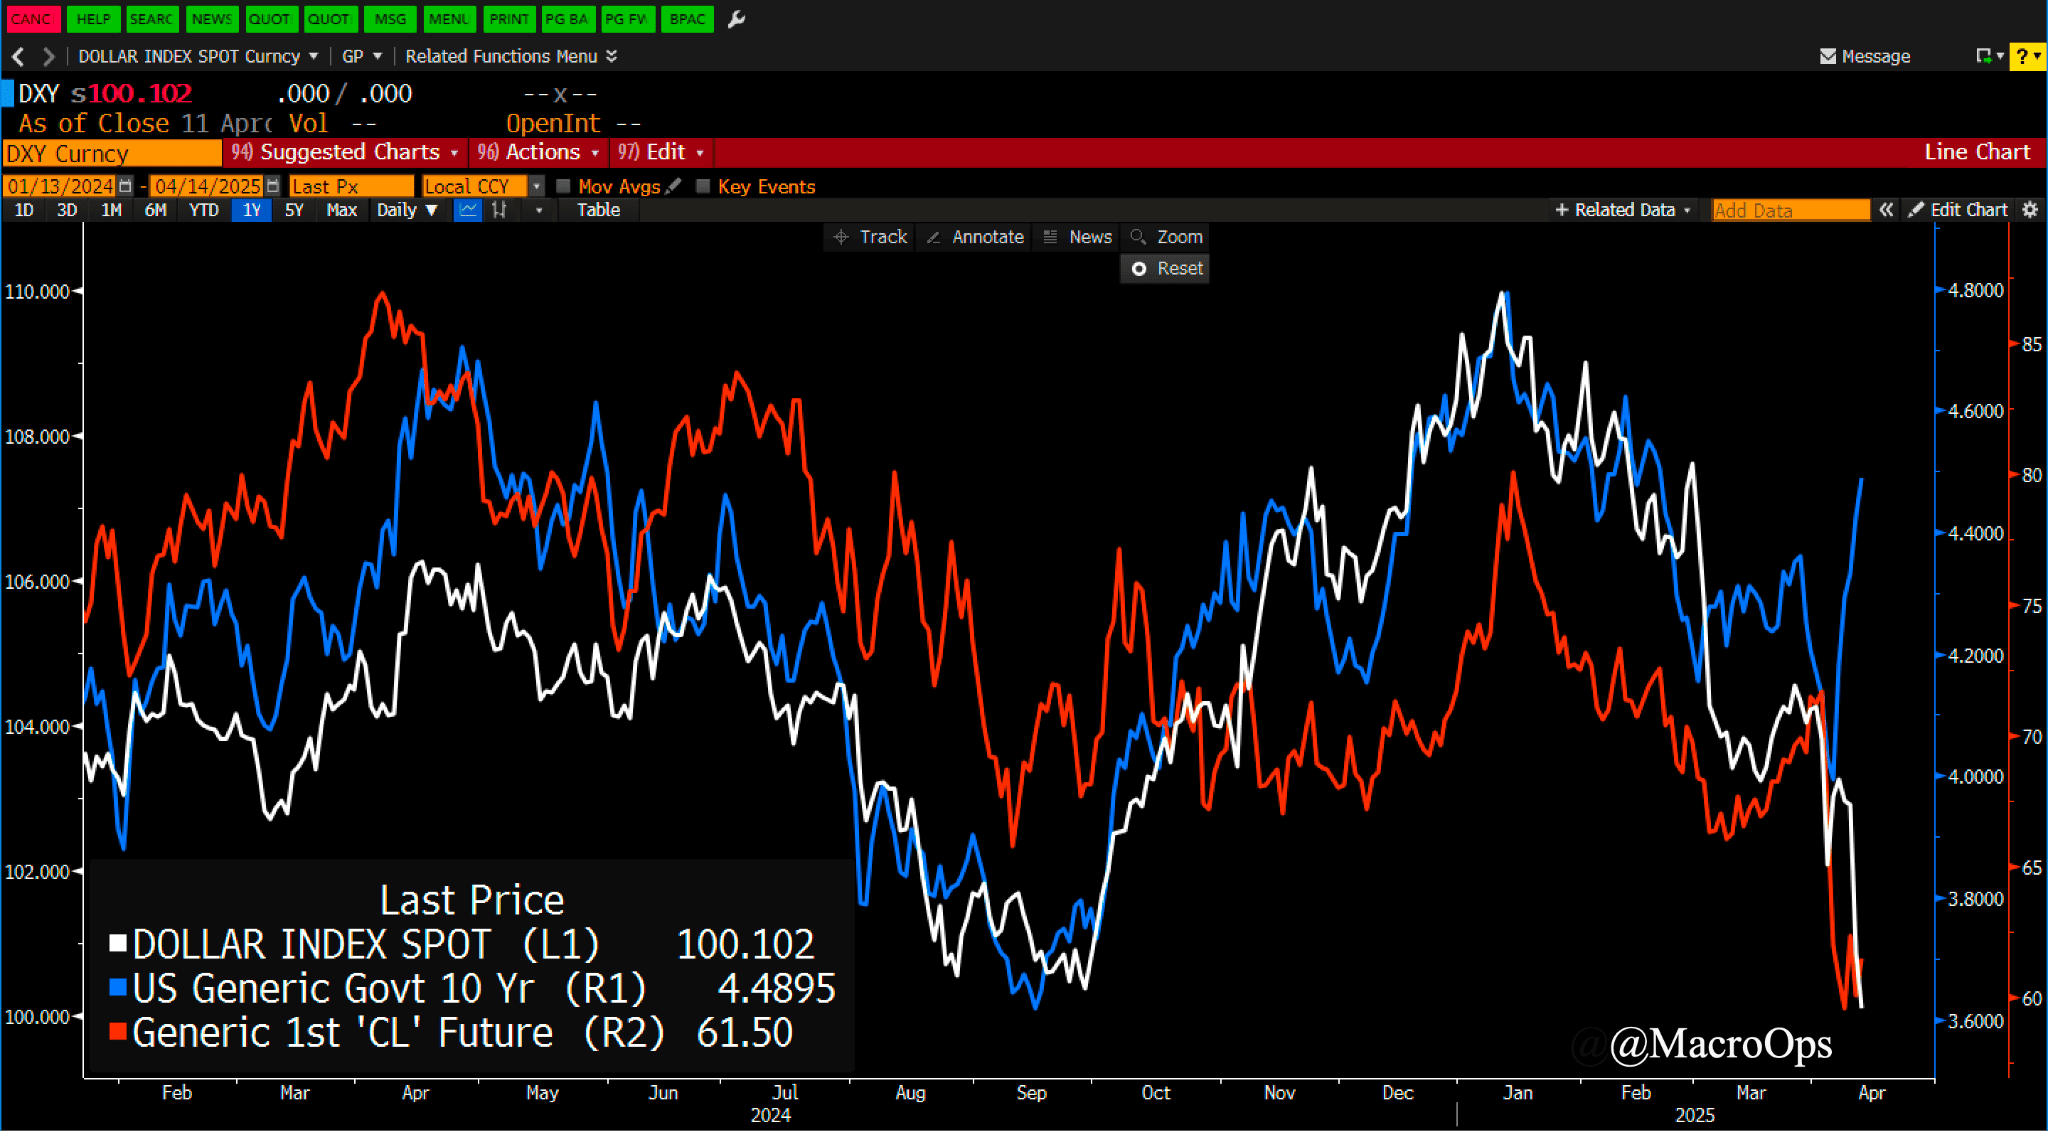
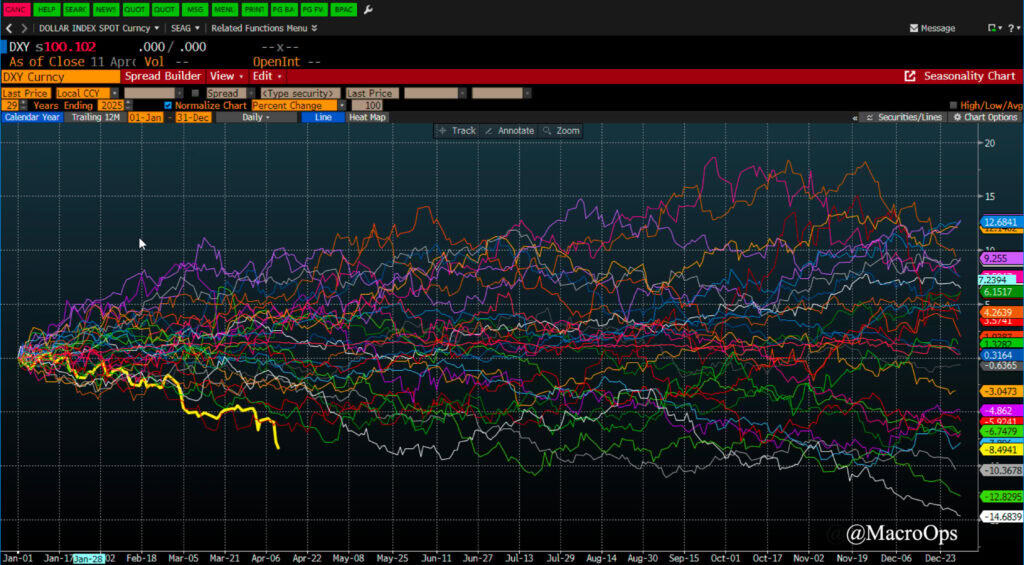
3. And the DXY is having its worse start to the year on record.
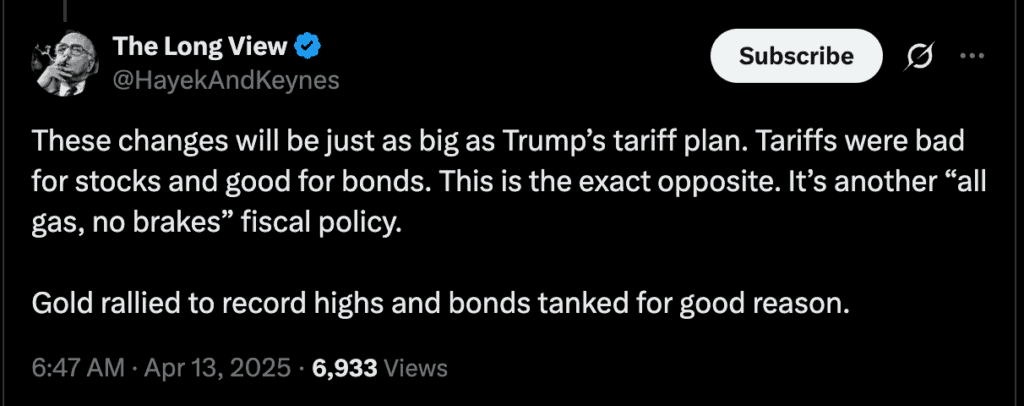
4. It’s not just tariffs driving the emerging-market-like behavior in U.S. interest rates and the dollar. A significant factor—possibly even more impactful—is the Republican tax cut proposals currently under discussion. If passed, these measures would further widen the federal deficit, amplifying fiscal pressures on the economy. You can find a good thread on it here.
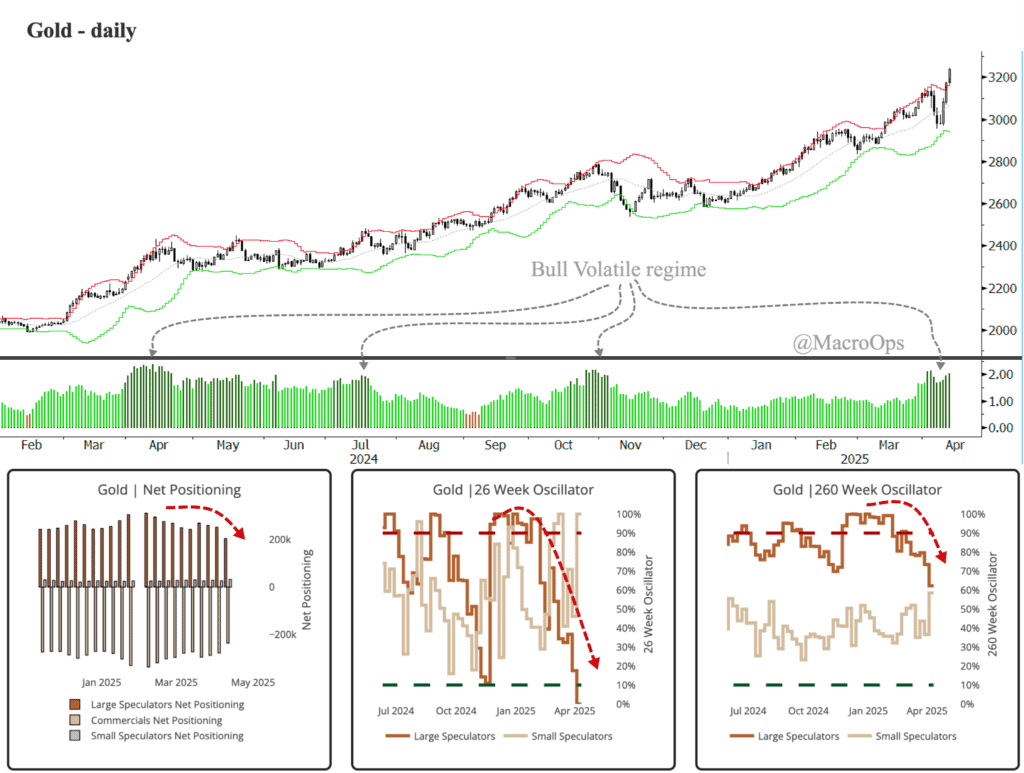
5. Our book is almost entirely long cash, gold/miners, and a starter long in the short end of the curve. Gold hit new all-time highs last week. It’s now trading in a Bull Volatile regime. These regimes are where tops and consolidations start, though it doesn’t mean that one will start soon as these regimes can persist for some time. It’s just a condition, not a catalyst.
One thing that’s interesting is that Large Specs have been selling down their longs for weeks now, despite the bullish action. PMs continue to be one of our faovrite long term trades.
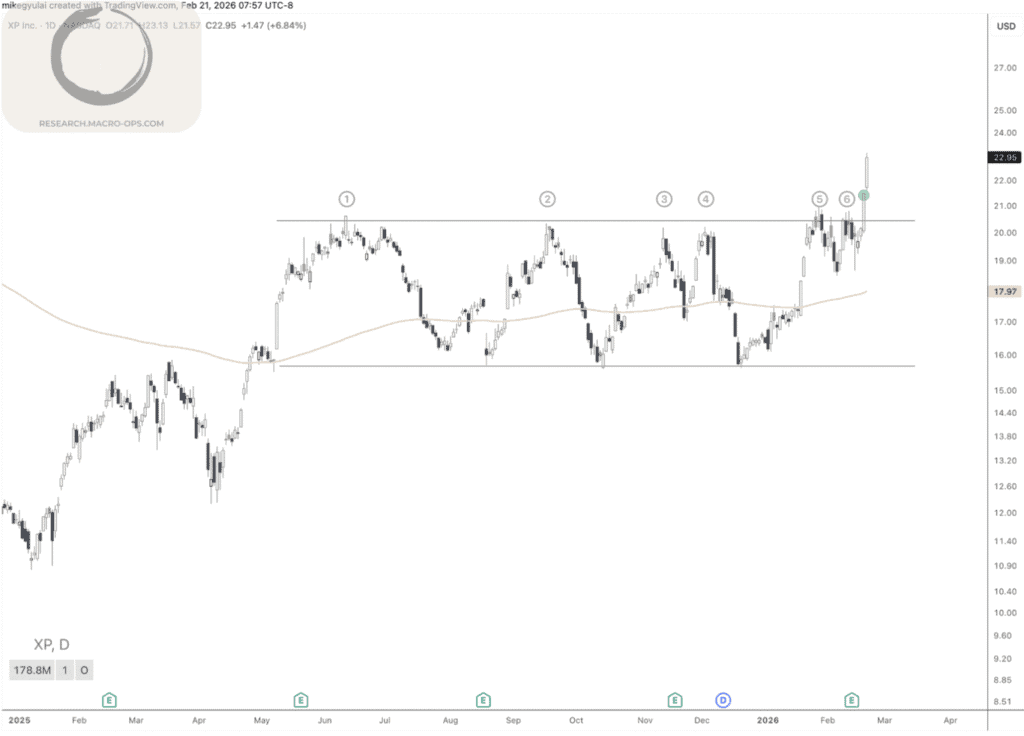
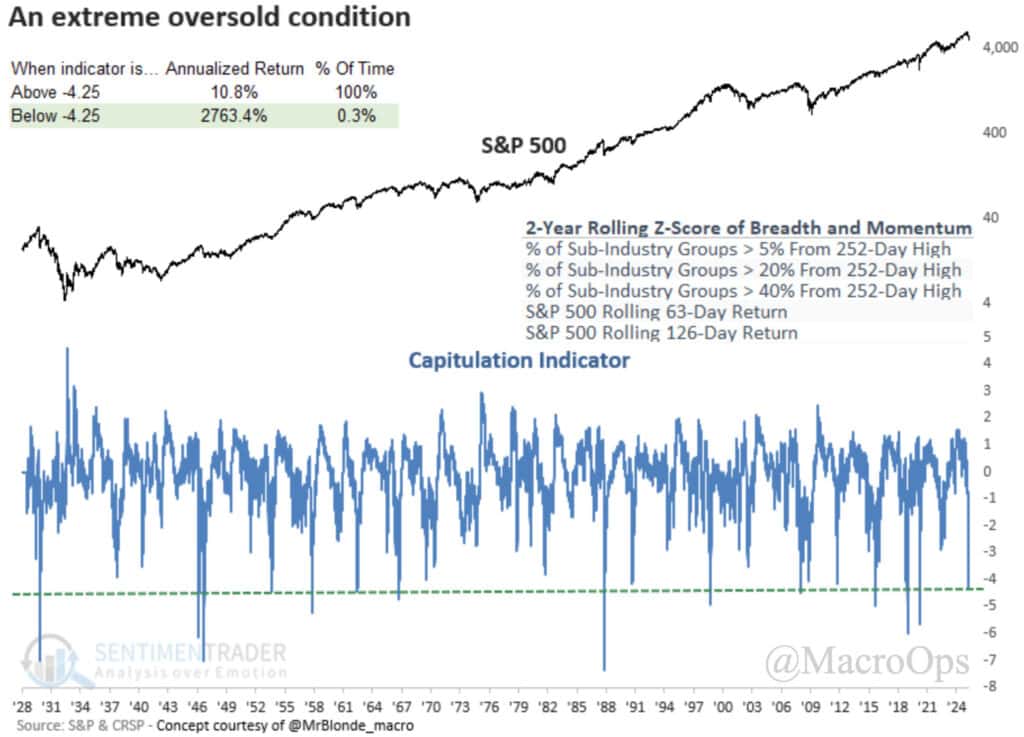
6. My base case is that the market’s upside is capped, while its potential downside remains high. So unless we see major breadth thrusts, we’re not interested in going long equities for anything other than a quick swing. However, the extreme oversold conditions could lead to a fast rally here, perhaps back up to the December range.
SentimenTrader notes that “A breadth and momentum indicator plunged to one of the lowest levels in history, suggesting capitulation… The model blends market breadth and price momentum indicators (see chart for components) to pinpoint capitulation or deeply oversold conditions. On Monday, the indicator fell to -4.33, a reading that has only occurred 13 other times since 1929.
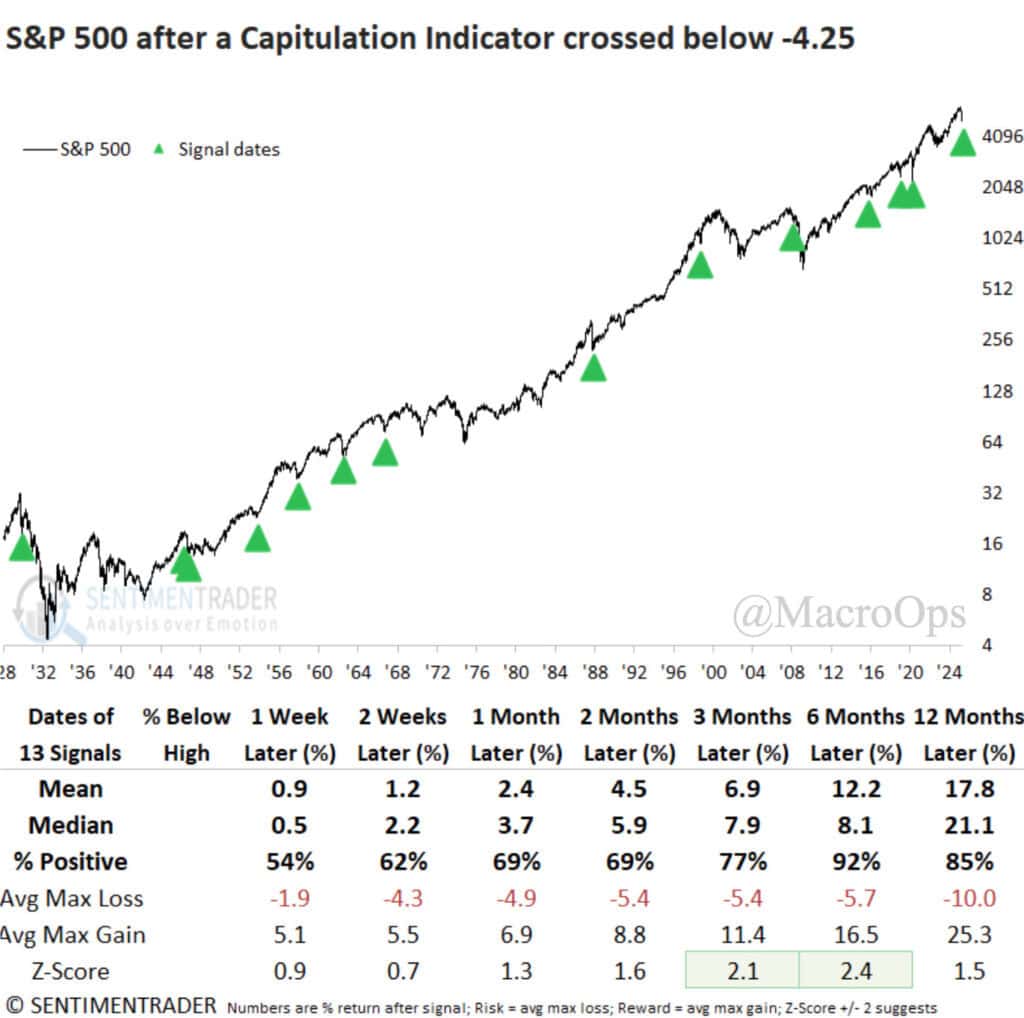
“Whenever the capitulation indicator plunged below -4.25, the S&P 500 tended to rally over the next year. The most favorable window occurred at the six-month mark, which rose 92% of the time and displayed significance relative to random returns.”
7. And “Over the bullish six-month window, a maximum loss of -10% was surpassed in only 2 out of 13 cases, albeit a few were close. By comparison, 9 of 13 rose more than 10%, underscoring a favorable risk-reward profile.”
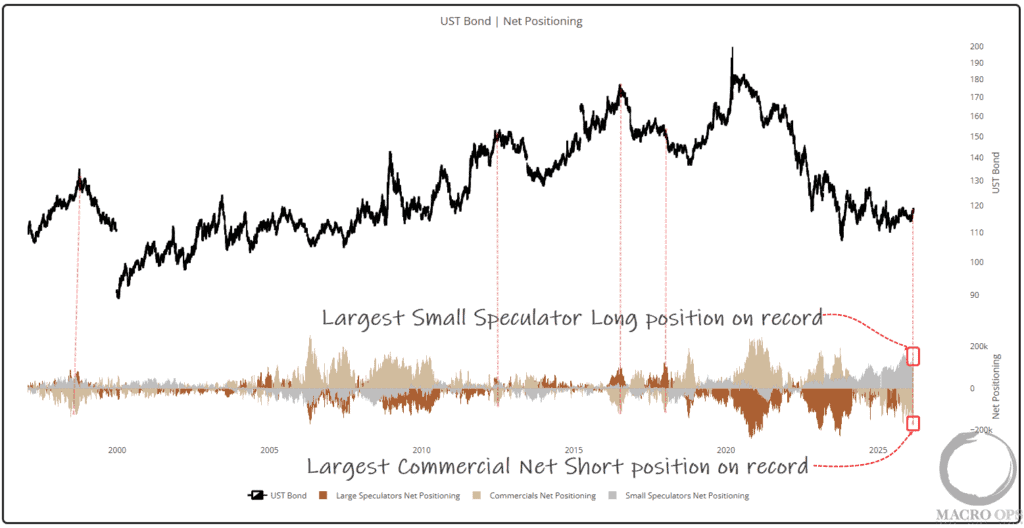
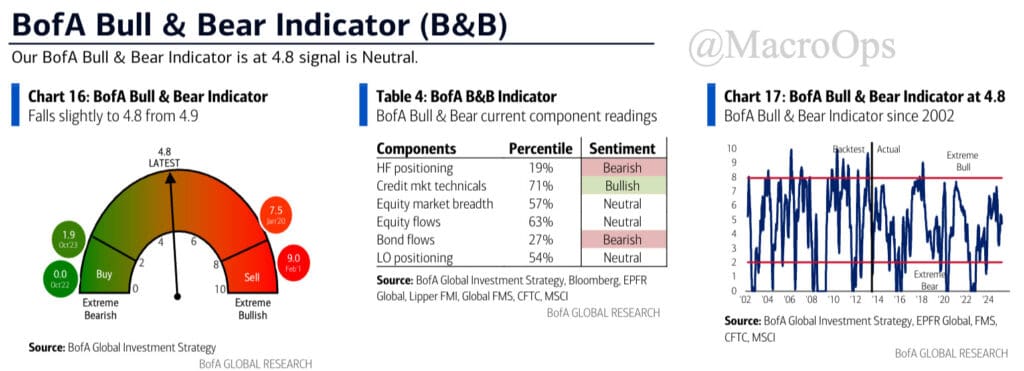
8. But a continued bearish sticking point for me is that while we’ve seen clear capitulation in technicals and sentiment surveys, we have not seen it in most broad measures of positioning. BofA remarked last week that “investor sentiment insanely bearish (why risk can rip)… but data shows investors much more emotionally bearish than physically bearish; BofA Bull & Bear indicator is not below 2 (currently 4.8), equity fund outflows nowhere close to 1-1.5% AUM (currently 0), BofA GWIM stocks allocation as % of AUM was 54% Mar ‘20, 39’ Mar ‘08 (currently 60%)… we think investors will reduce allocation to risk assets on rallies.”
I agree.
9. It’s been really interesting to see how eager the majority of investors are to call the bottom and to try and buy the dip here, considering the geopol sea change underfoot. I guess this is the type of Pavolovian dip-buying you see 15yrs into a secular bull market, which is one major reason why I’m increasingly bearish. Another reason is that the economy was slowing down well before this tariff nonsense even started.
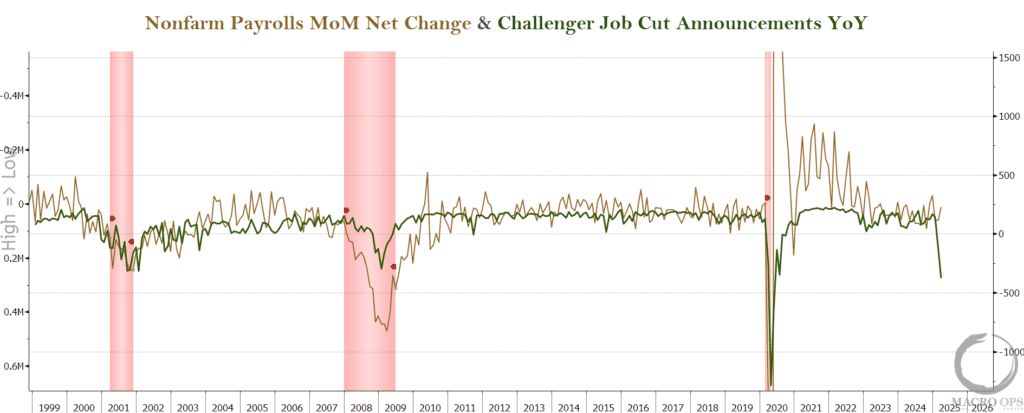
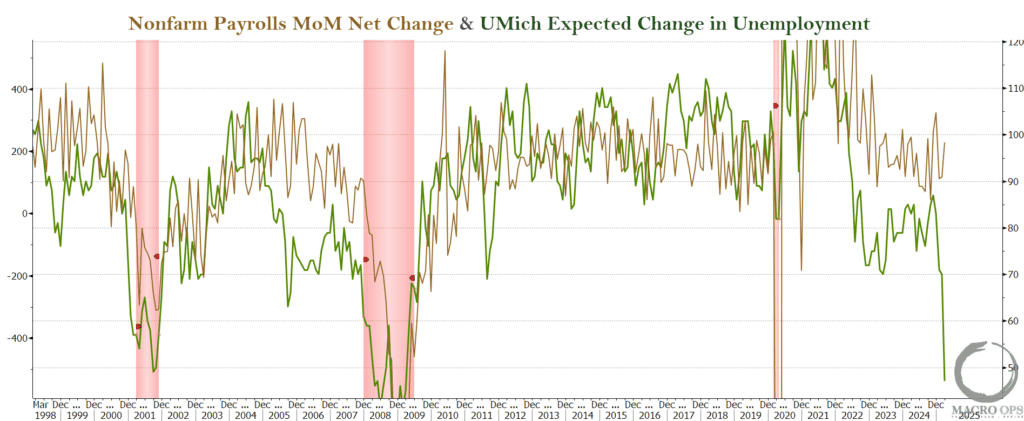
The Challenger Job Cuts report and the University of Michigan’s unemployment expectations both signal a looming downturn in the labor market.
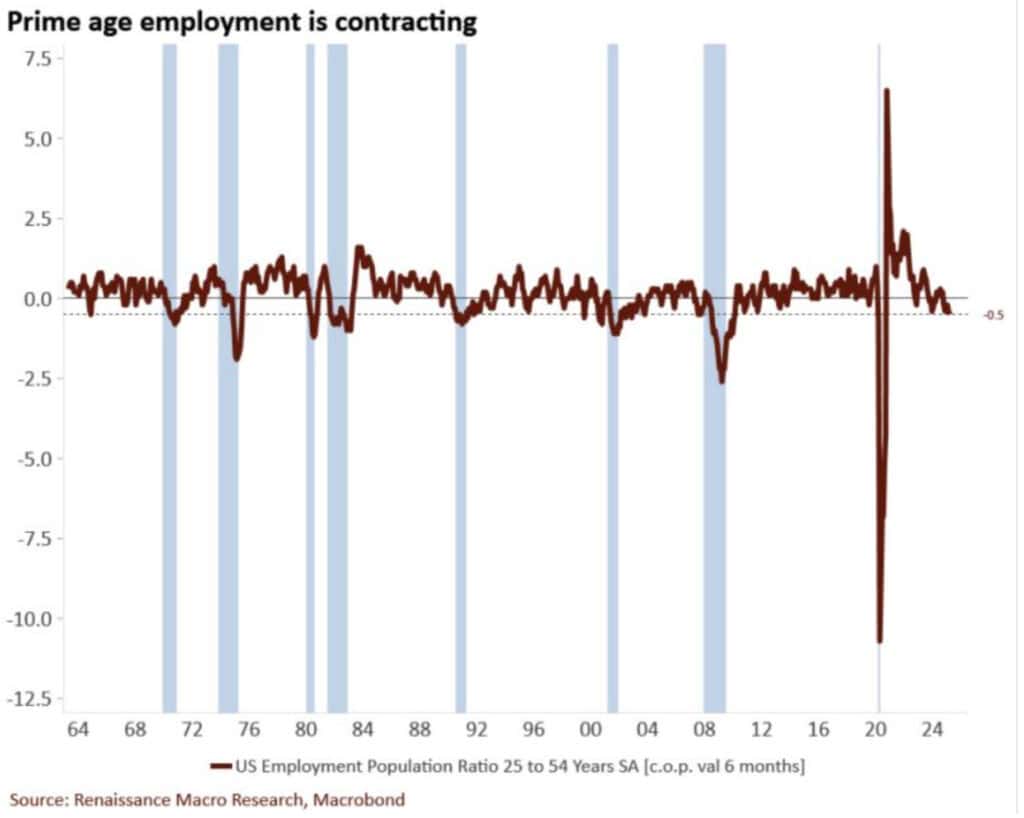
10. RenMac’s Neil Dutta wrote the other week that “…even before the latest tightening in financial conditions, prime-age employment was slowing down. Over the six months ending in March, the prime-age employment-to-population ratio fell 0.5ppt. It is rare to see a decline of this magnitude outside of recession. Hard to see why this improves anytime soon.”
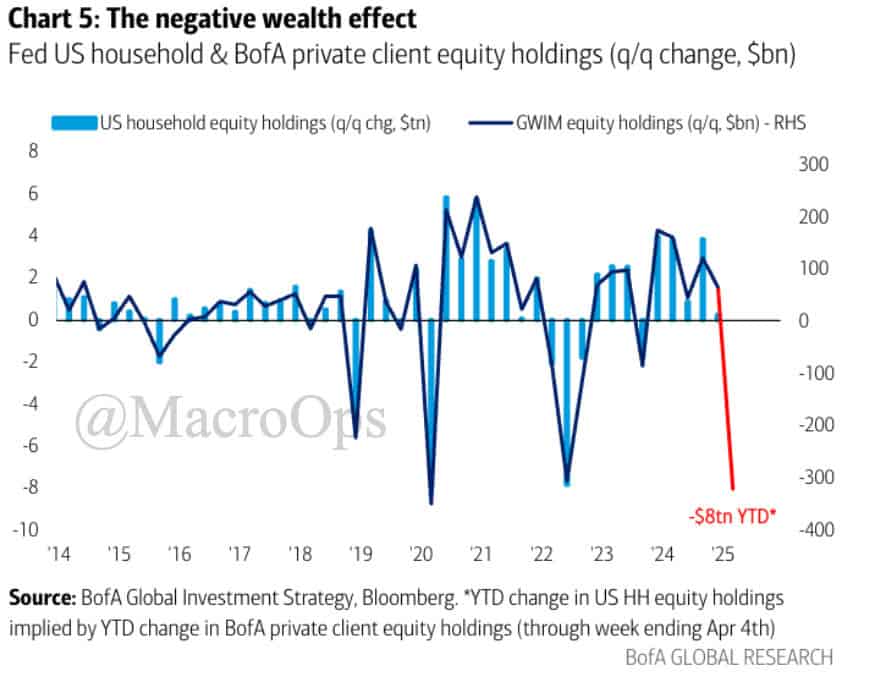
11. I don’t imagine the record levels of uncertainty that have been injected into the geopolitical game will boost CEO confidence and business’ willingness to invest and hire, so I’m guessing these trends sharply accelerate. Also, we are likely to see some bearish reflexiveness from a negative wealth effect impulse. BofA points out that “…using BofA private client equity holdings data we estimate US household equity wealth has fallen $8tn thus far in 2025, follows $9tn gain in 2024.”
12. This is why I think going long the front end will be one of the monster trades this year, although it may take a bit longer to get going.
Join The Collective
Thanks for reading.