“The market and the economy have just become hooked. We’ve become addicted to this government spending, and there’s going to be a detox period… Naturally, we will witness an adjustment as we transition from public outlays to private investments… There’s no [Trump] put… Access to cheap goods is not the essence of the American dream” ~ Collection of quotes from U.S Treasury Secretary Scott Bessent over the past week.
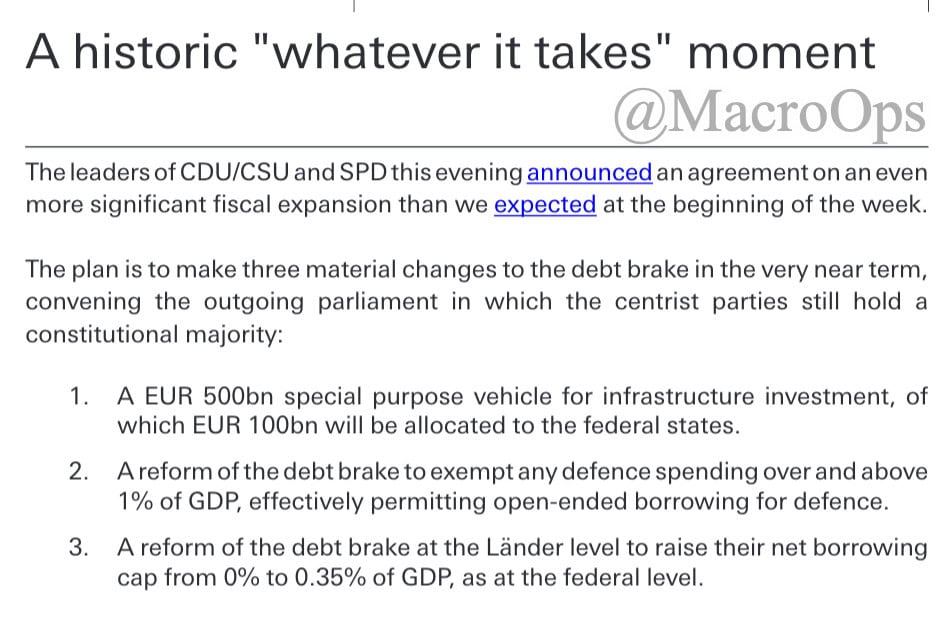
Summary: The SPX appears to be nearing a short-term bottom, perhaps following a bit more of a downside shakout to start the week. However, longer-term indicators suggest that we can expect continued market volatility with a growing downside bias over the coming months. For those looking to invest in indices, Europe presents a more attractive opportunity. The Euro Stoxx 50 stands out with favorable charts and robust macroeconomic fundamentals backing it. Additionally, soybean meal and cotton are showing extreme sentiment and positioning, combined with improving technicals, which may signal tradeable bottoms in these commodities.
Alright, let’s get to it.
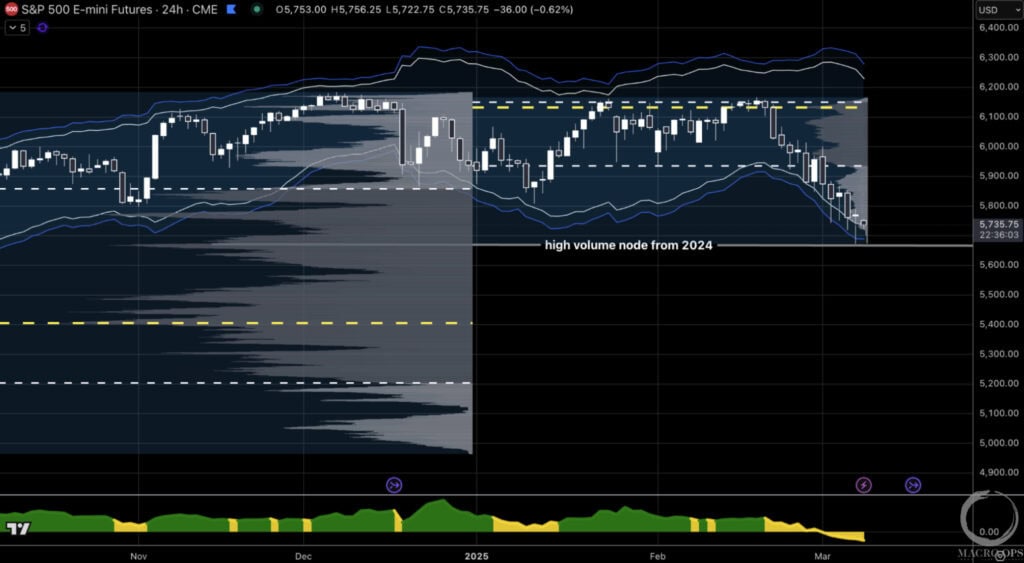
1. My partner Chris shared the following chart in this weekend’s market review (link here). He highlights SPX’s neutral SQN regime, NYSE Advancing issues (10w smoothed) at/near levels that typically mark bottoms, and the market’s high volume node from 2024, which is acting as support and marking the lows from last week.
All that to say, the evidence suggests we’re at what is likely a local low, so expect some upside reversion soon, perhaps following a bit more initial downside volatility this week. However, tape bomb risks abound, so stay light and nimble.
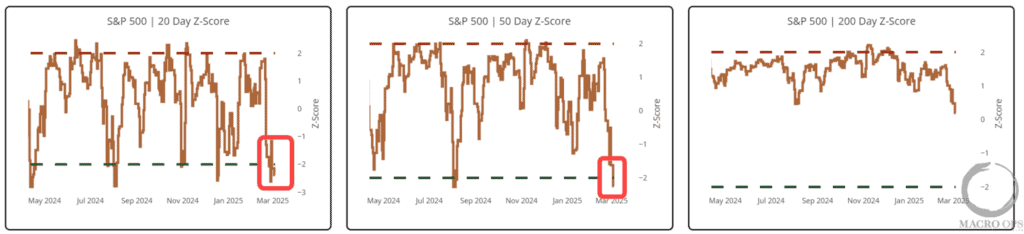
2. Here’s more evidence favoring short-term mean reversion with the SPX tape over 2std below both its 20 and 50 day moving averages.
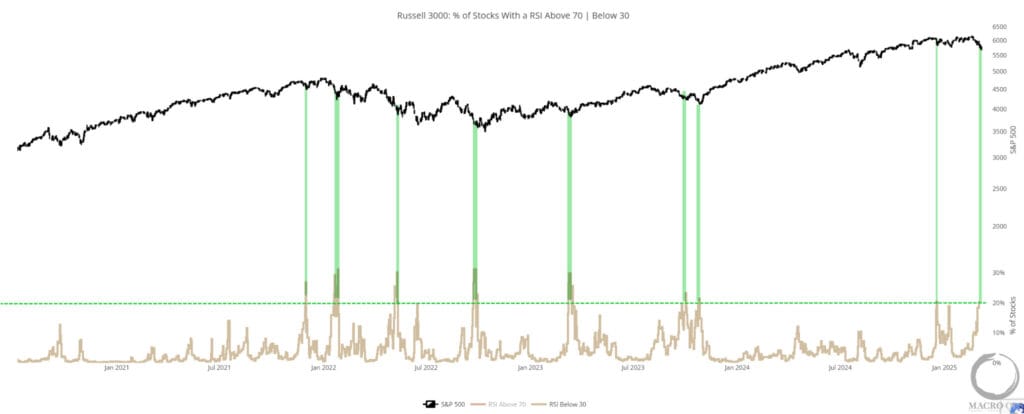
3. And the percentage of R3K stocks with an RSI below 30 having climbed above 20% last week. A level that tends to mark local lows.
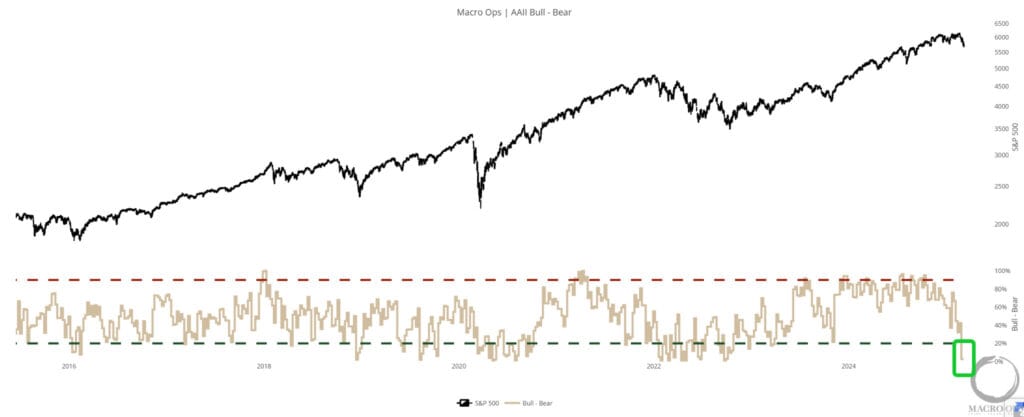
4. AAII Bull-Bear dropped to the 0th percentile last week. This isn’t a reason to load up longs (just look at 2022, when bearish sentiment coincided with a bear market). But it shows that sentiment is in the process of resetting from elevated levels.
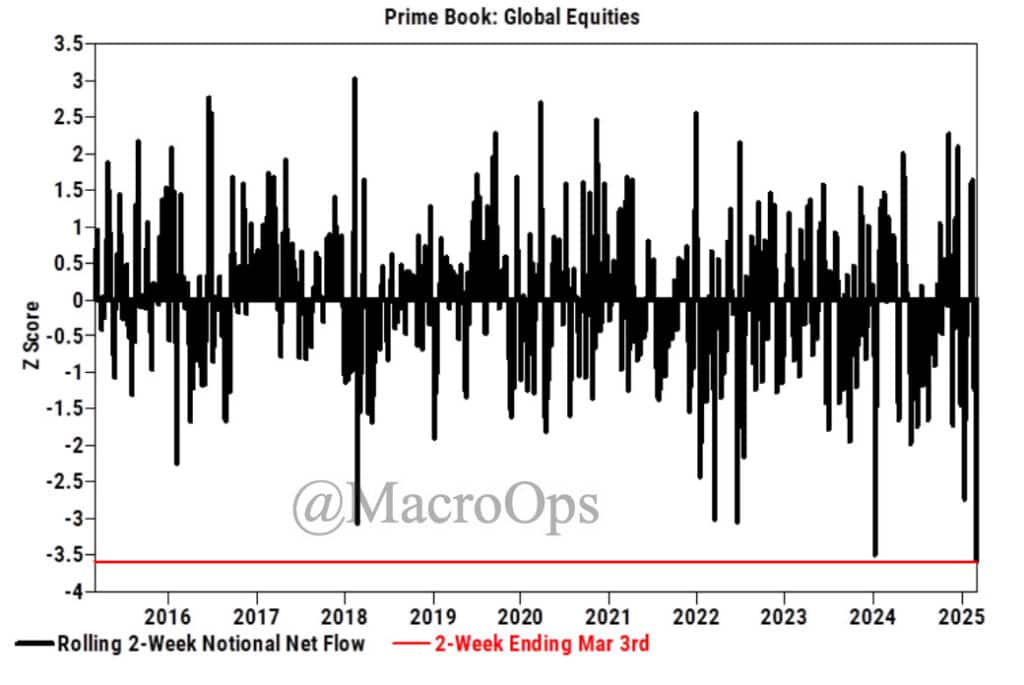
5. GS’s Prime Desk noted that “on a 2-week rolling basis (since Feb 18th when YTD Fundamental L/S returns peaked), global equities on the Prime book have seen the largest 2-week notional net selling in the last 10 years…. On a 10 day rolling basis coming into today, Fundamental L/S “Net” leverage has dropped -4.9pts – the largest 10-day reduction since Sep ‘22.”
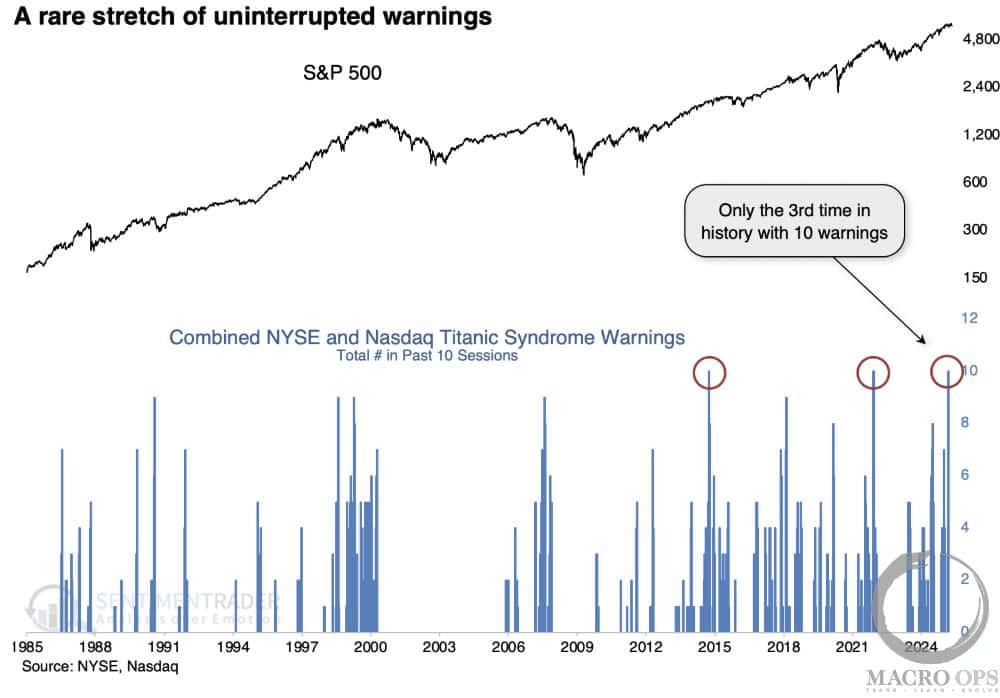
6. While the data suggests we’re nearing a short-term bottom, the broader evidence is saying at best we’re in for a period of sideways chop and vol in US equities, and at worst, further downside in the months ahead. Here’s SentimenTrader with some interesting color “Forget the stupid name of the indicator; it simply highlights a technical market condition when stocks have recently been at a high, and then there is a sudden jump in new 52-week lows versus highs on the NYSE.
“These signals have triggered not only on the NYSE but also on the Nasdaq exchange. For only the 3rd time in 40 years, the combined Titanic warnings across both exchanges have totaled ten in the past week.”
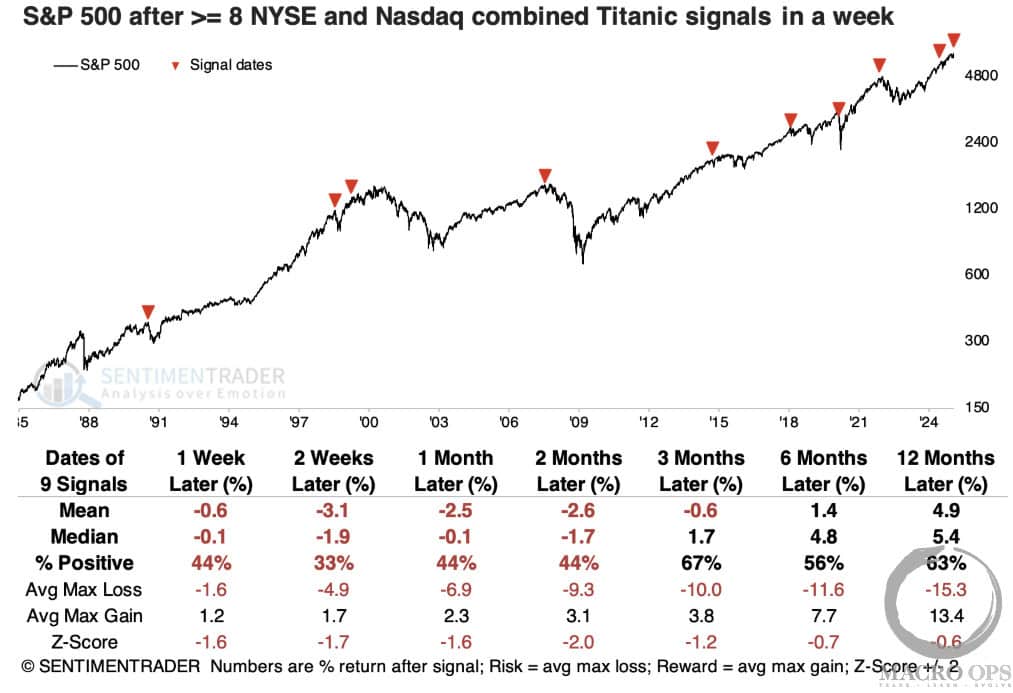
7. Again from ST “These clusters continued to precede poor returns for the S&P in the weeks ahead, and even over the following year, average risk was higher than average reward… The other major indices also tended to suffer, with the Nasdaq Composite and Russell 2000 bearing the brunt over shorter time frames. Up to six months later, average returns were poor across all the indices.
“Defensive-oriented sectors like consumer staples and utilities were the only consistent ports in the storm across time frames. They stood out among all sectors as having positive returns over time.”
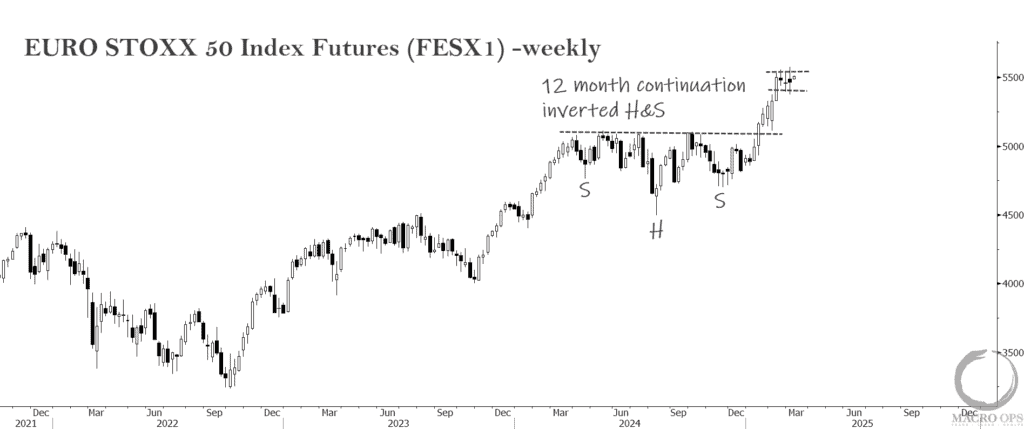
8. I’m not interested in playing US indices — if I were I’d go long YM (Dow) for a swing long due to technicals and positioning. But I do like the EURO STOXX 50 here. It recently put in a significant 6 week consecutive bull thrust out from its year long inverted H&S continuation pattern.
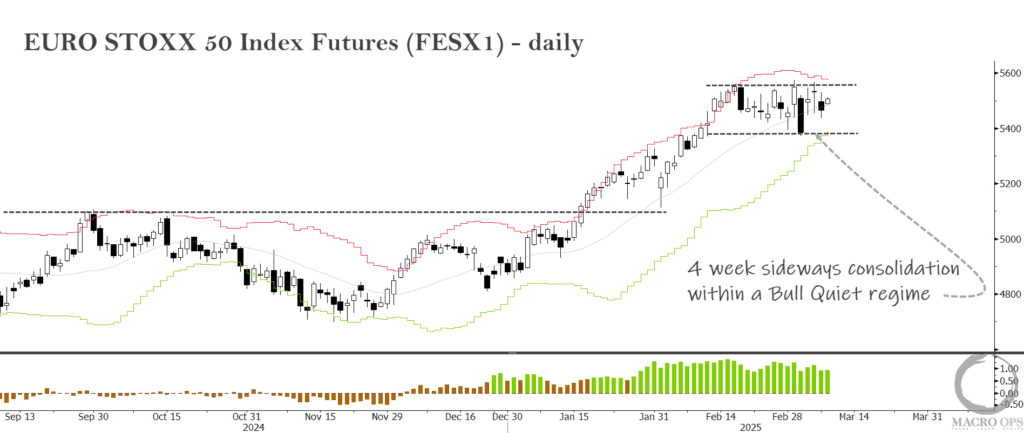
9. The daily is in a solid Bull Quiet regime and consolidating in a 4 week rectangle. I’m a buyer on a daily close above this range or a strong reversal near its lows. We’re also long the euro and will be adding on pullbacks/consolidations.
10. Why the recent outperformance out of Europe? Here’s DB with the answer…
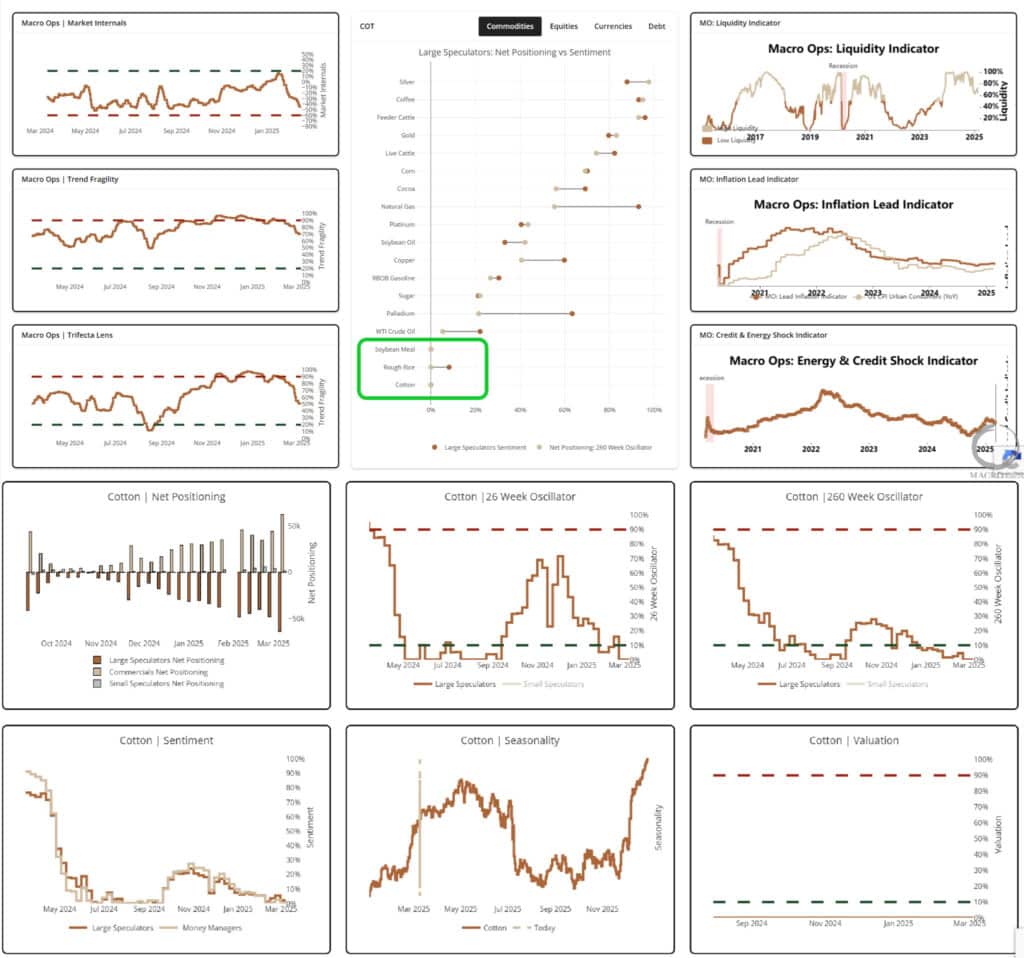
11. Shifting gears… let’s take a look at the Home tab on our HUD. See the green box? Net Spec positioning and our MO Sentiment Indicator for Soybean Meal and Cotton are in the 0th percentile. Both present attractive technical long setups.
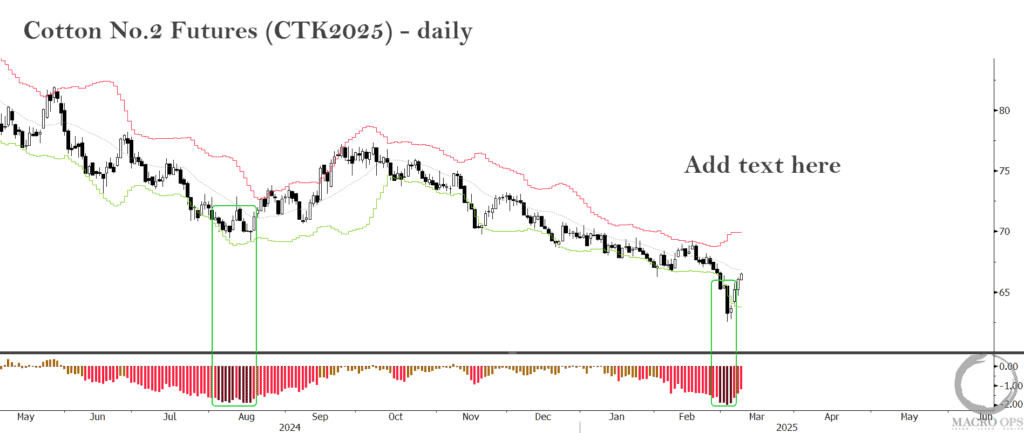
12. Cotton put in a puke reversal and printed Bear Volatile regime bars (crimson red histogram) last week, indicating a likely bottom is in. We’re tracking for an entry.
Join The Collective
Thanks for reading.