“One of the jobs of a good trader is to imagine alternative scenarios. I try to form many different mental pictures of what the world should be like and wait for one of them to be confirmed. You keep trying them on one at a time. Inevitably, most of these pictures will turn out to be wrong — that is, only a few elements of the picture may prove correct. But then, all of a sudden, you will find that in one picture, nine out of ten elements click. That scenario then becomes your image of the world reality.” ~ Bruce Kovner
Good morning!
In this week’s Dirty Dozen [CHART PACK] we look at two scenarios (1) summer doldrum chop and vol and (2) a growth led buy climax. We then go through the latest BofA fund manager survey, look at falling inflation expectations, gold at an inflection, and some yen charts, plus more…
Let’s dive in.
***click charts to enlarge***
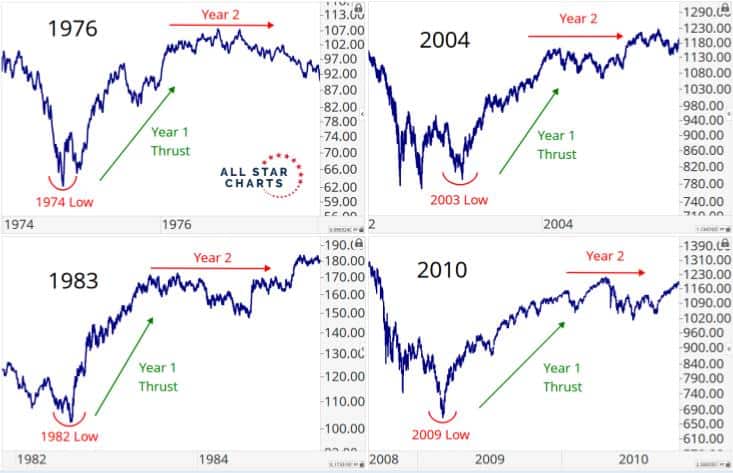
- We’re entertaining two macro takes right now (1) the market is about to roll over into a couple months of sideways chop and vol summer doldrums style or (2) market rips higher first, led by growth, and then rolls over and enters an extended range. This cycle composite chart via NDR shows the potential path of the latter (h/t @MacroCharts).

- All Star Charts show that year 2 of a bull is often an extended period of consolidation.
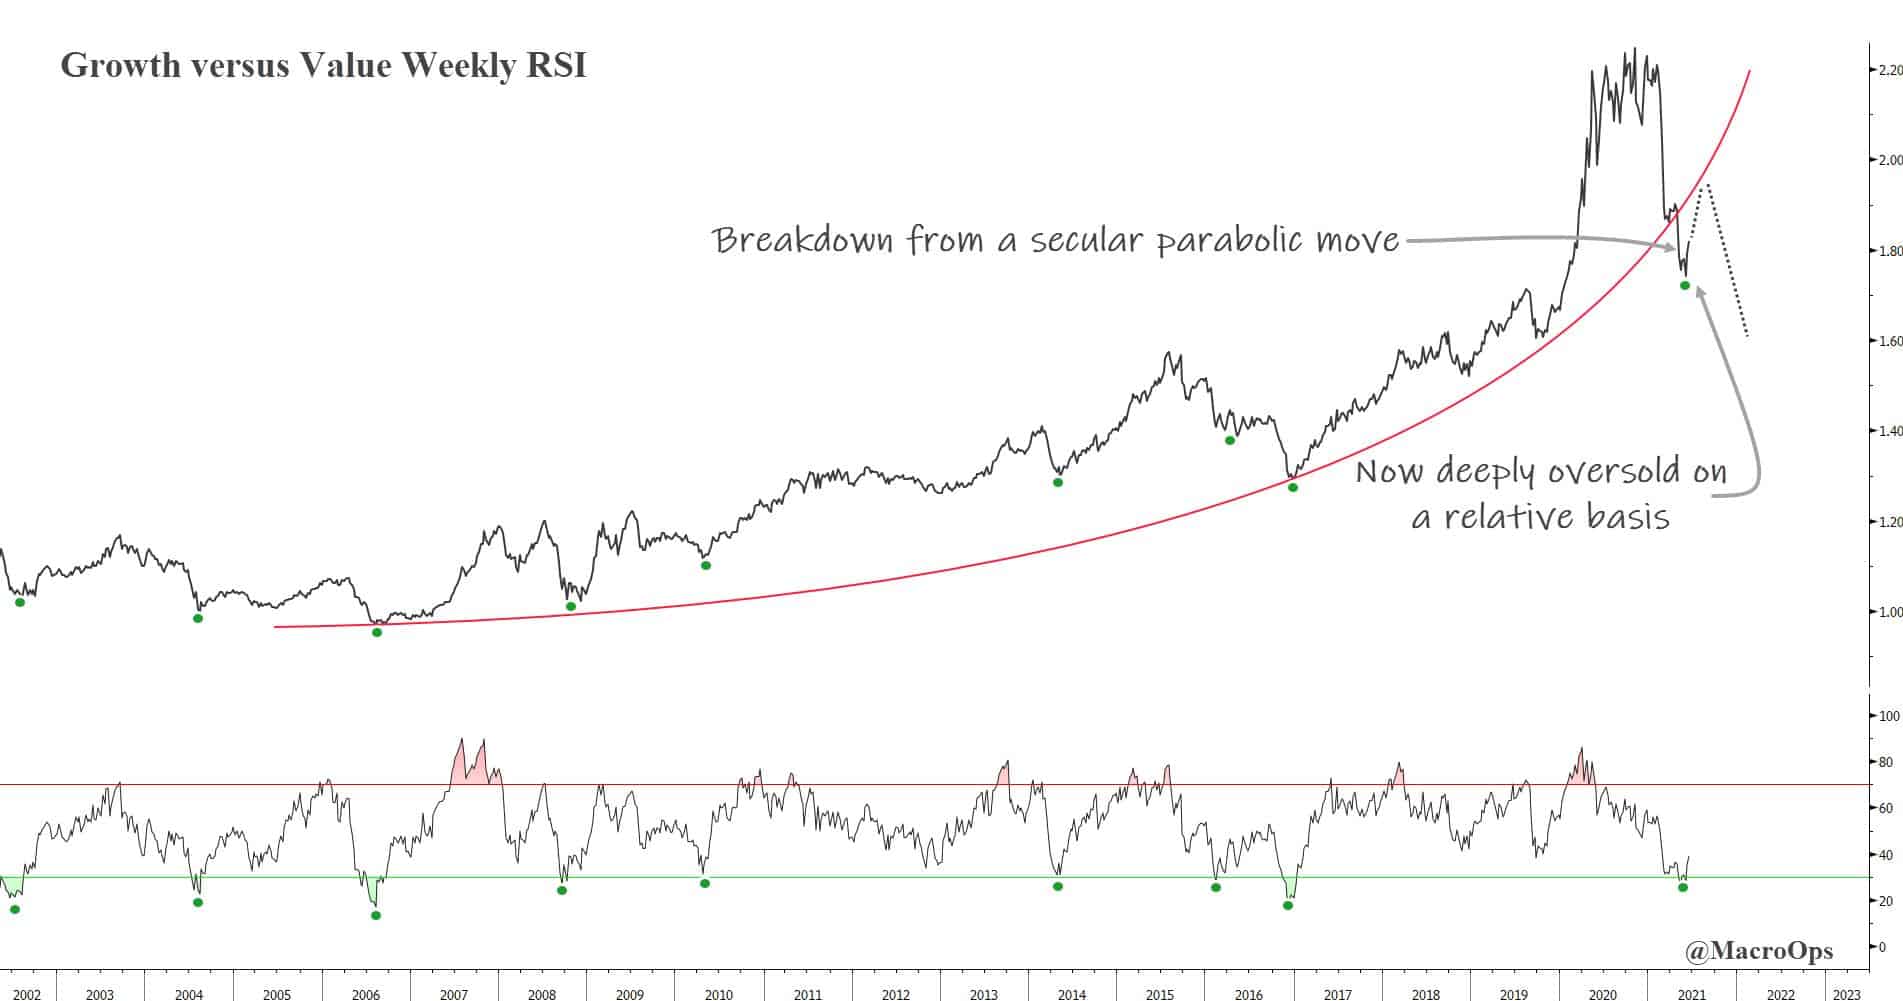
- If the market doesn’t go right into the summer doldrums here then growth looks poised to outperform. Growth vs Value weekly RSI is turning up from deeply oversold levels.
- BofAML’s June Global Fund Manager Survey is out. Here’s this month’s highlights.
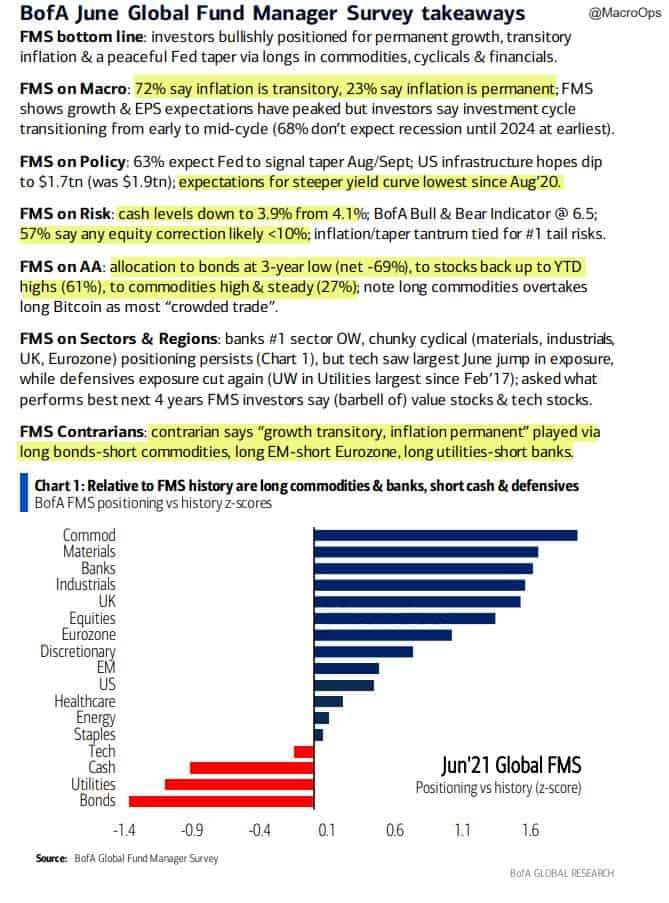
- And a few interesting charts of note from the report. According to the survey, very few managers are expecting a selloff of much size over the next 6-months.

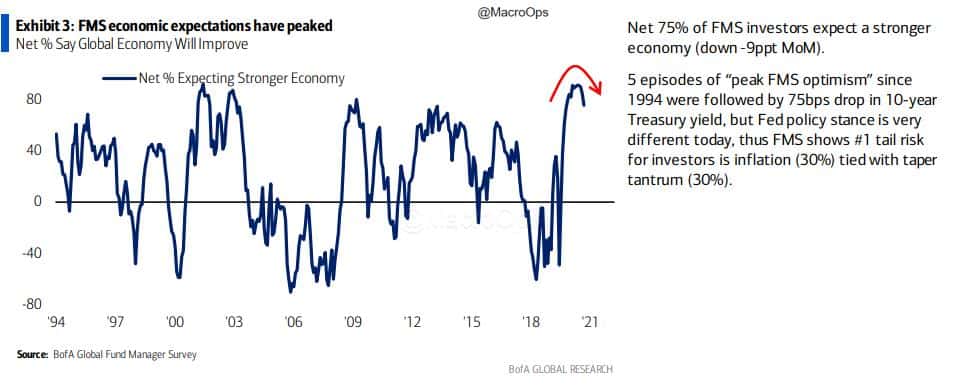
- Economic expectations have peaked… BoFAML notes that “5 episodes of ‘peak FMS optimism’ since 1994 were followed by 75bps drop in 10-year Treasury yield”.
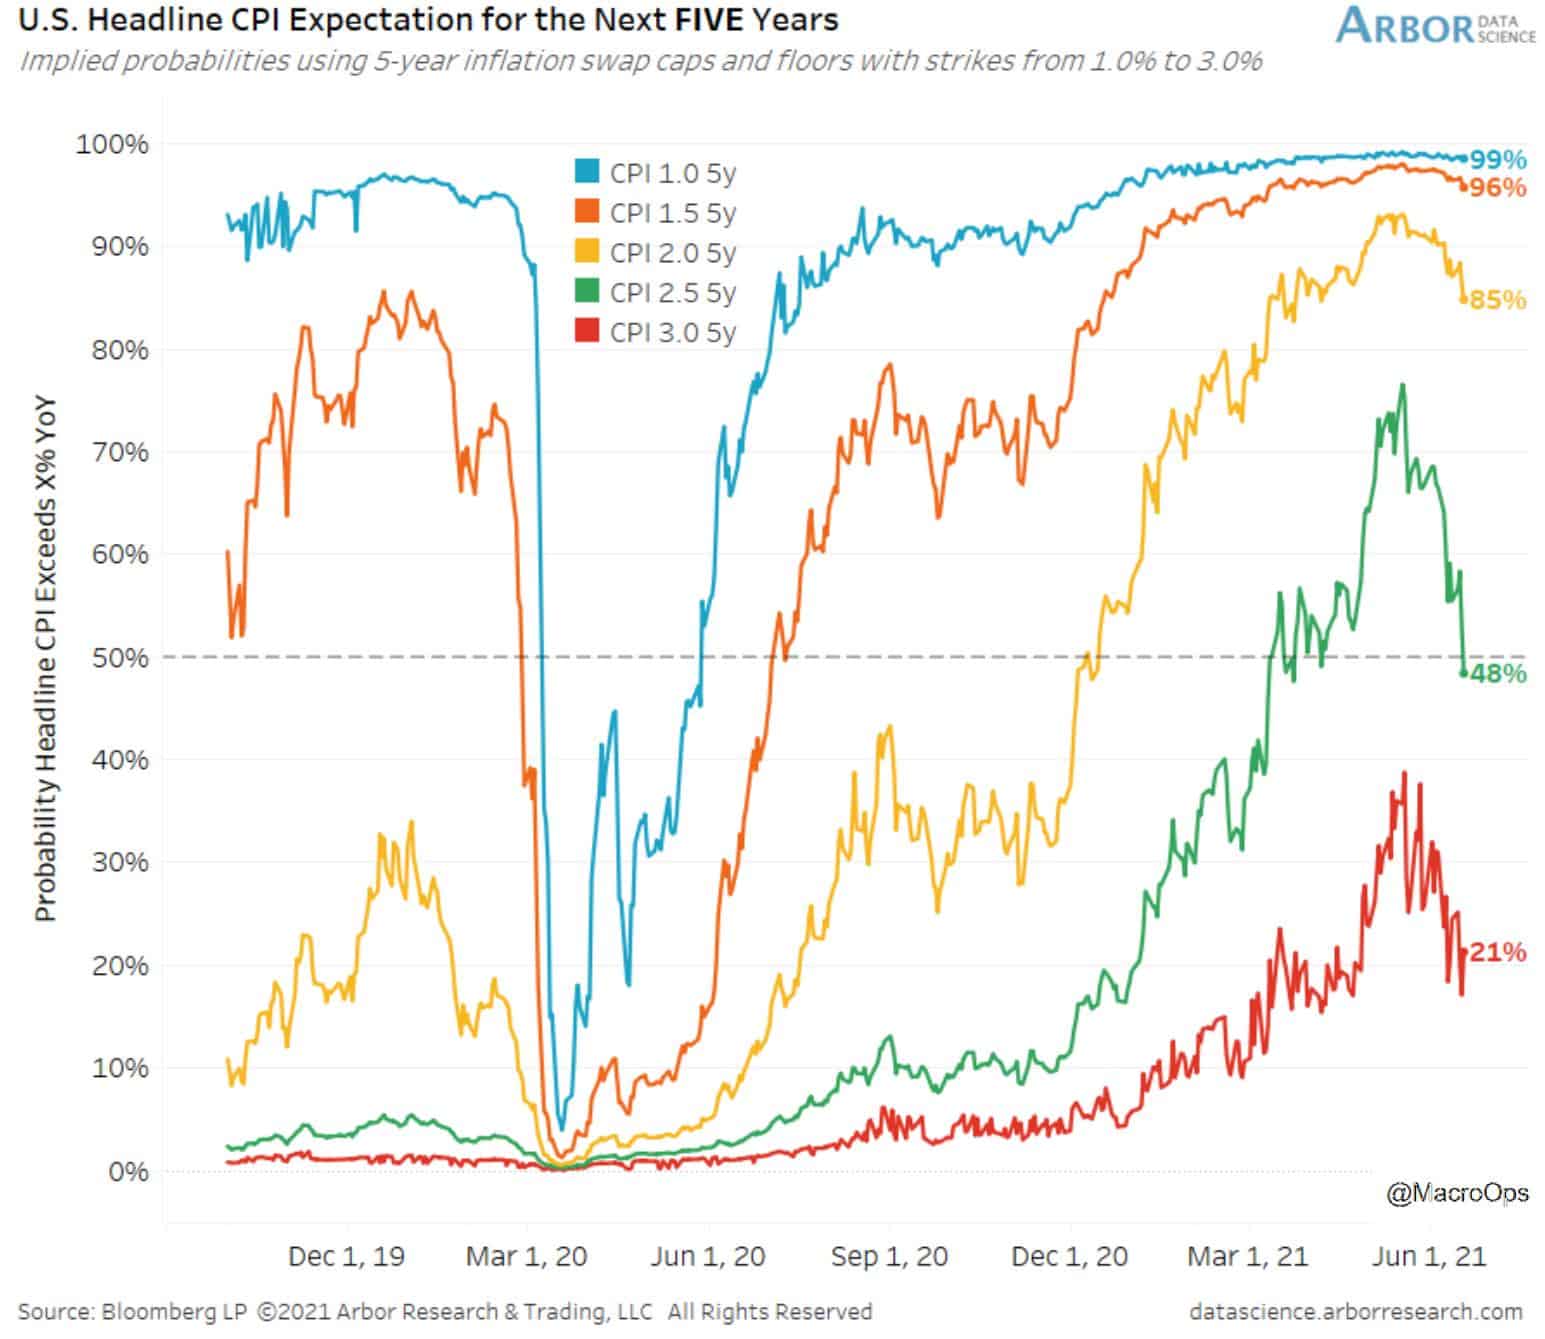
- @benbreitholtz shared the following chart, tweeting “investors beginning to price OUT headline CPI above 2.5% YoY. Inflation swap caps/floors back to sub-50% probabilities for next 5-30 years. Many of the previously high-flying commodities rolling over in unison. Investors seeminly buying into the ‘transitory’ mantra.”
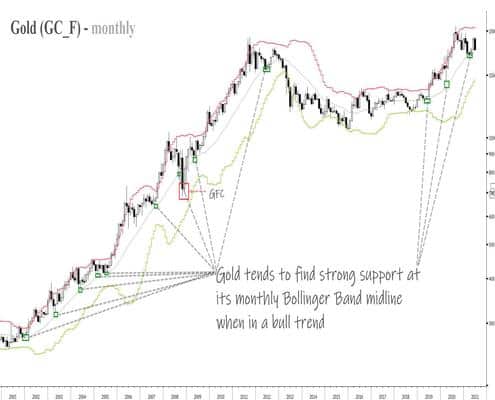
- Gold is at a major technical inflection point. The fundamental bull case is as strong as ever but gold needs to hold its current price range or else the odds rise it’ll see another couple months of chop and vol.
The chart below is from a Collective report that went out over the weekend. It shows that gold tends to respect its BB midline when in a bull market. This week will be telling.

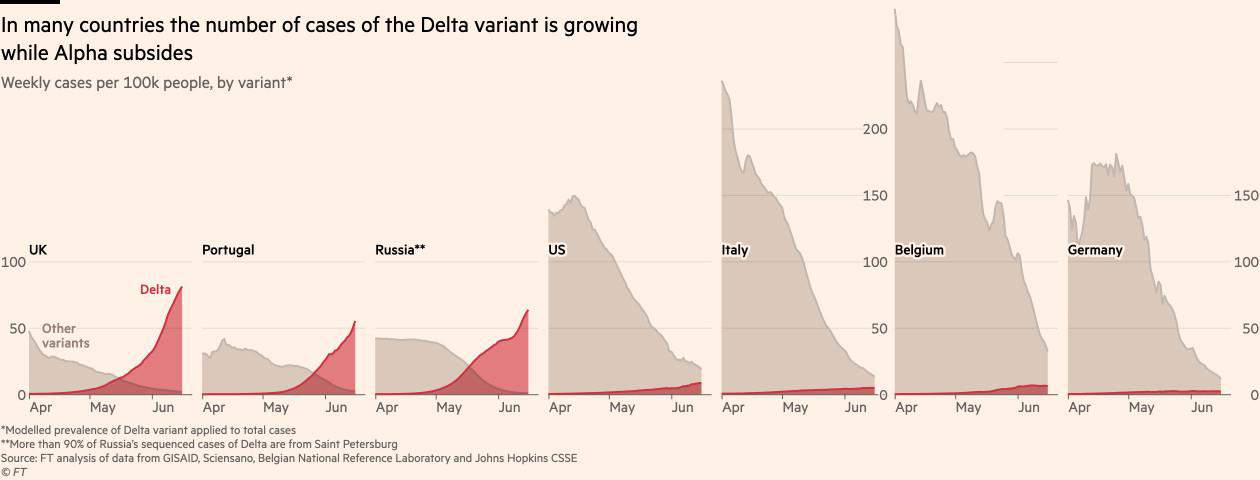
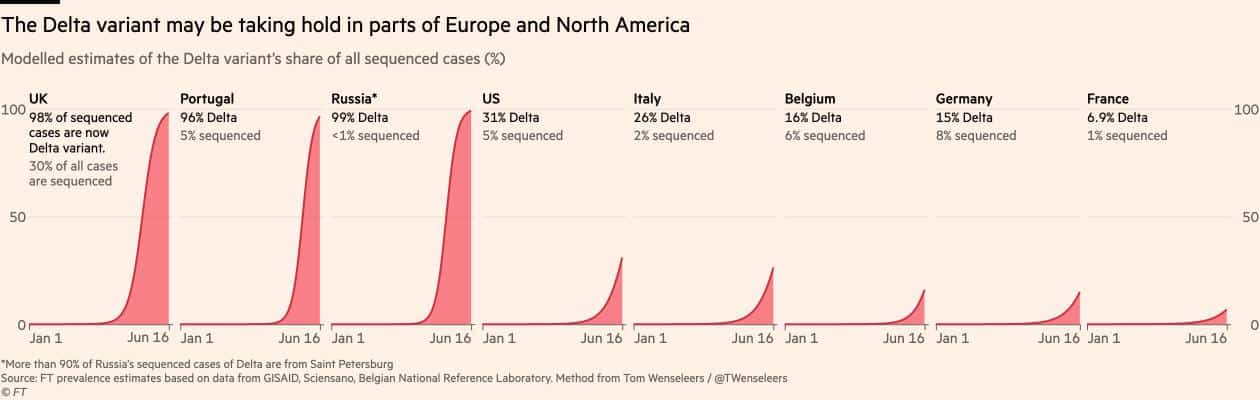
- The Delta variant, a particularly virulent form of COVID, is starting to sweep across the world.
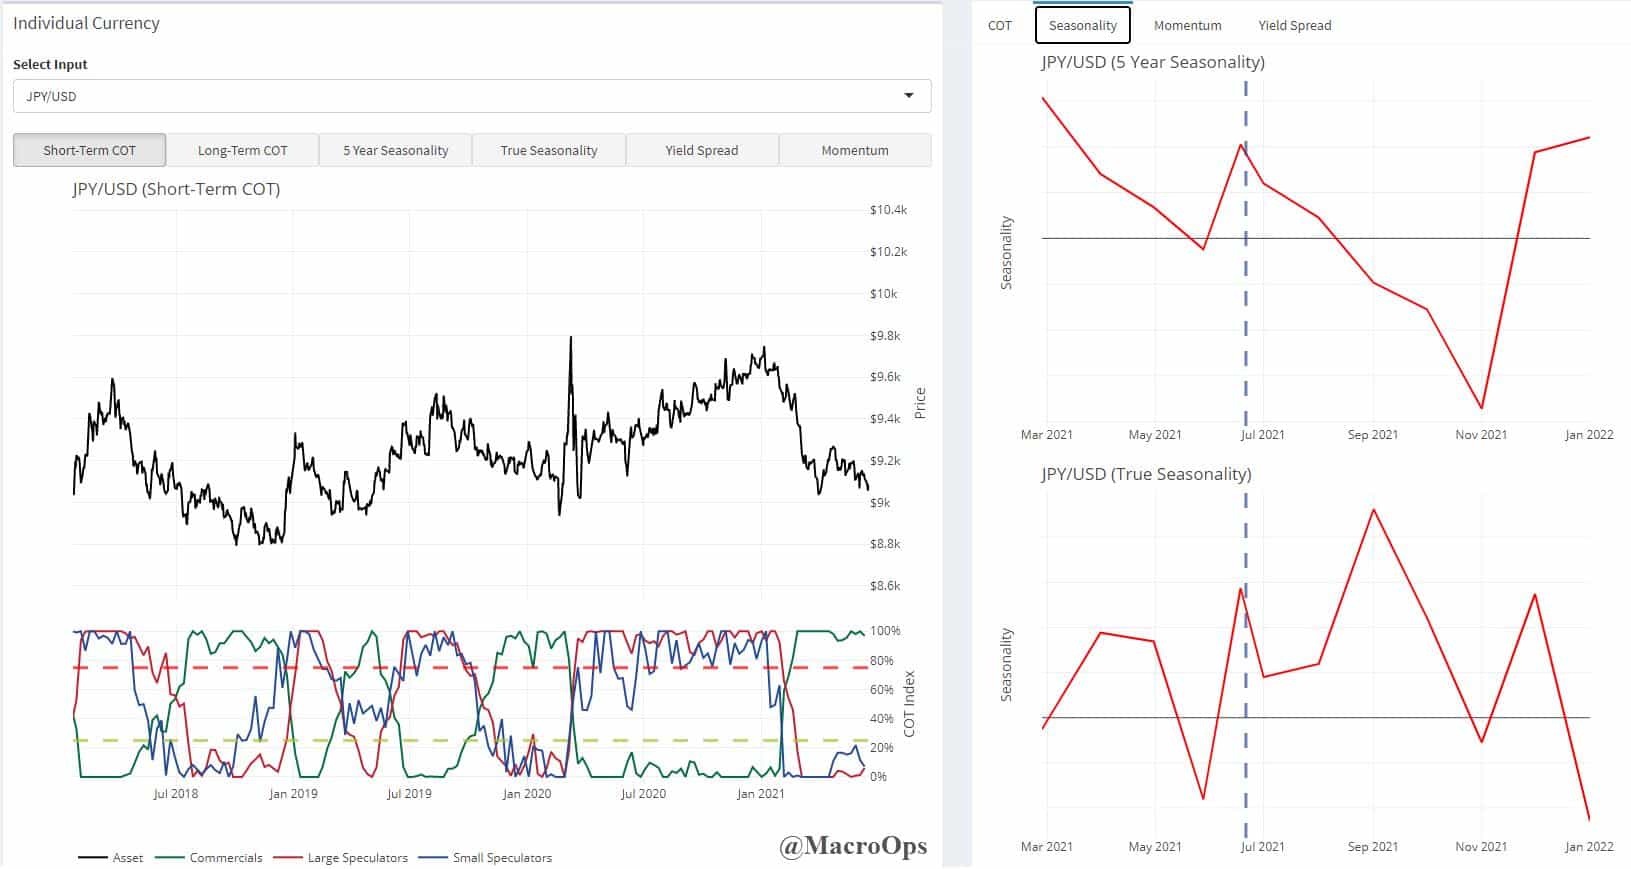
- Japanese yen (JPY) looks interesting for a long here. Our CoT oscillator shows short-term positioning and seasonality (both 5 and 30-year) are favorable.
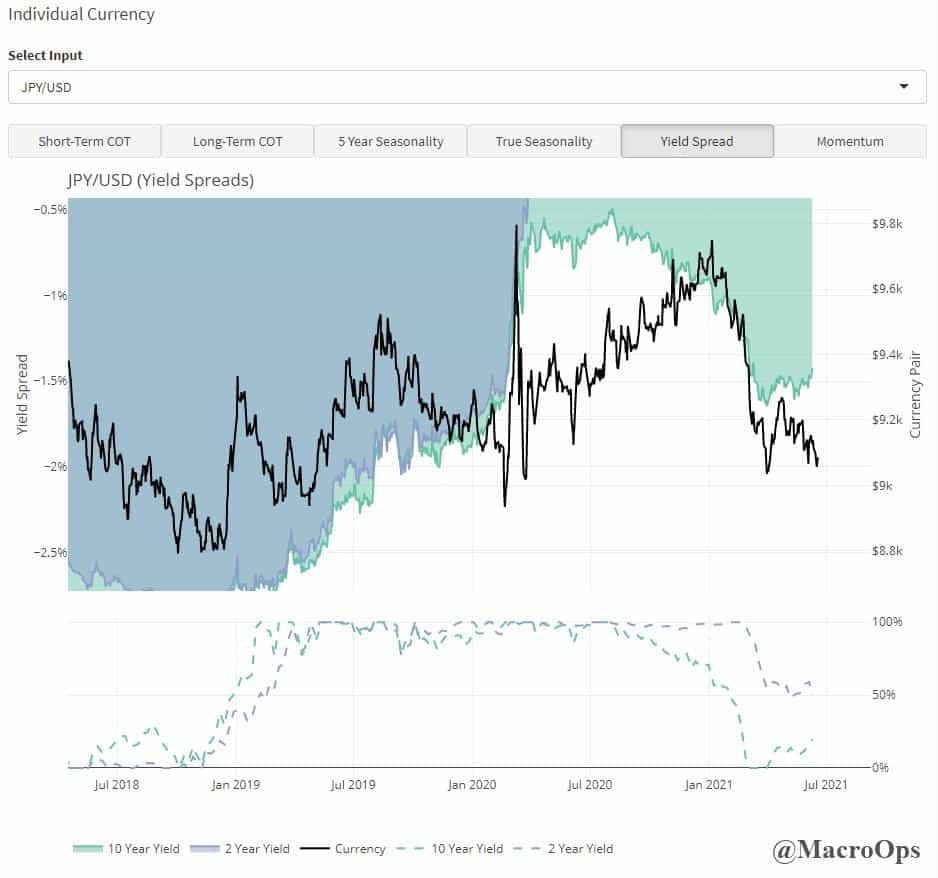
- 11. While JPYUSD 10-year differentials are beginning to move in the yen’s favor.
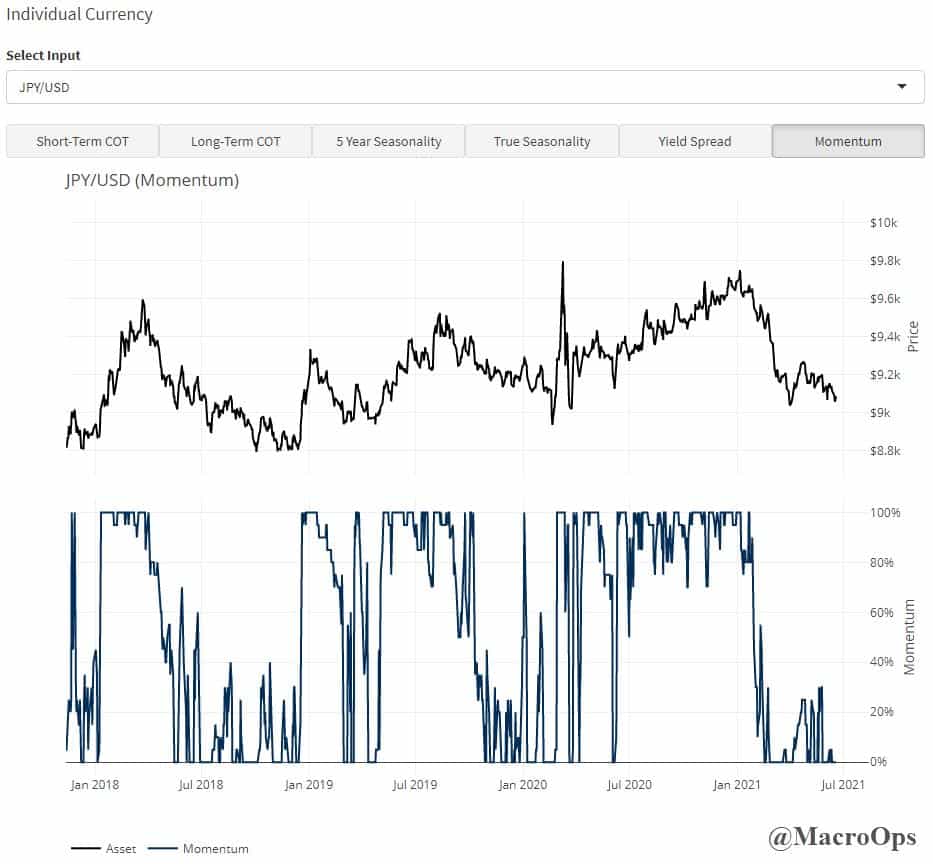
- Momentum has bottomed out and the chart shows a potential double bottom in place.
I wouldn’t play it against the dollar, which itself looks set for a sizable position driven bounce. Short EURJPY though has a great chart and the euro has crowded longs to work off.
If you enjoy reading these Dirty Dozens each week then please feel free to share them on the Twitters, forward them to a friend, or translate them via smoke signal… Every bit helps us get our name out there.
Thank you for reading!
Stay safe out there and keep your head on a swivel.