Modern economists do not get their rewards and awards for being preoccupied with energy, and modern societies become concerned about it only when the supply of any main commercial form of energy appears to be threatened and its prices soar. ~ Vaclav Smil, How The World Really Works
In this week’s Dirty Dozen [CHART PACK] we talk crude’s bullish breakouts, Nikkei’s nice pullback, weakening labor force trends, rate cut cycle dynamics, a bullish pitch for a tin producer, and more…
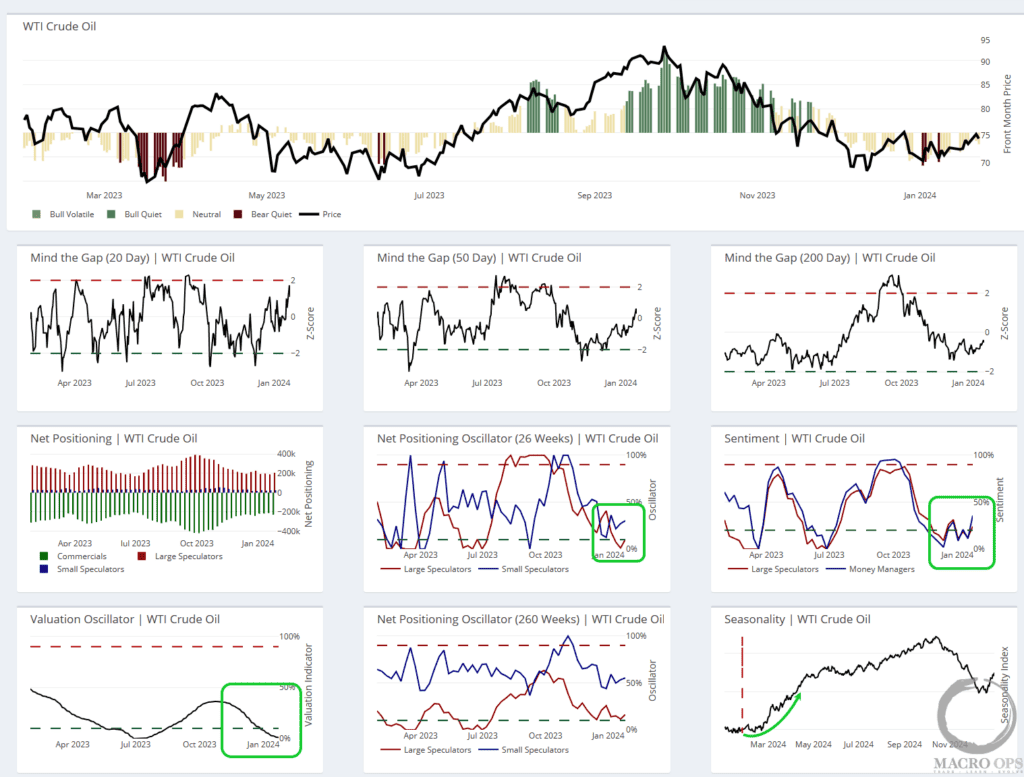
1. We got the bullish breakout in crude that we said was coming two weeks ago (link here).
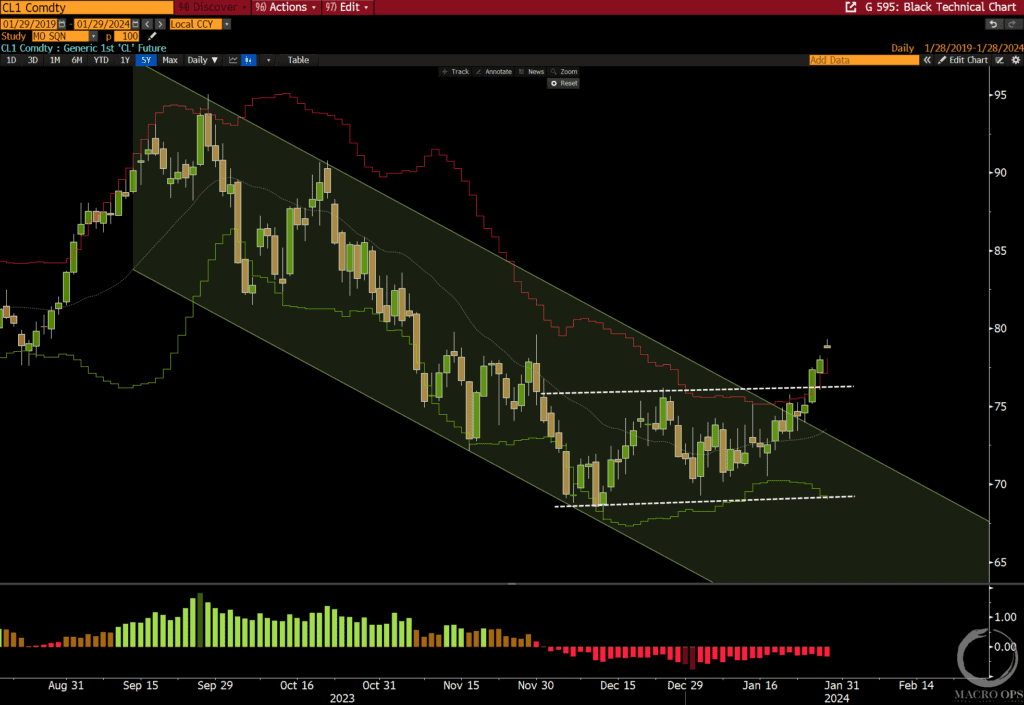
2. This is a Trifecta setup trade with macro, techncials, and sentiment/positioning tilting the odds in favor of further upside. Positioning is at bearish extremes… our guage of Money Manager sentiment is inthe 0th percentile (crude sees avg annual returns of 16% when sentiment falls < 10%). Valuation is in bottom percentile, and seasonality is about to strongly pick up.
Plus, the deteriorating situation in the ME raises the odds of a right tail event driving crude prices significantly higher.
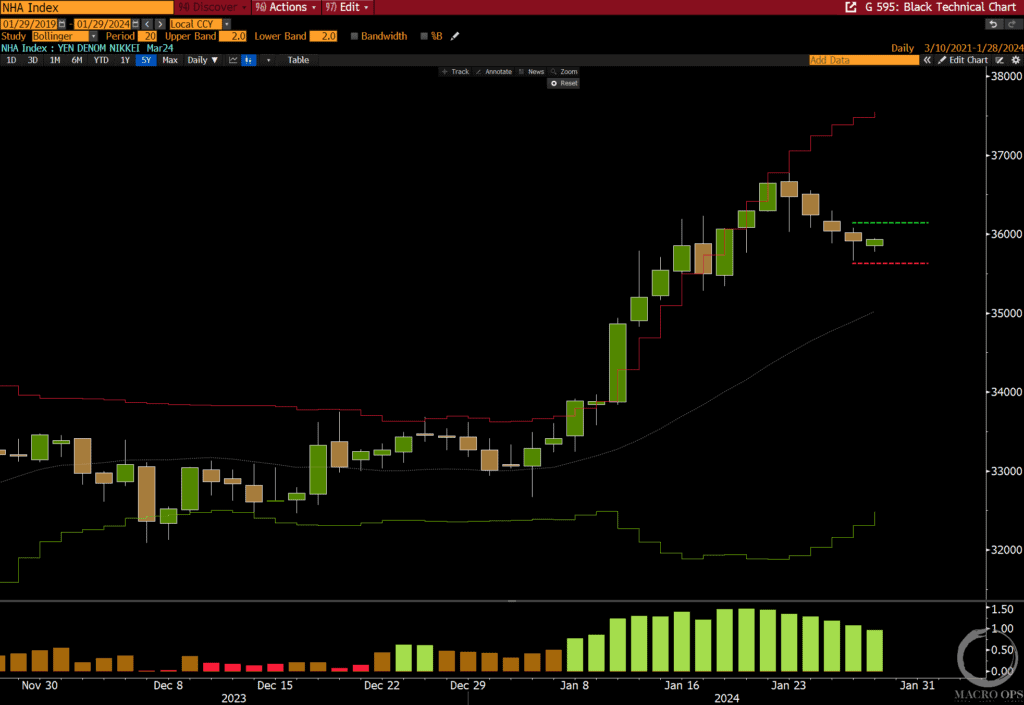
3. The Nikkei 225 (yen contract) is putting in a nice orderly pullback towards its Bollinger Band midline. This gives us a good spot to put in a buy stop above Friday’s highs allowing us to pyramid onto our position (disc: we’re long).
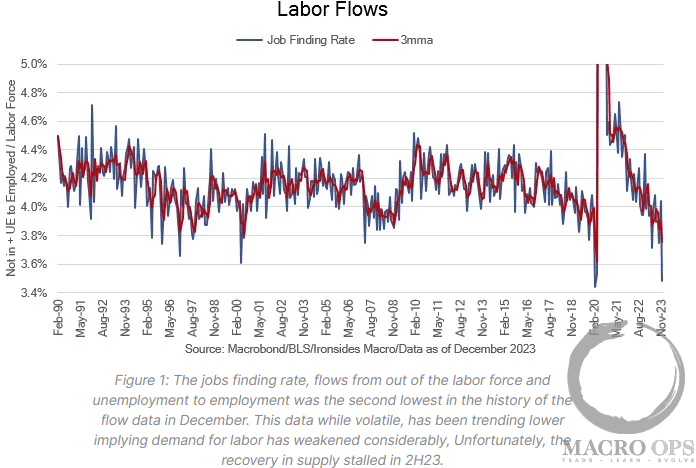
4. This Labor Flows chart from Ironside Macro shows that the job finding rate (flows from unemployment to employment) were the “second lowest in the history of the flow data in December.” If you dig beneath the surface of the headline employment figures, you quickly find that current labor market trends are not as rosy as many think. More on this soon…
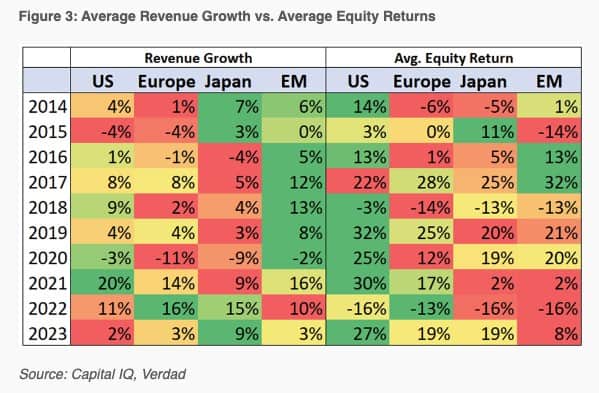
5. From Brandon Beylo (Macro Ops Value): Dan Rasmussen of Verdad Capital measured annual equity returns against a region’s average annual revenue growth. The basic idea is that, all else equal, countries with higher average revenue growths should generate higher average returns. But according to Dan’s data, that is not always the case (emphasis mine):
“What’s perhaps most interesting is that regressing relative equity returns against relative revenue growth had no statistical significance. The fastest-growing equity markets did not concurrently earn the highest equity returns within each year … There does not appear to be a strong year-to-year relationship between growth and equity returns. That is because prices are forward looking. To successfully bet on high revenue growth, one would need to accurately project this high relative growth over the course of multiple years into the future (e.g., predicting that the US would have the highest revenue growth over the next decade, starting in 2014).”
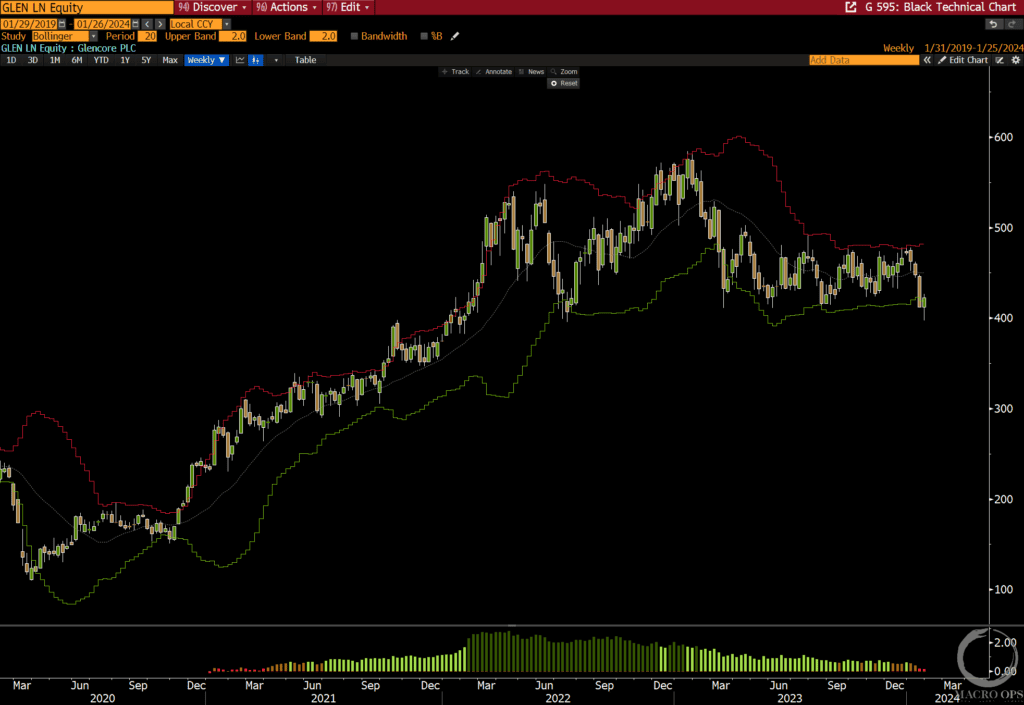
6. From Brandon Beylo (Macro Ops Value): GLEN, like any mining producer/marketer, is a leveraged play on underlying commodity prices, specifically copper and coal. If you believe copper prices will be higher in 18-24 months than they are today, GLEN is very cheap. They trade at ~5x NTM EBITDA with a ~19% Shareholder Yield (dividends + buybacks + debt paydown).
The stock traded lower with ADM’s accounting scandal. But it looks like we’ll get a failed breakdown close on the weekly chart. This is a great spot to take a swing at the 800lb mining giant with decent size and low risk (chart is a weekly)
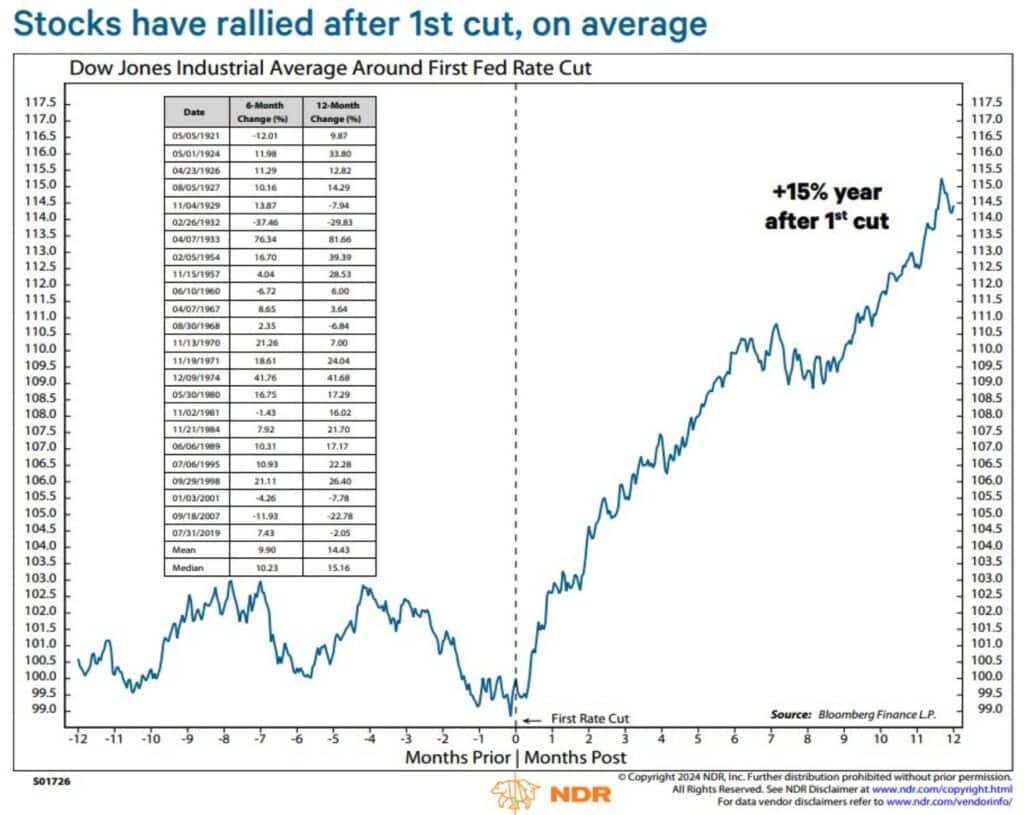
7. From Octavio (Macro Ops Quant): The stock market averages +15% returns 12m following the first rate cut. Chart via NDR’s @edclissold.
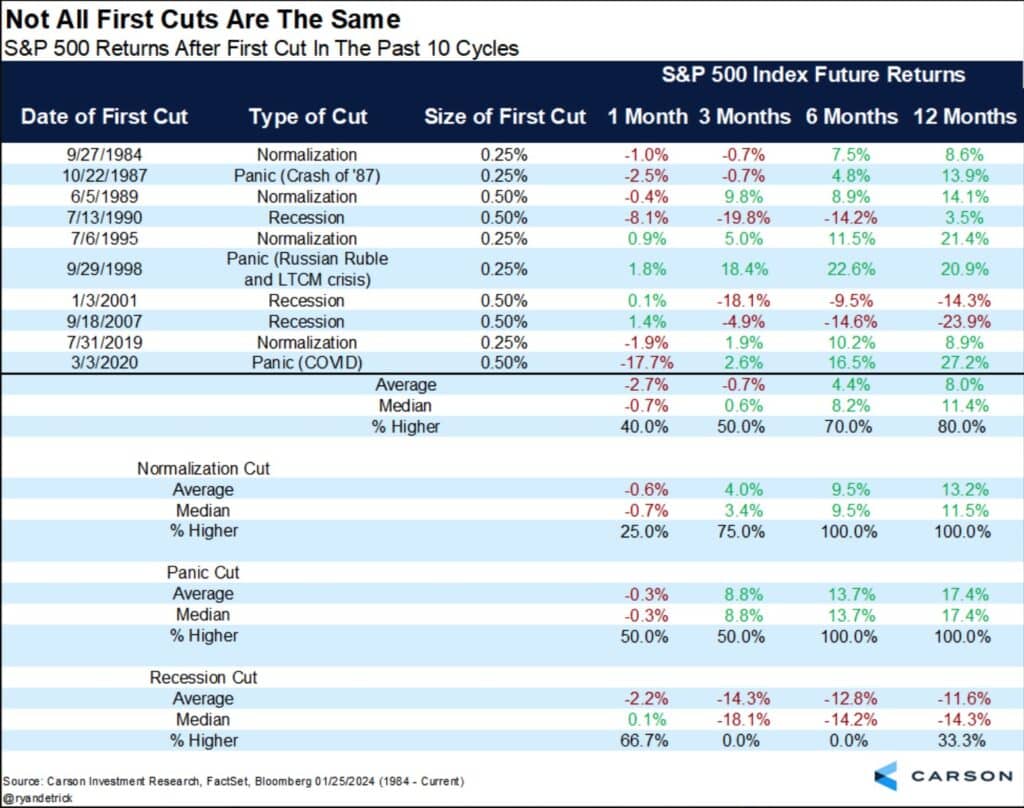
8. From Octavio (Macro Ops Quant): But not all cuts are the same… It depends on the context and what type of cut it is. Lowering rates during normalization = market up an avg +13%, recession cut = down -11%, and a panic cut = +17%. Stats and graph via @RyanDetrick.
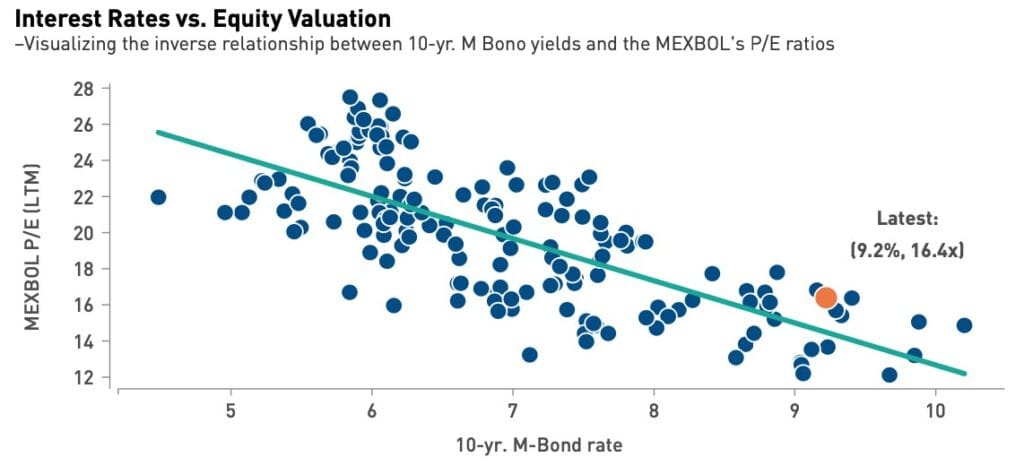
9. From Octavio (Macro Ops Quant): We see similar behavior in other equities market. In the last 3 rate cutting cycles, Mexico has seen average returns of +18% 12m later and +44% two years following the first cut. This current cycle could trigger multiple expansion and return to its long term average multiple. (Source GBM).
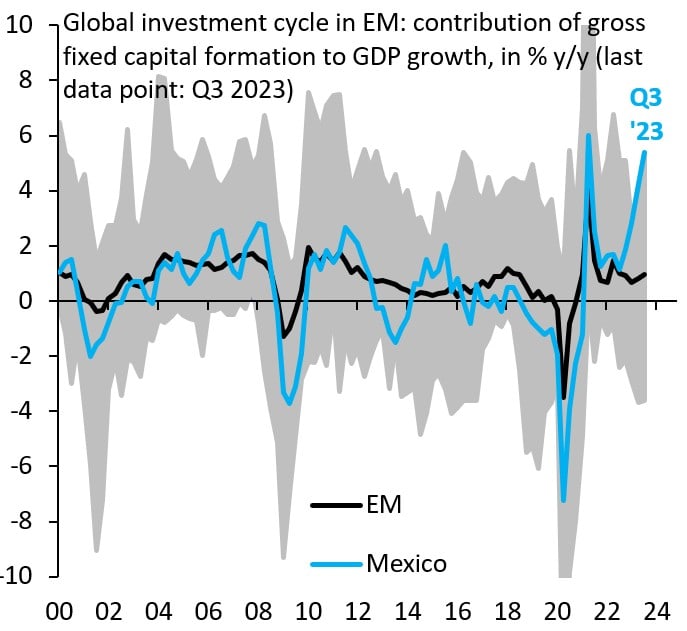
10. So many reasons we continue to be big Mexico bulls. Here’s one more from @RobinBrooksIIF “Mexico is currently seeing an investment boom of unprecedented size. Prior to COVID, Mexico was in a growth and investment slump, but that is clearly over. Across the entire EM universe (grey), Mexico currently has the largest growth contribution to GDP from capital formation…”
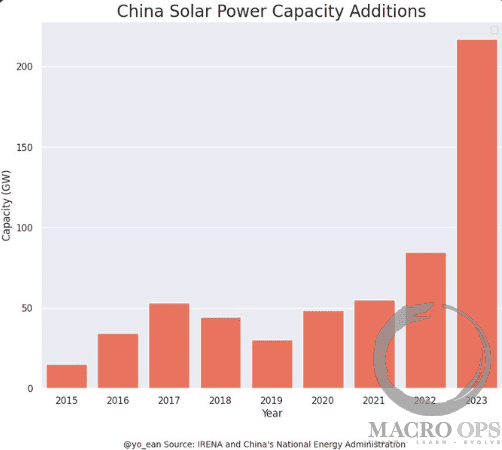
11. We at MO are big tin bulls and think this overlooked metal used in semis, solar arrays, chemical production, etc… is entering what will be massive multi-year bull market.
Some notable recent stats: Last year China added more solar power capacity in 2023 than the entire world did in 22’ and more than the US has added in its entire history. Solar panels were once only a fraction of tin demand but are expected to grow to make up nearly 20% of global demand over the coming decade.
Your can read our primer on the Tin market here.
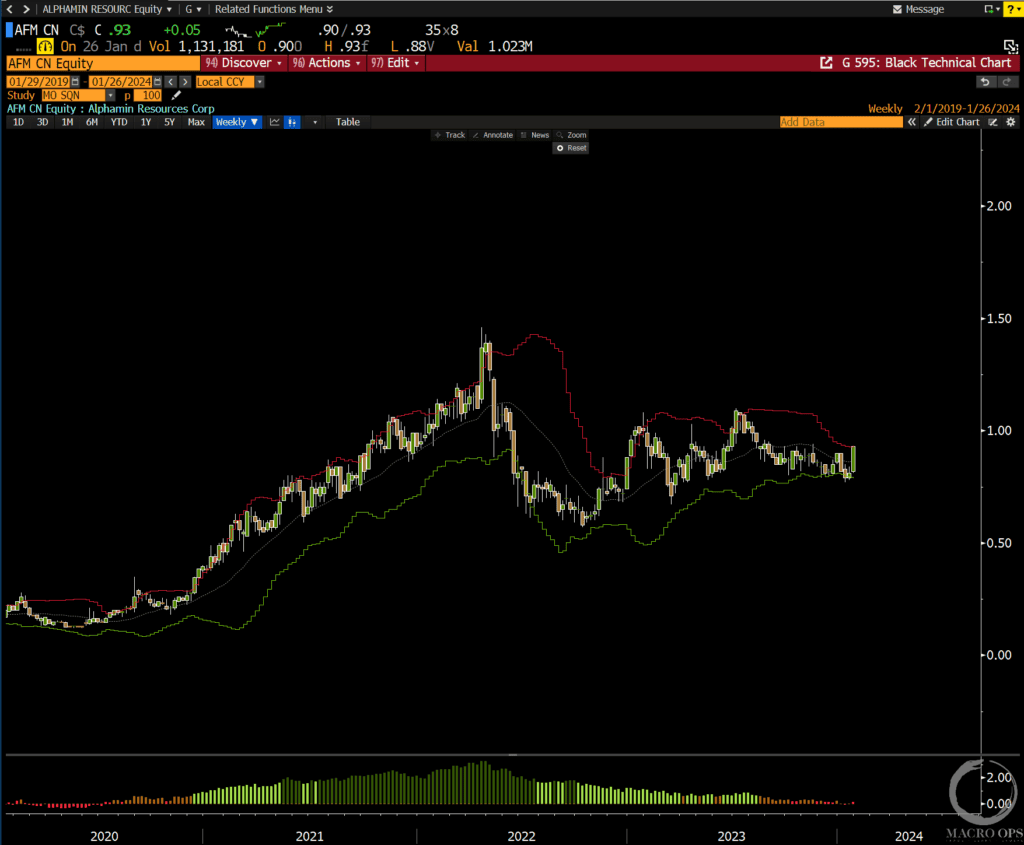
12. Our favorite name to play this theme is tin producer Alphamin Resources (AFM:TSX), which currently trades at 3.5x NTM EV/EBITDA. Chart below is a weekly (disclosure: we’re long).
Thanks for reading.