Today we’ve got a guest post from Srivatsan “Sri” Prakash. Sri is an analyst at Simplify Asset Management and hosts the Market Champions podcast dedicated to interviewing the best and the brightest in finance and economics. Check him out on Twitter @SrivatsPrakash.
There are two things everyone’s talking about today:
- Is the US in a recession?
- And what bodes ahead for inflation?
It is important to note a lot of the core figures, which are helpful to look at in this environment, considering they’re typically net of energy+food prices. Let’s get to that in a minute.
A lot of the blame for the inflation we observe in the current environment is placed on the backs of supply chains and commodity price gains (aggravated by the Russia-Ukraine crisis).
Is the entire story just the war and supply chains?
The Demand Story
Broadly no. Some of it has undoubtedly been caused by above trend consumer spending. This is partly explained by the pent-up demand dynamic along with stimulus checks (remember that savings rates were elevated going into the pandemic).
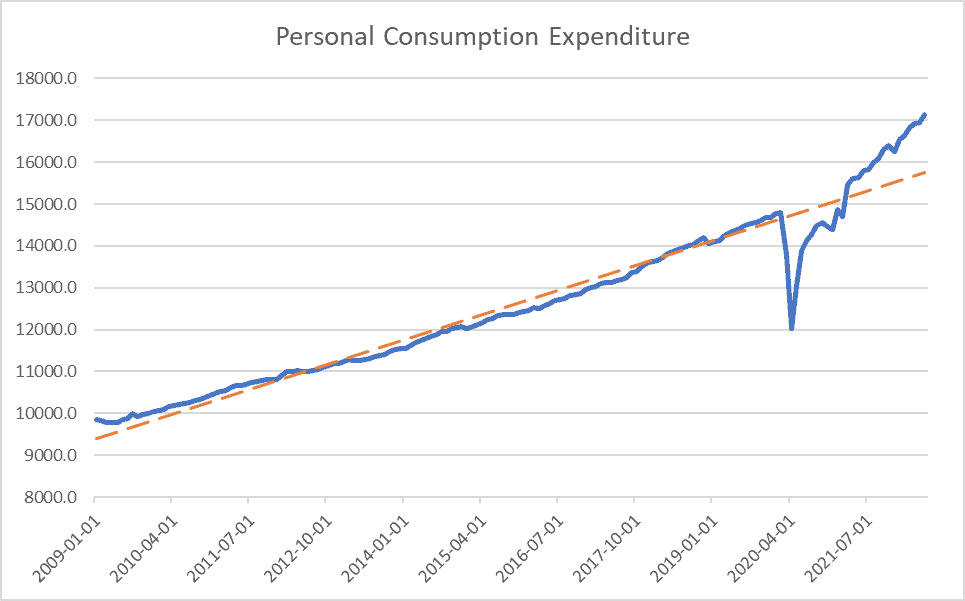
(As a disclaimer, the above chart does not imply mean reversion and intends to show that expenditures are much higher than the post-GFC trend).
A lot of this was simply spending on durables – which are one-time purchases. If you buy a washing machine, that is a one-time purchase. You will likely not buy another washing machine for the next few years. The demand increases aren’t secular or sustained in a way similar to the 1970s. I discuss why the 1970s aren’t a good comparison to what we’re seeing here. We’re not seeing a secular shift in demographics as we observed in the 1970s.
The way the current environment HAS been bearish for bonds has been a combination of more robust demand, tighter labor, supply chains breaking down, the Fed being extremely hawkish, as well as the supply issues in commodities, aggravated by the war in Russia/Ukraine.
The Core vs. Broad CPI Divergence
But we can broadly group the “demand” based inflation into core-CPI and the war-driven higher energy/food prices into the broader CPI (including food and energy). This is obviously imperfect, but it helps make the point.
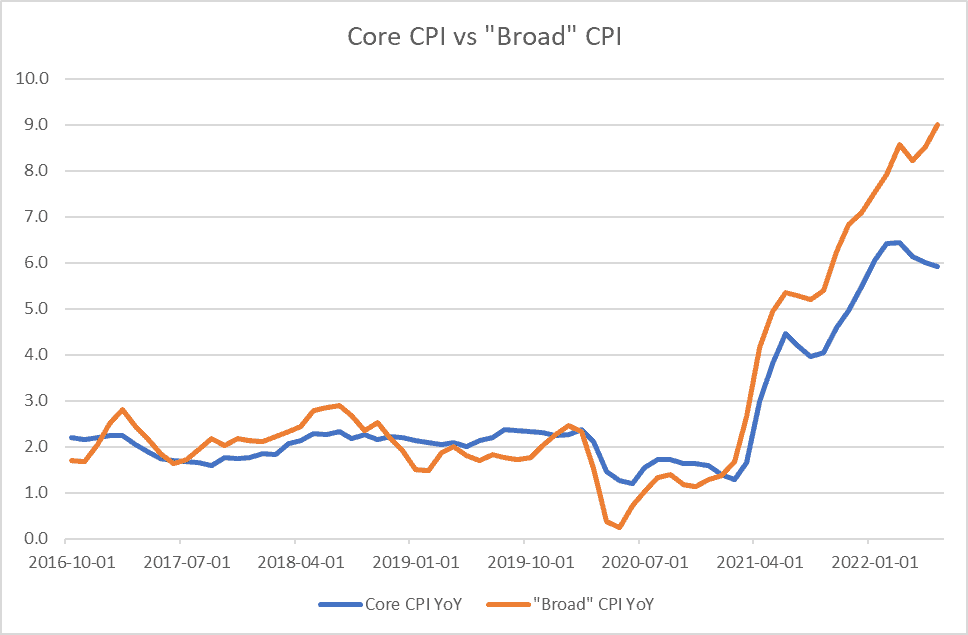
We can see that core CPI has started to go lower over the last few prints, especially since May, while the broader CPI (including food and energy prices, directly impacted by chronic underinvestment and the war) has continued to head higher.
Where it gets interesting is a lot of economic data has begun to look weak. Buyer optimism on the U. Michigan consumer survey has plummeted. A lot of soft consumer data in general. Meanwhile, the Fed manufacturing surveys show the dissipation of supply chain issues.
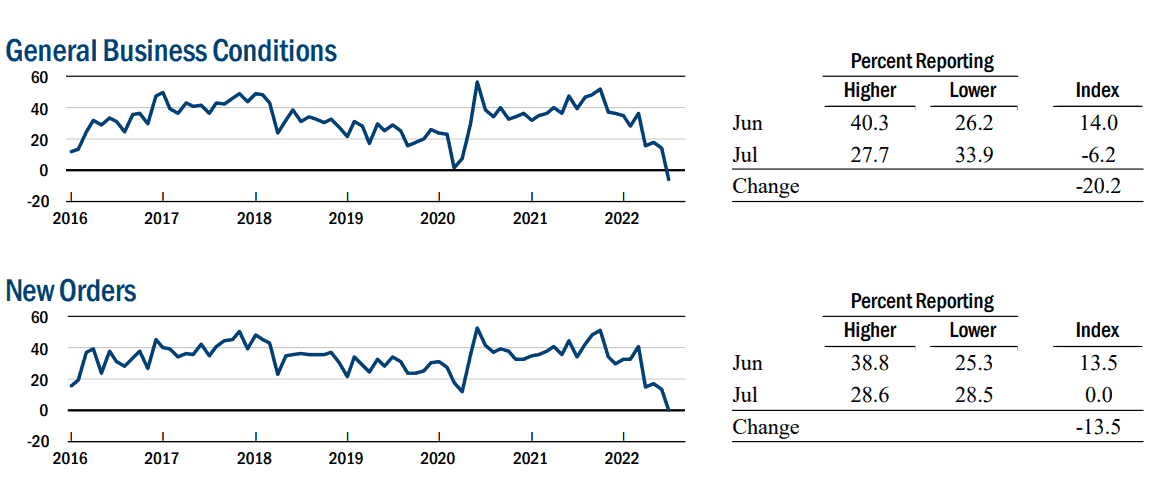
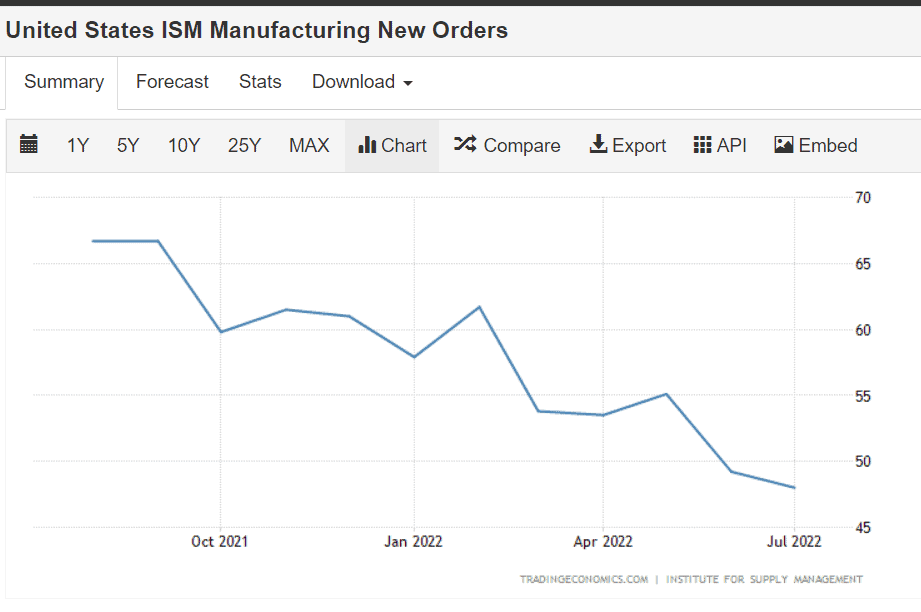
We see prices paid, and expectations on prices paid continue to move lower. We also see demand for goods drop as manufacturers’ new orders start moving much lower. Another one is the inverted yield curve which has been an excellent predictor of economic recessions.
Is the economy slowing down?
Various signs point to some amount of economic slowdown. This is from the Expectations section of the Empire State Manufacturing Survey, published monthly by the NY Fed:
Similarly, various PMIs point to the same dynamic:
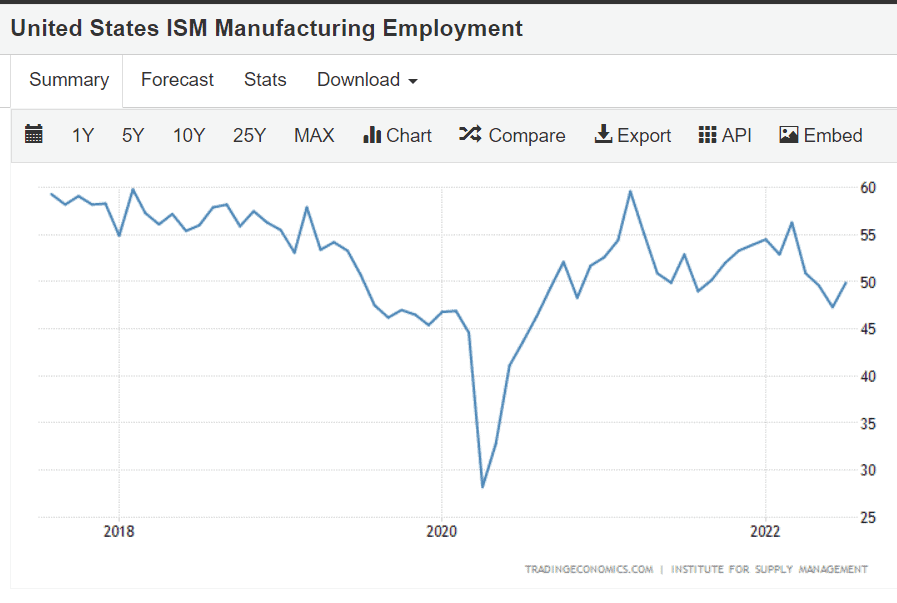
And then when it comes to a tighter labor market – where it’s interesting is one, real wage growth has been negative for a while, and claims are slowly starting to rise upwards.
The ISM Employment PMI strength has been slow as well:
Now, I’m not necessarily arguing that we’re in a recession. After all, even though GDP growth has been negative for 2 consecutive quarters, it’s not officially a recession until the NBER declares it to be one.
Similarly, I recently published a thread showing a massive demand slowdown in the housing market – which you can find here. Where does this lead to?
For the Fed to pivot, they have made it clear that they are willing to risk a recession to bring inflation lower. We’re starting to see core inflation move lower. We’d likely need a few more prints lower before we start to see any reversal in Fed policy (regardless of what happens to growth). Beyond interest rates, their policy of quantitative tightening allows for demand slowdown through the wealth effect that results from lower asset prices.
So how do bonds look here?
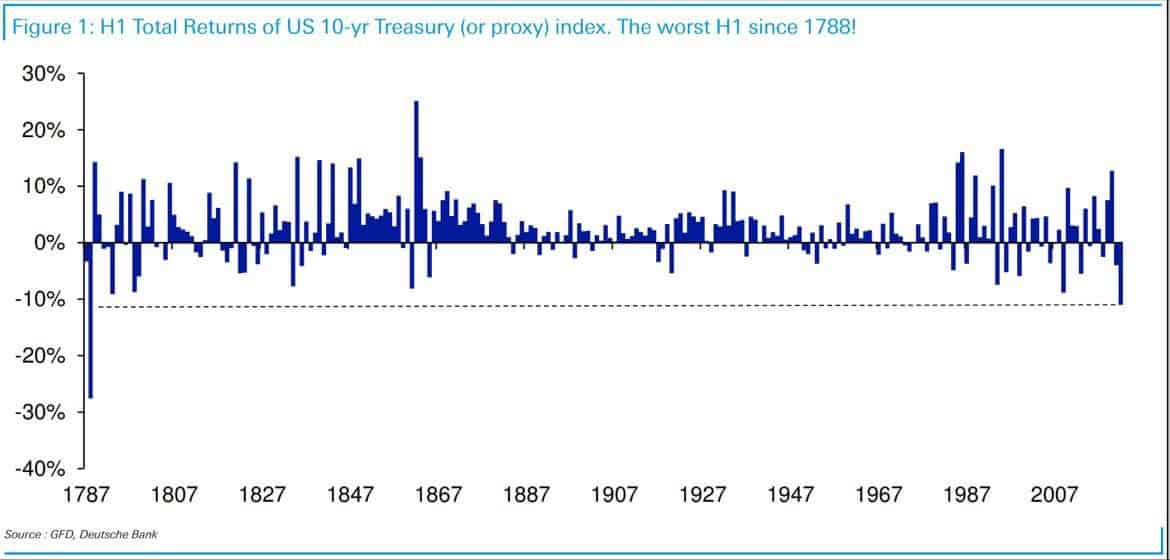
This post was supposed to be about bonds! The long-end is primarily influenced by what happens with regards to long term growth+inflation. They had their worst 6 months return since the time George Washington was President (and that was back in 1788!)
Growth dynamics may start to overtake inflation regarding the core narrative of what’s driving bonds. If core inflation comes back down to 2.5-3%, there is a decent probability the Fed will start to “pivot” and slow down rate hikes. Keep in mind that beyond slowing down inflation, higher interest rates slow down economic growth as well. The Fed has very little power regarding supply issues – the supply of commodities and the underinvestment in energy (among others) cannot be fixed by the Fed raising or lowering interest rates.
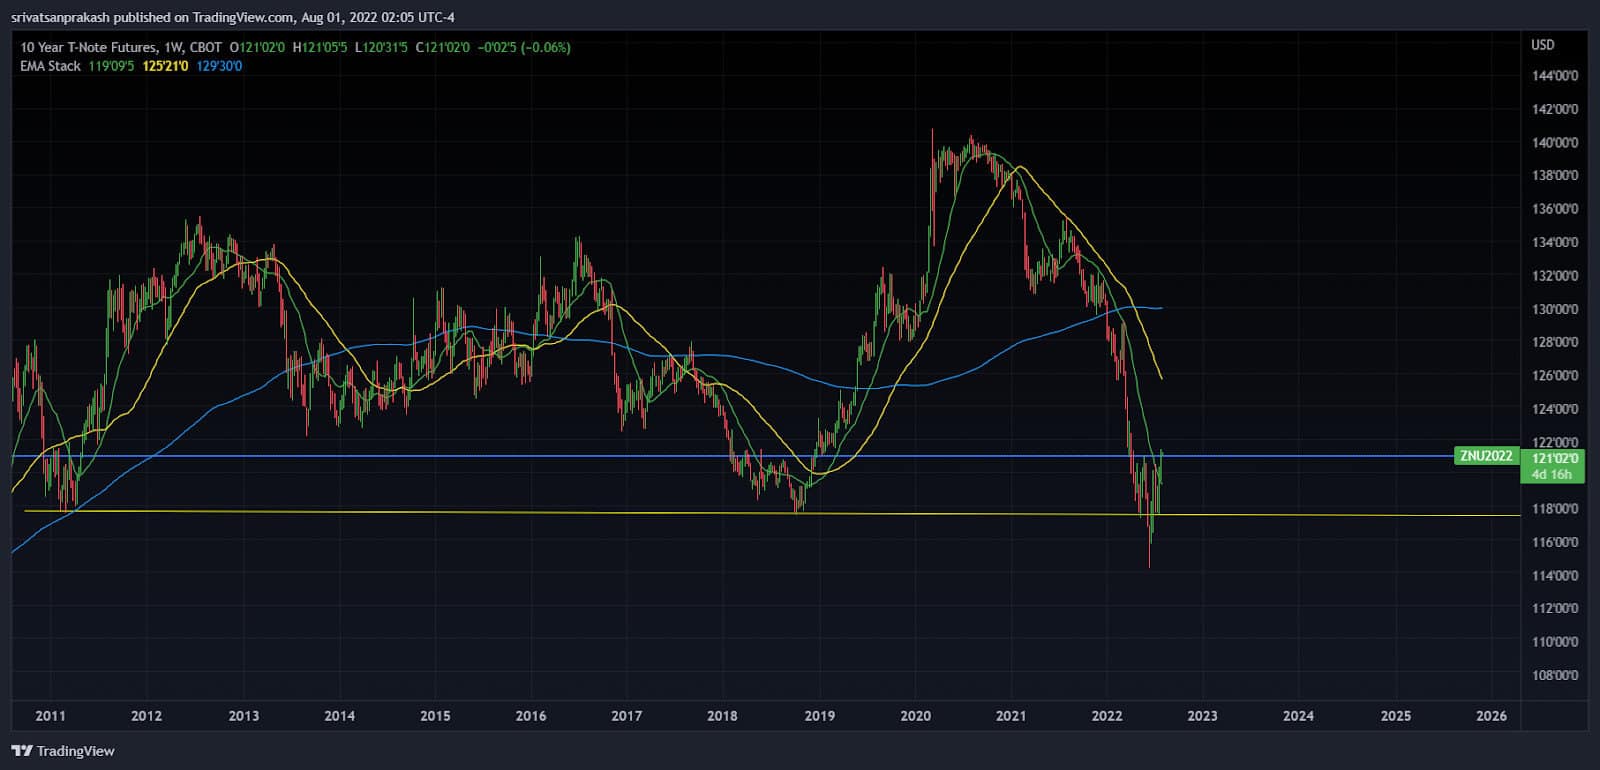
Technically, there is a chance long-end Treasury bonds are putting in some sort of a bottom or base formation here:
So… the US is potentially in a recession, we’re seeing the core PCE numbers come down (the Fed’s favorite numbers), and bonds have had a terrible quarter. What could go wrong with being long?
Well, a lot. As I outlined above, the Fed may not necessarily switch its positioning on inflation. It may take much longer, and the inflation may take a lot longer to dissipate than we viewed.
Also, the potential for a March 2020 type fiasco to occur is relatively high within a QT environment – where we see risk assets AND treasuries sell-off in a rush for dollars. We haven’t observed anything of that sort just yet.
But at this level, a tactical allocation to treasuries may not be the worst idea.
Keep your heads on a swivel,
Sri