There are no limits. There are plateaus, but you must not stay there, you must go beyond them. If it kills you, it kills you. A man must constantly exceed his level. ~ Bruce Lee
In this week’s Dirty Dozen [CHART PACK] we answer the question (probabilistically) of whether this is the start of a major top, which takes us through technicals, internals, breadth, and more… We then end with a look at crude and a probable corrective phase for oil.
1. I’ve received a lot of emails this past week asking my thoughts on whether I thought this was the top. My answer to that question is always “I don’t know but here’s what my framework is telling me…” So I’ll run us through a condensed version of my process here.
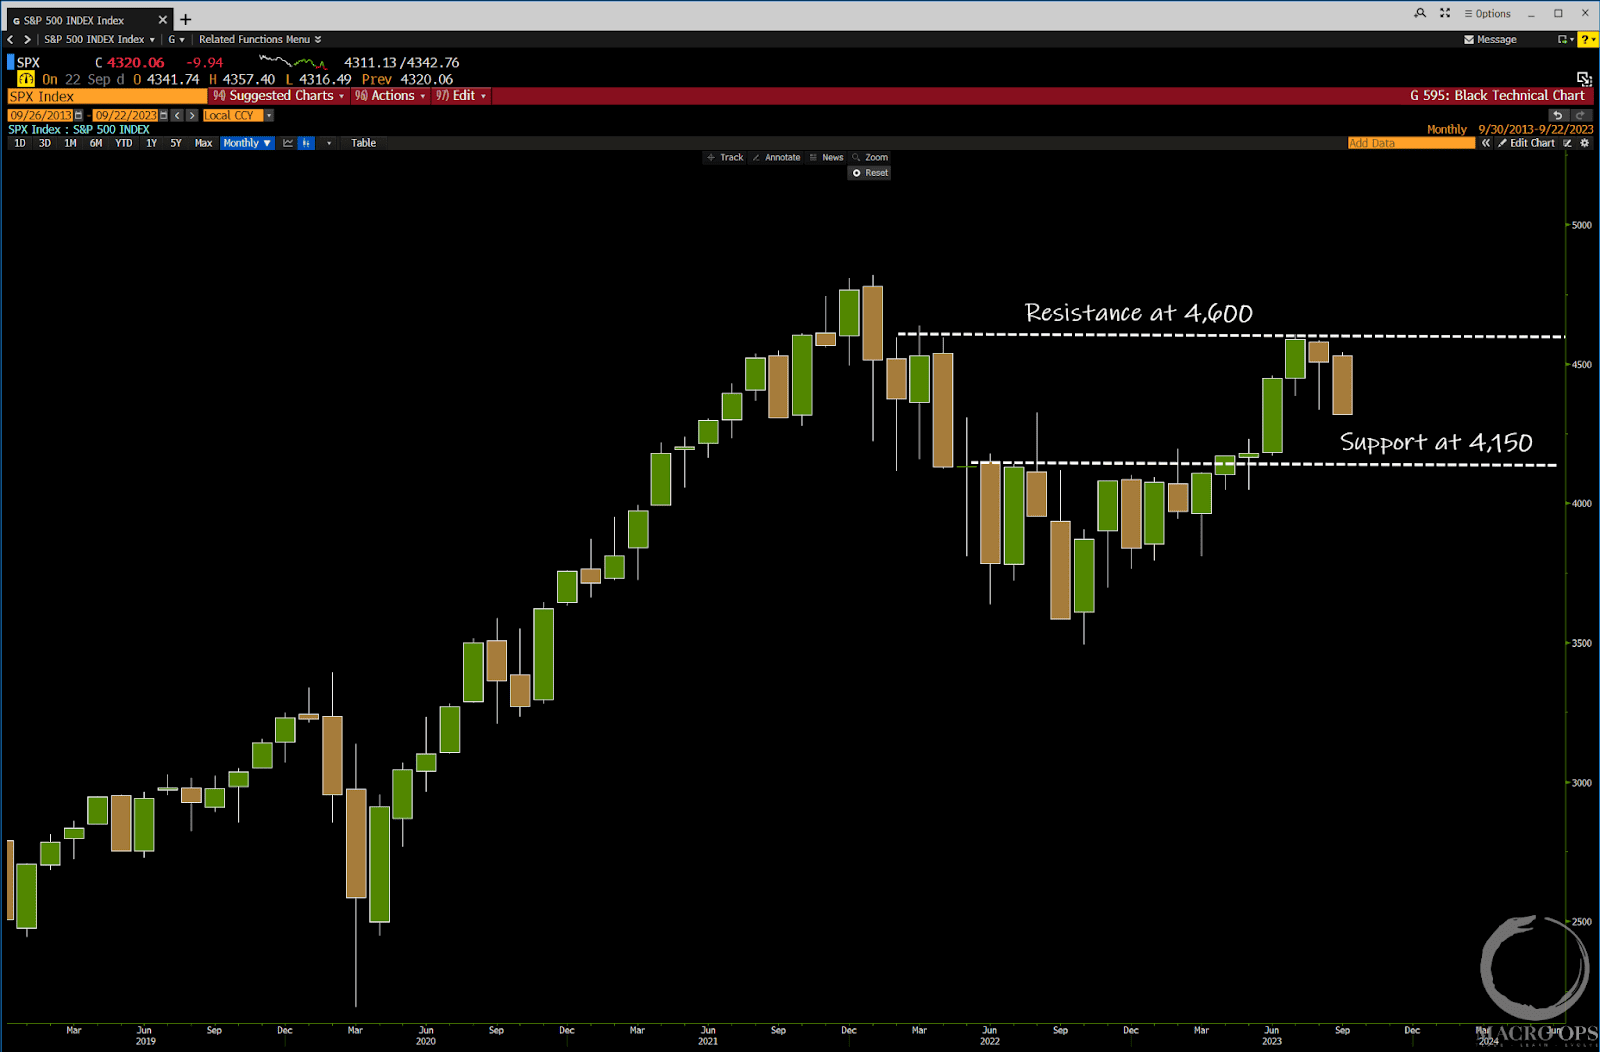
I always start monthly to weekly to daily when looking at charts. Too many people focus on the squiggles at the expense of the long-term direction of trend. This helps prevent that.
The April breakout from the year-long compression range is still good. A monthly close below 4,150 would negate that. It hit resistance at the 4,600 level but its pullback follows five consecutive monthly bull bars, showing strong control from the bulls. As of right now, this pullback is still very much in the realm of a healthy correction following a large bull thrust.
If the SPX trades near the 4,150 level then we’d want to turn considerably more cautious.
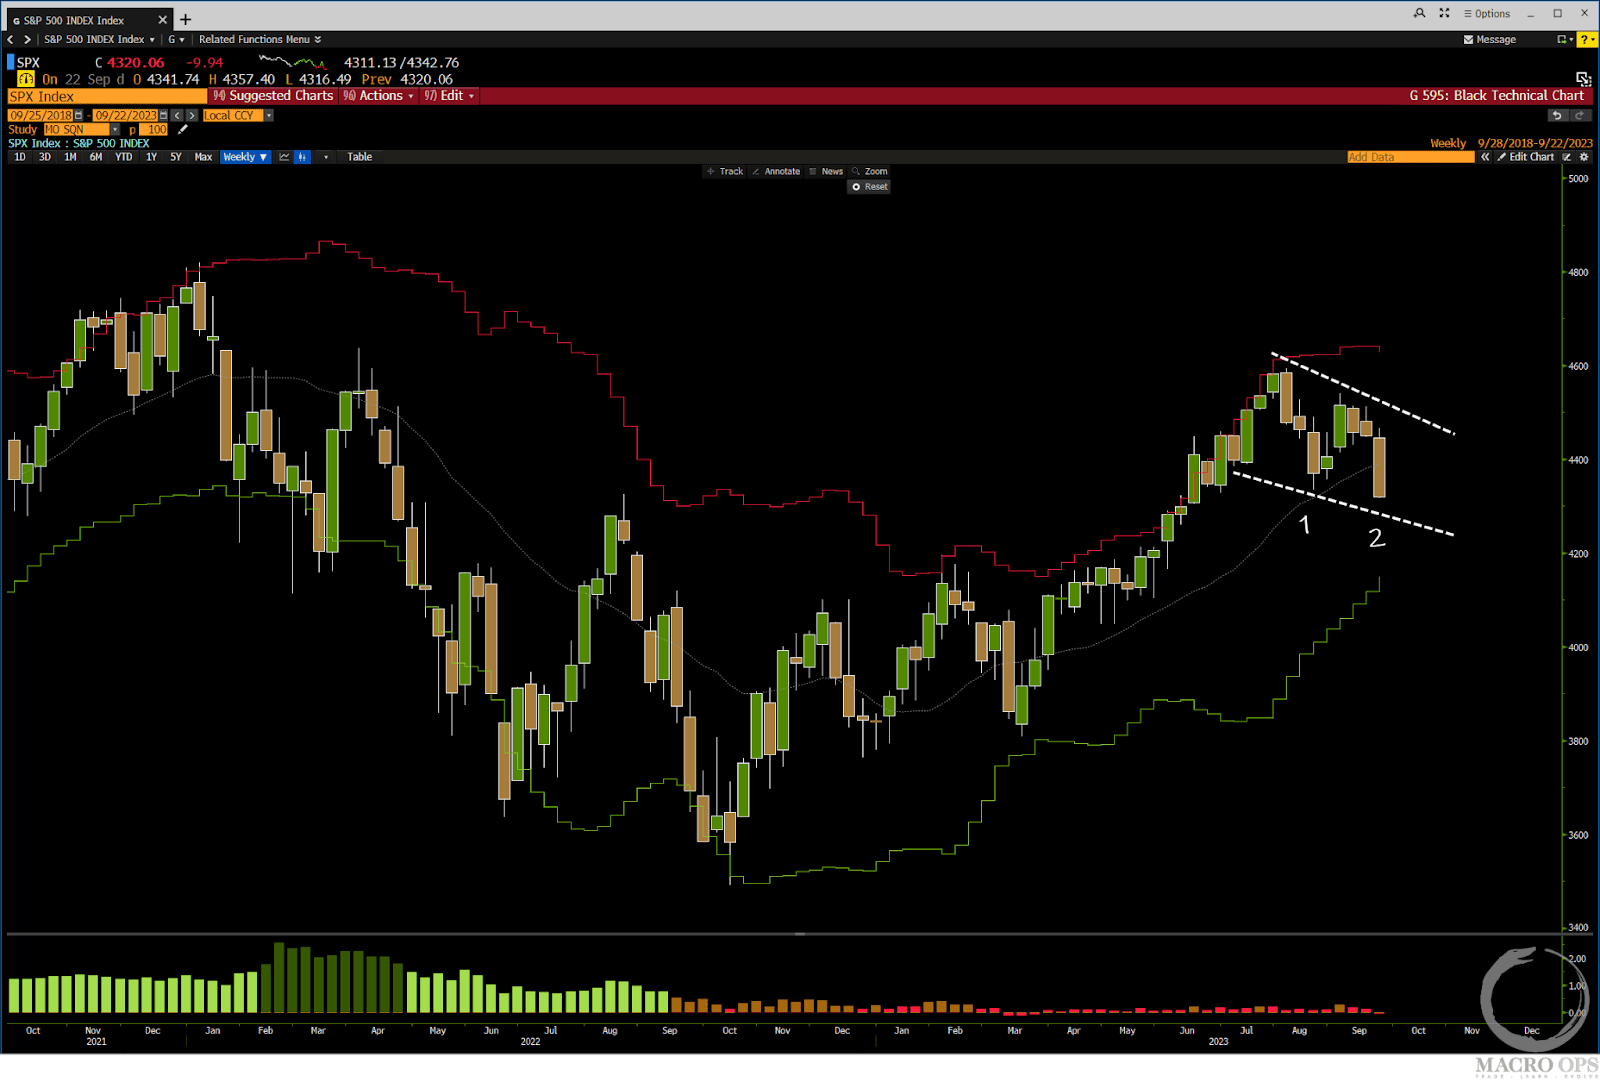
2. The weekly chart looks like it’s putting in a two-legged wedge pattern. This is a continuation pattern and odds favor a reversal at some point near the lower end of this range before another move up.
The daily chart (which I won’t show here) has price on its lower Bollinger Band. It’s likely we see a double bottom before another move higher. If it breaks and holds below its BB then the wedge pattern would be made moot.
3. Market intervals are not diverging lower or even confirming the path lower, which is a good indication for the bulls.
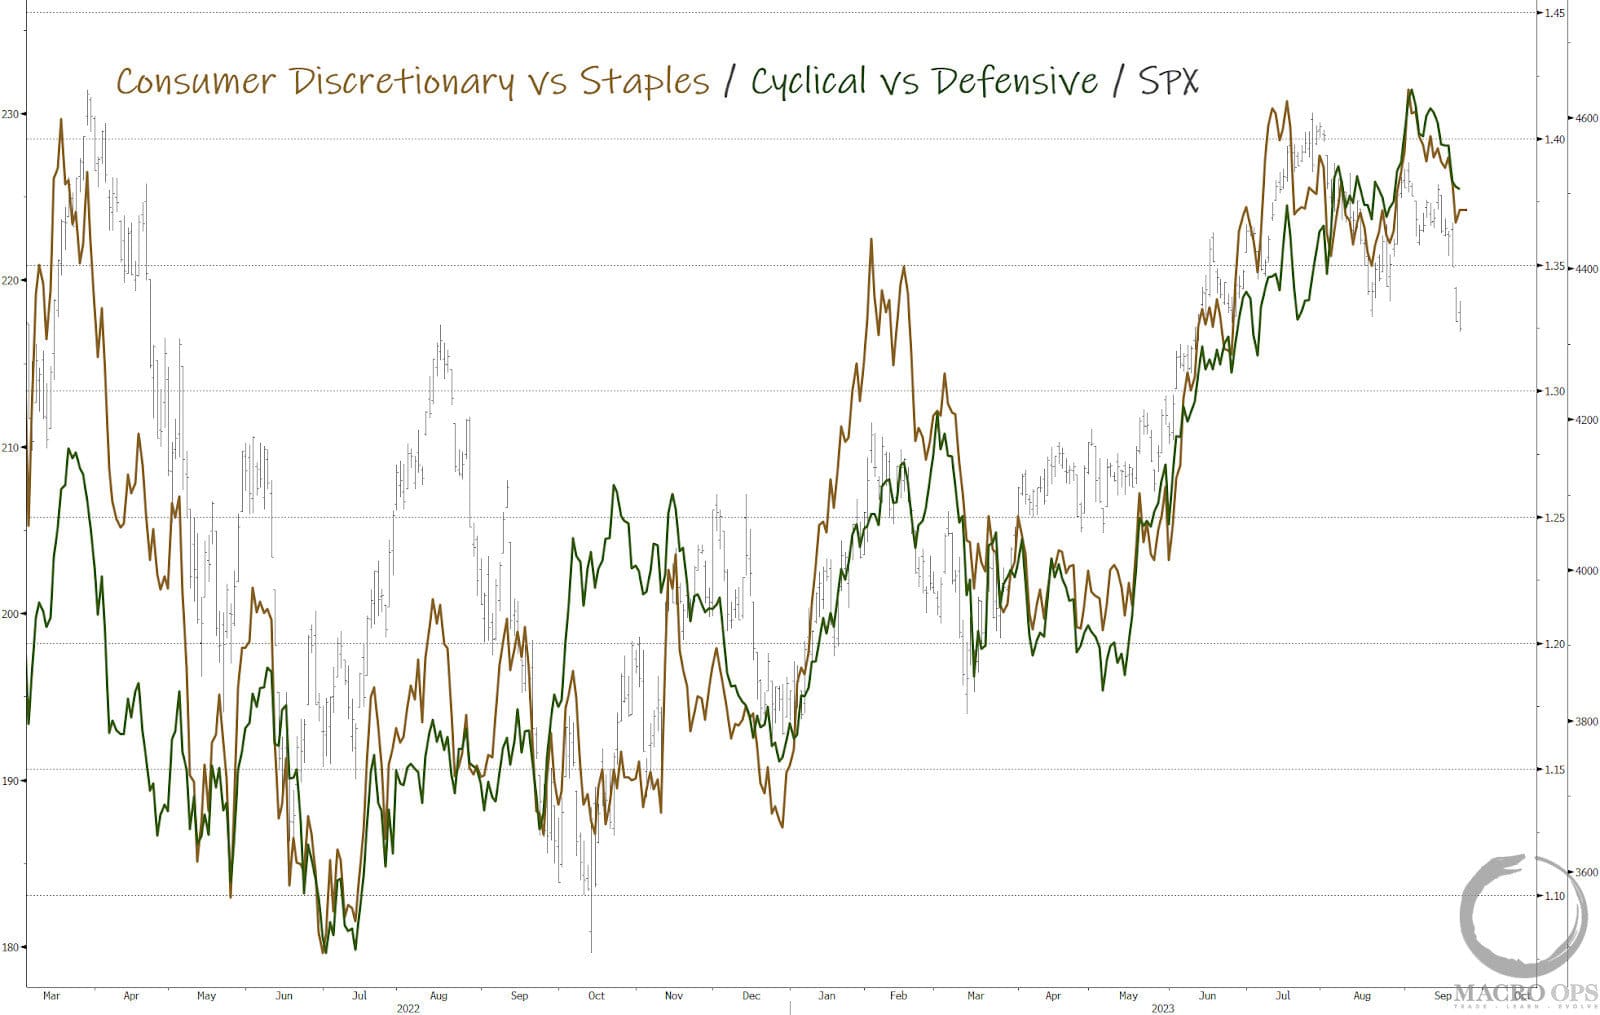
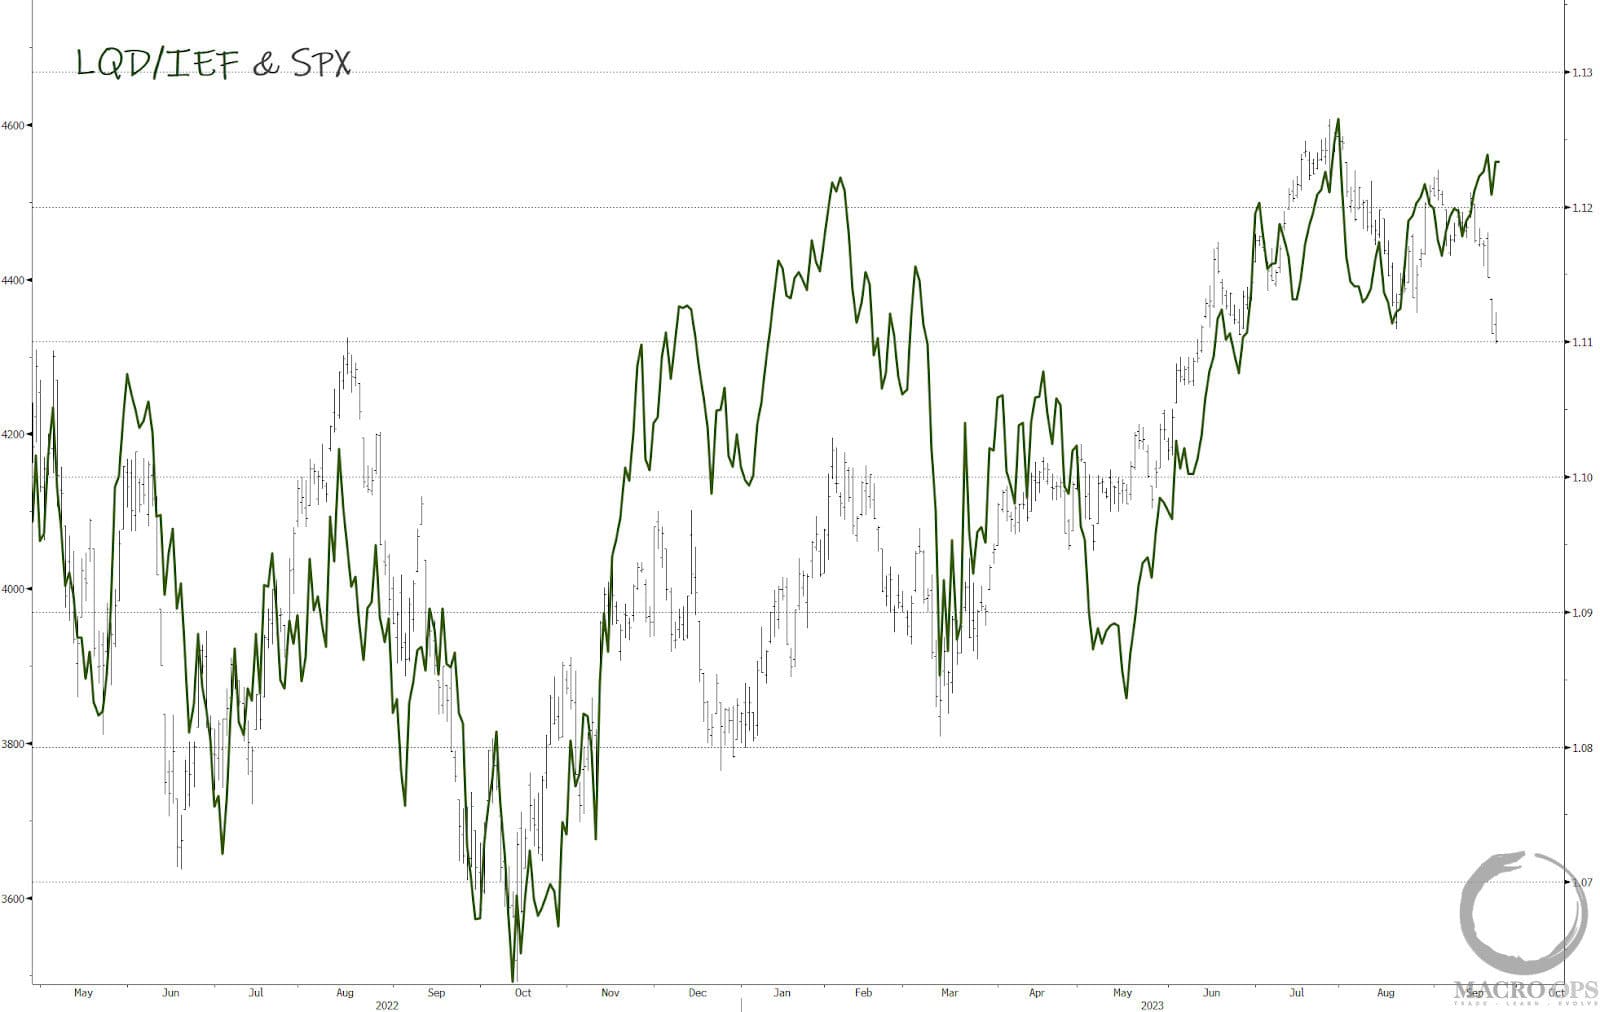
4. Same thing with credit spreads. This isn’t the type of action you see at a major peak but is again, much more in line with a run-of-the-mill correction within a broader uptrend.
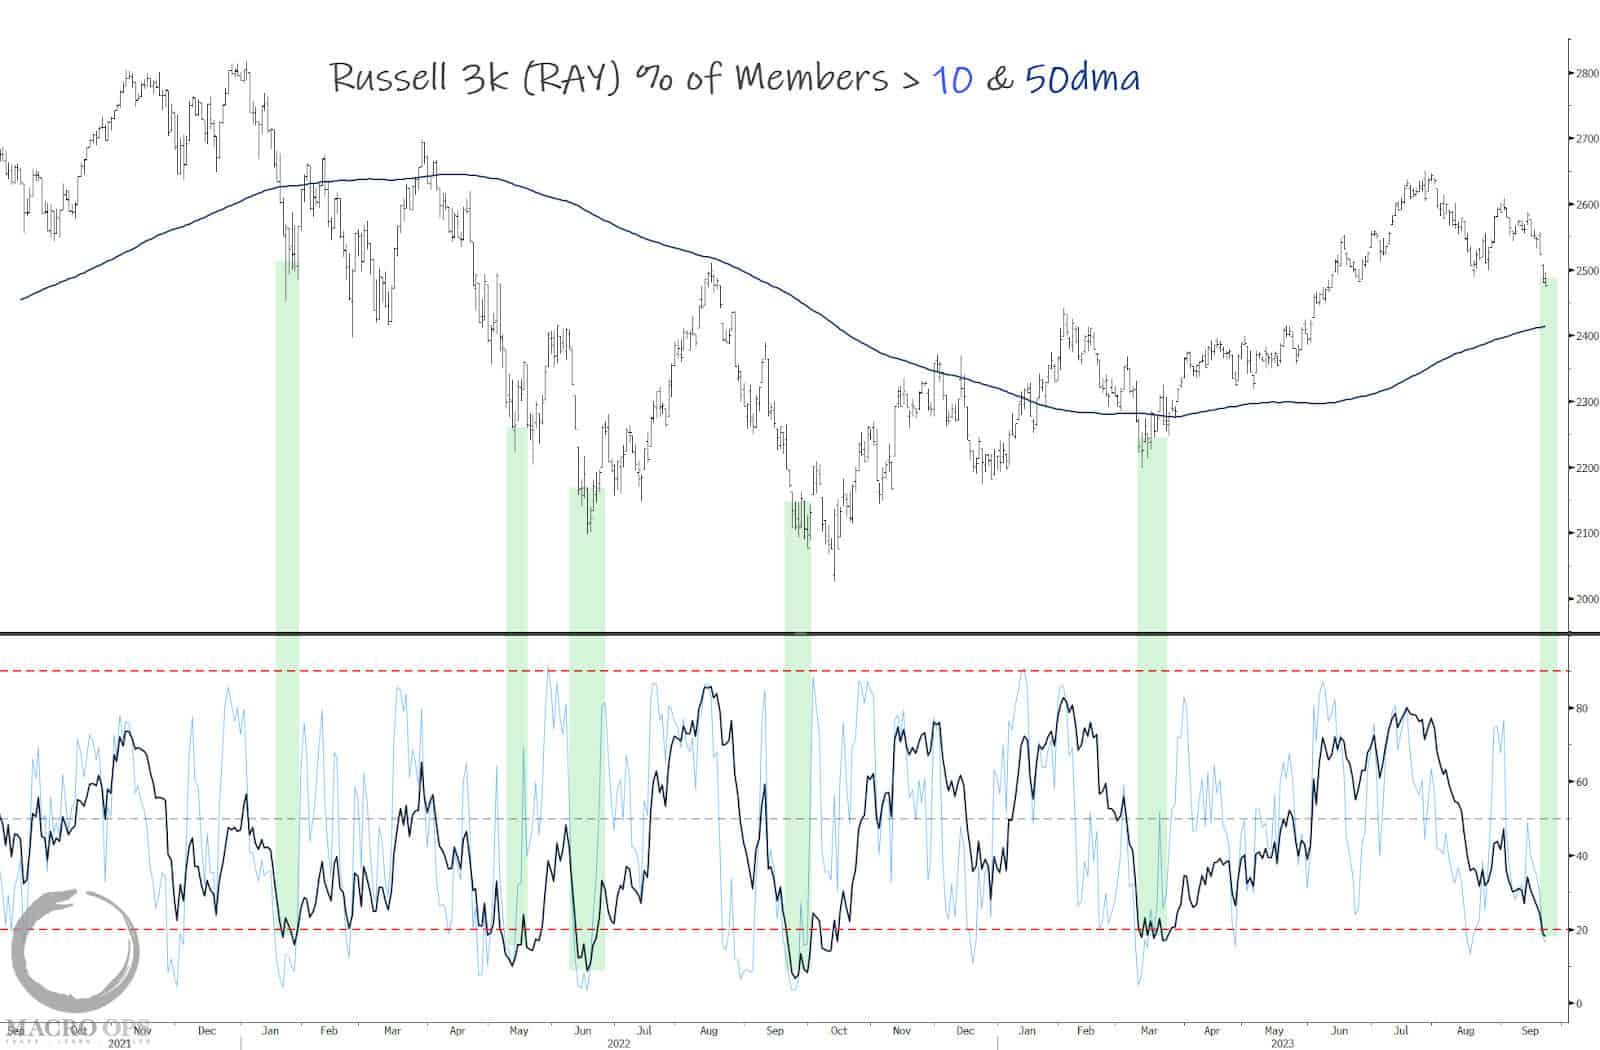
5. Breadth is hitting deeply oversold levels. It’s possible they become a little more oversold. But at some point soon the forces of mean reversion will work as a magnet to the tape, pulling it higher for at least a bounce.
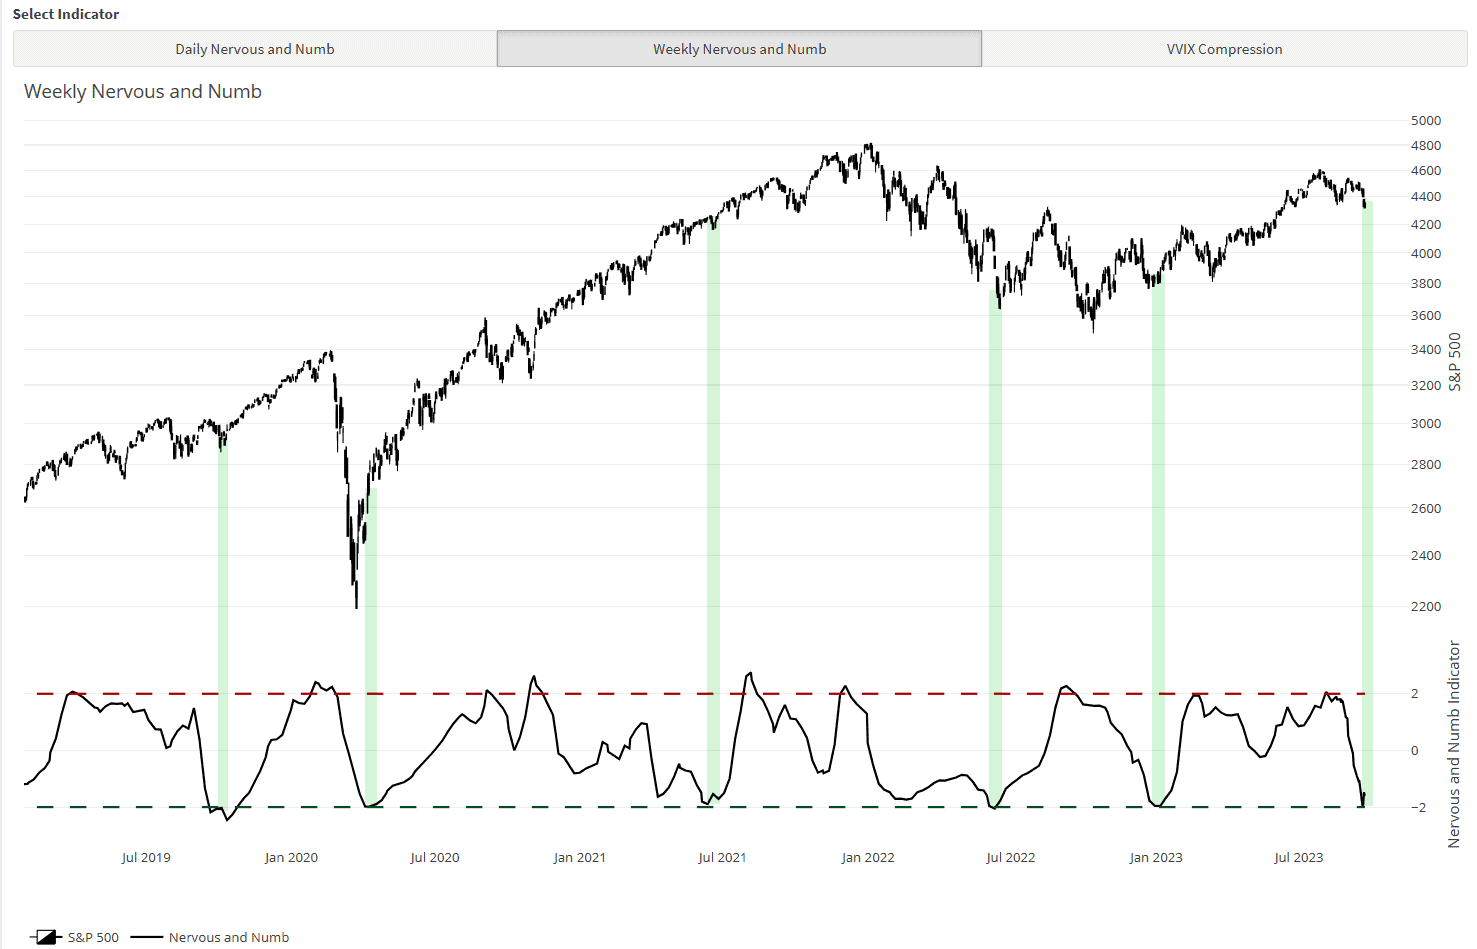
6. Our weekly Nervous and Numb signal which triggered a sell signal back in late July, right before this selloff, came within a hair’s breadth of triggering a buy signal on Friday. Close enough is usually good enough with this indicator and the market tends to see forward returns skew strongly to the upside in the weeks following a signal.
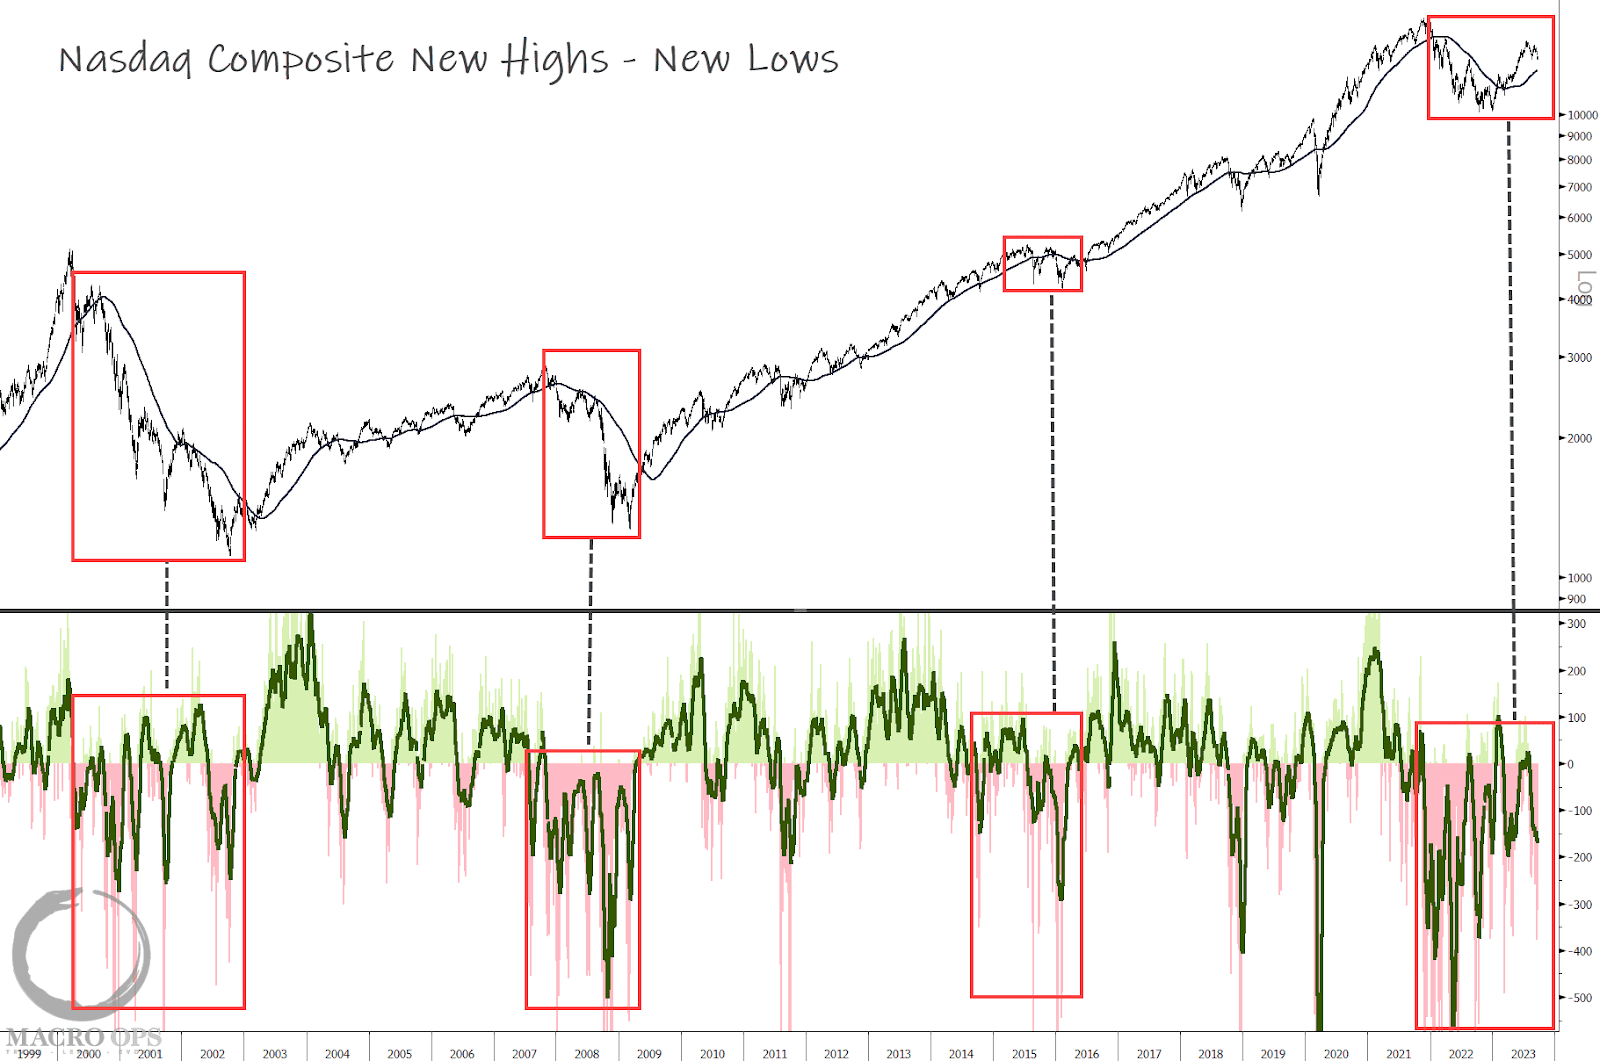
7. But not all is rosy… Pictures of longer-term breadth are not great. The chart below shows the Nasdaq Composite New Highs – Lows. Breadth has been weak all year but at least it was weak and improving. Now it’s just weak and getting weaker.
This action is typical of a broader corrective cycle; either an extended sideways volatile regime or a cyclical bear market. Which happens to also align with our broader macro base case.
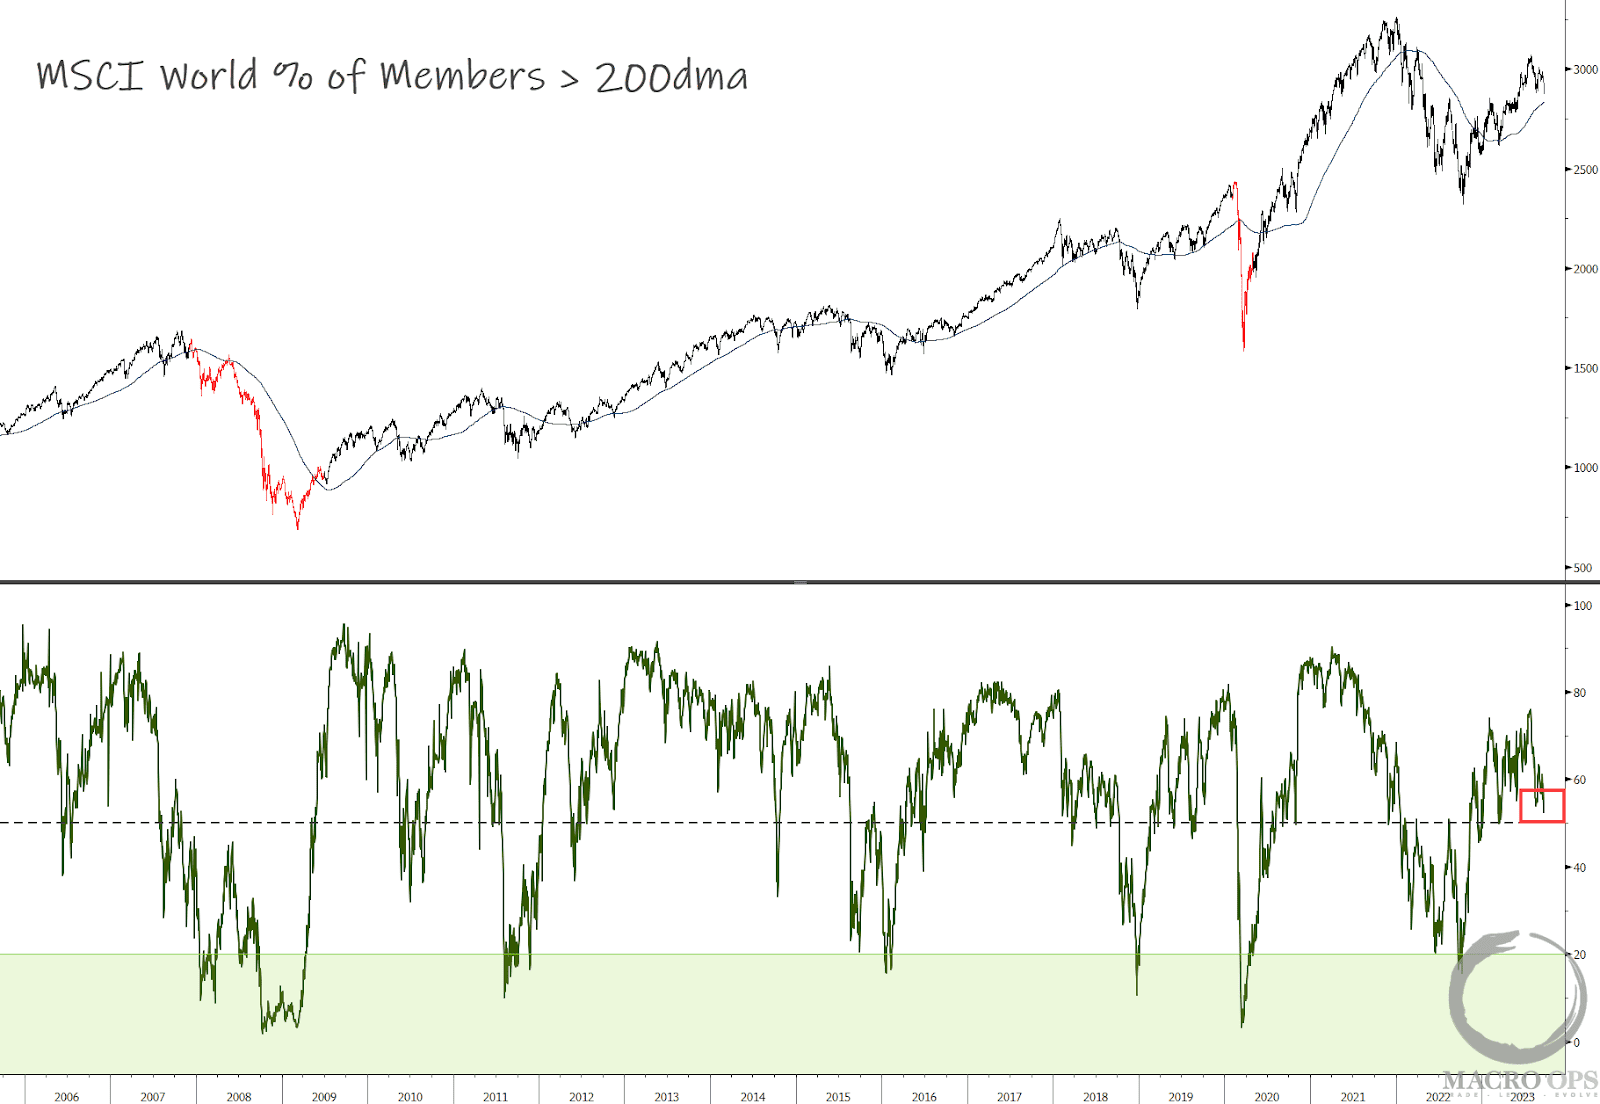
8. Here’s another view of long-term breadth, this time showing MSCI World percent of members above the 200dma. Currently, this number is hovering just above 50% but trending lower.
In simplistic terms, bad things happen between below 50% and above 10% (which marks deeply oversold levels).
In conclusion, the intermediate path of least resistance is up. The 10yr yield has a zscore over 2std right now and that’s what’s been putting the pinch of equities, but our leads say we should expect yields to find a top soon.
But we do need to watch longer-term breadth. A continued deterioration there would raise the odds that this corrective wave is fading and we’d want to then begin looking for a continuation lower.
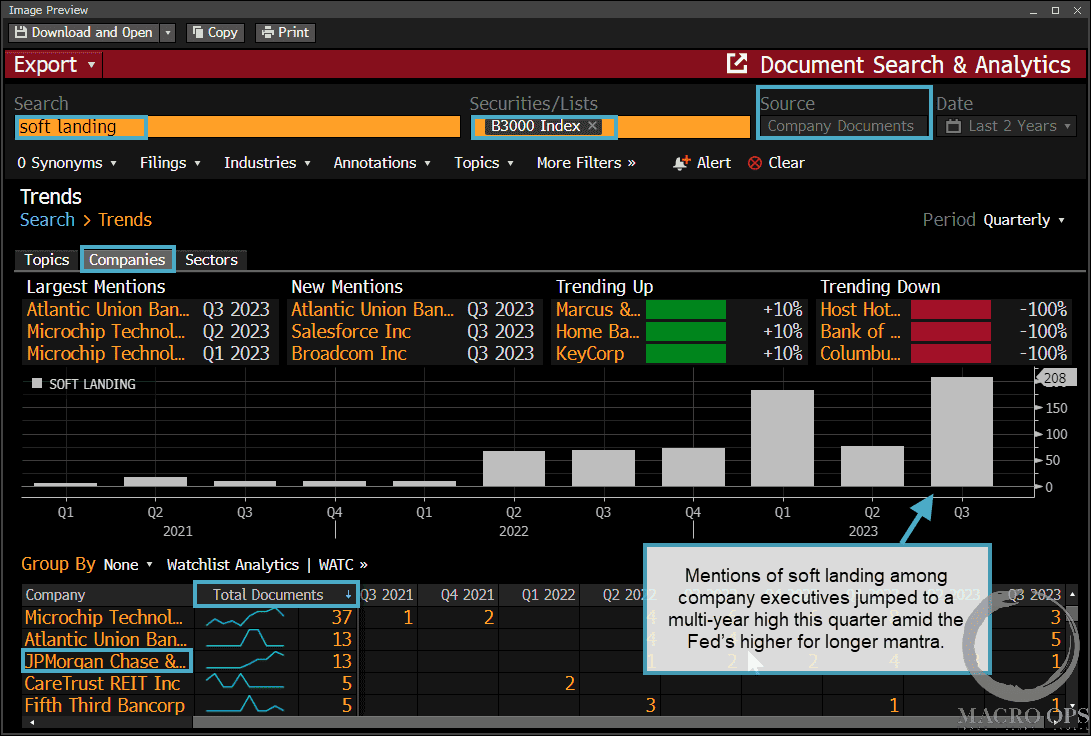
9. Meanwhile the Narrative Pendulum has swung all the way from “we’re already in a recession” at the start of the year to “soft landing / no landing”. This table from BBG shows mentions of “soft landing” from executives are hitting multi-year highs.
Maybe they think that if they say it enough times it might just come true?
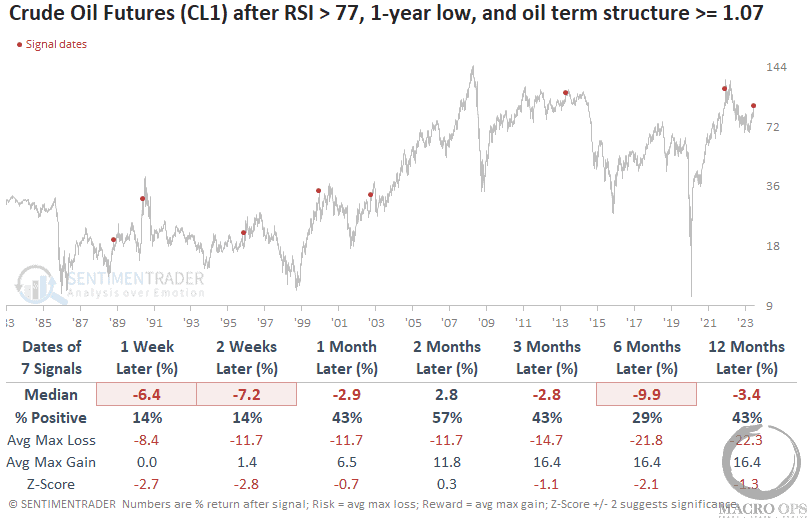
10. We nailed the last low in crude in these pages back in August (link here). And while we remain constructive on oil over the intermediate term, we expect to see a few weeks of profit-taking.
SentimenTrader seems to agree, writing “we will now identify instances when the RSI was above 77 for the first time after a 1-year low, and the term structure was 1.07 or greater. The outlook for crude oil doesn’t look promising across any time horizon. “
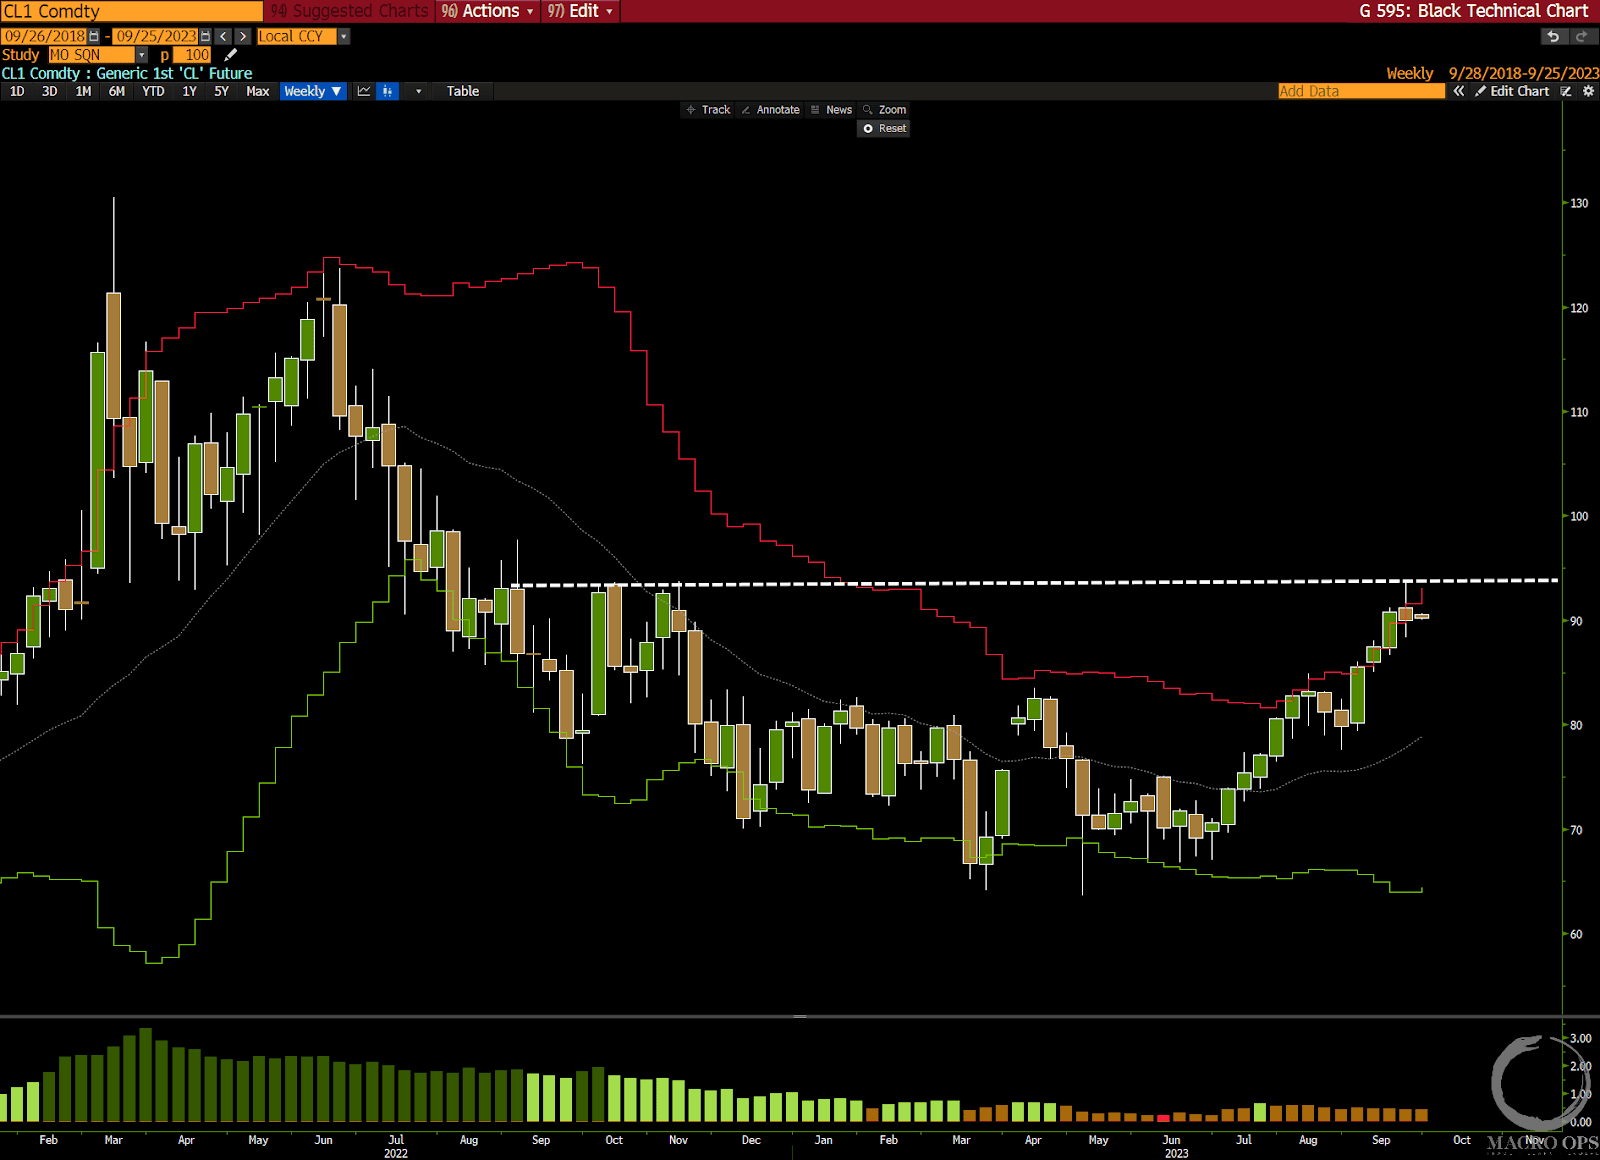
11. WTI crude also happens to be reversing off significant resistance at the $95 level (chart below is a weekly).
But note the strong two-legged bullish thrust we’ve seen so far. This is an impulsive move and not a corrective one. So we should at least expect one more leg (impulse trends tend to move in three waves) to new highs or at least back to the $95 level to form a double top following a retrace.
.
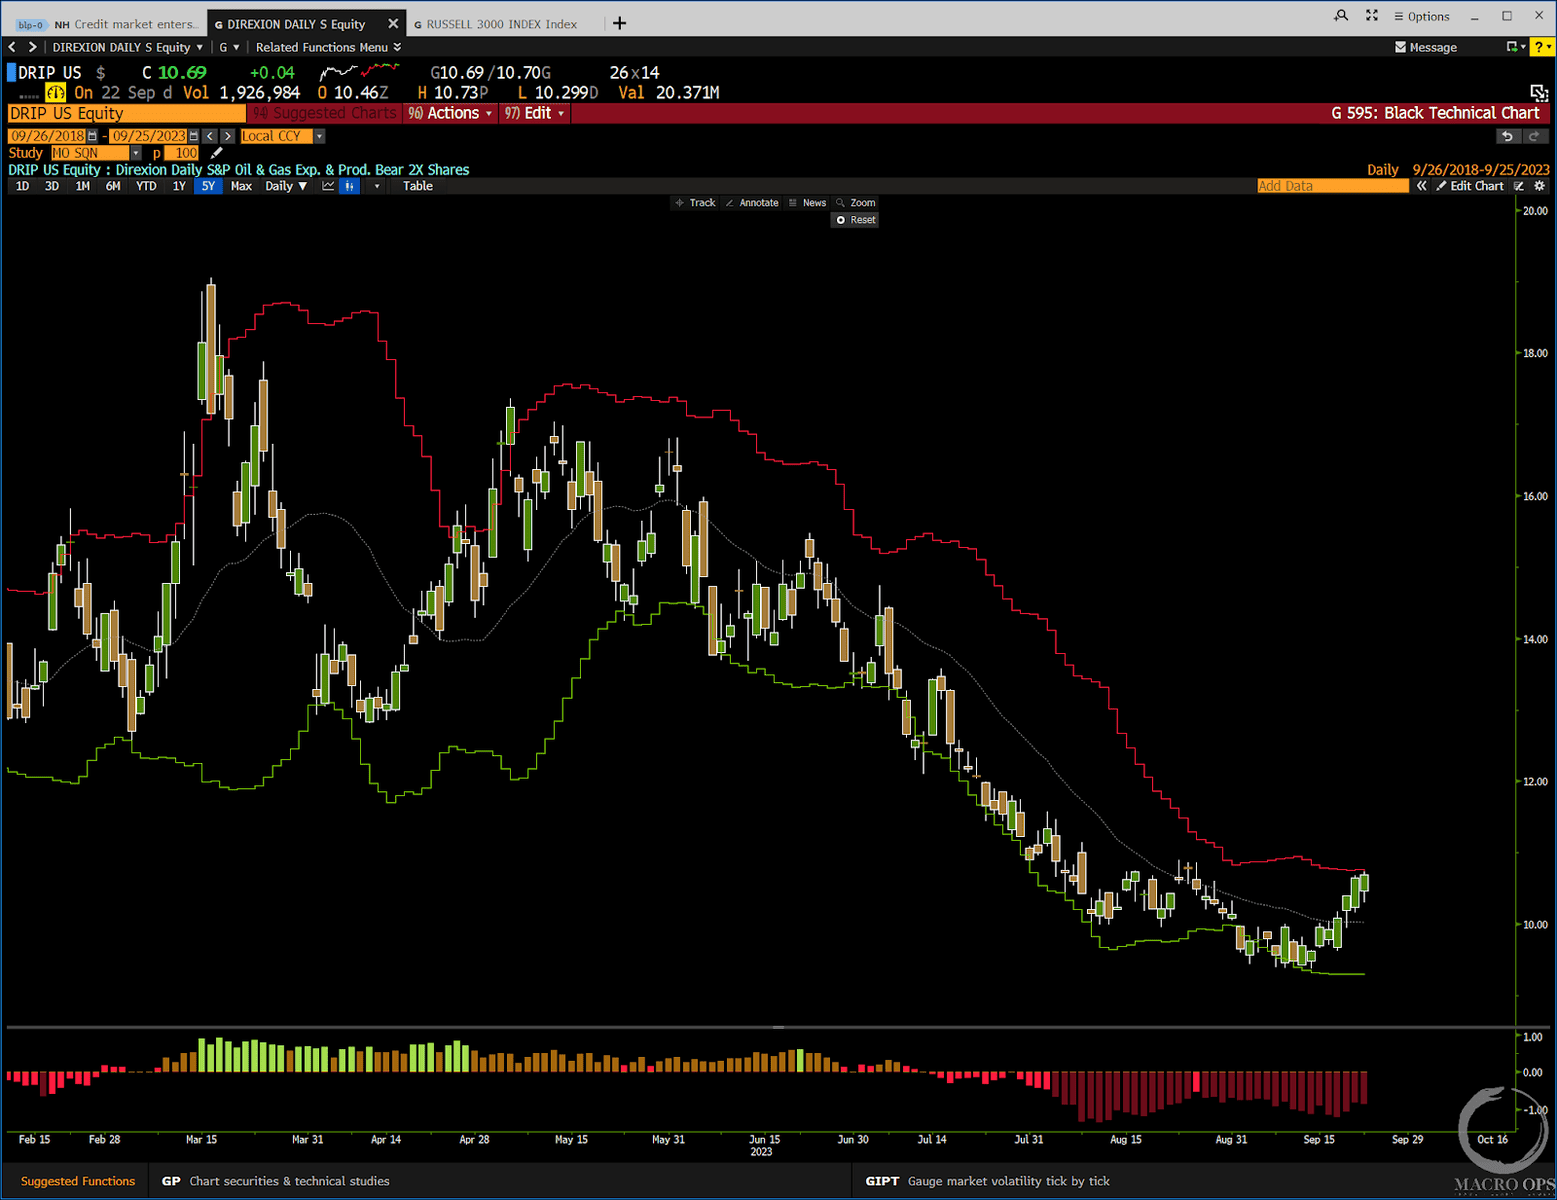
12. If you have some oil & gas exposure and would like to hedge it, consider going long DRIP, a 2x leveraged bearish E&P ETF. You can nest in a decently tight stop below the recent range and get some size on for little risk.
Thanks for reading.