Whenever you have jealousy as an emotion, or greed, or envy, it distorts your judgment. The market’s like the bleached blonde in Vegas. It doesn’t care about you. That’s why you have to put aside your ego and get out. If you have trouble doing that, as most people do, be like Odysseus; tie yourself to the mast with an automatic stop and take your emotions out of play. ~ Marty Schwartz
In this week’s Dirty Dozen [CHART PACK] we talk Chinese RE, chop and vol and what it means, update our developing bond bear trap thesis, pitch long Nikkei, long USDMXN, and long Uranium, plus more…
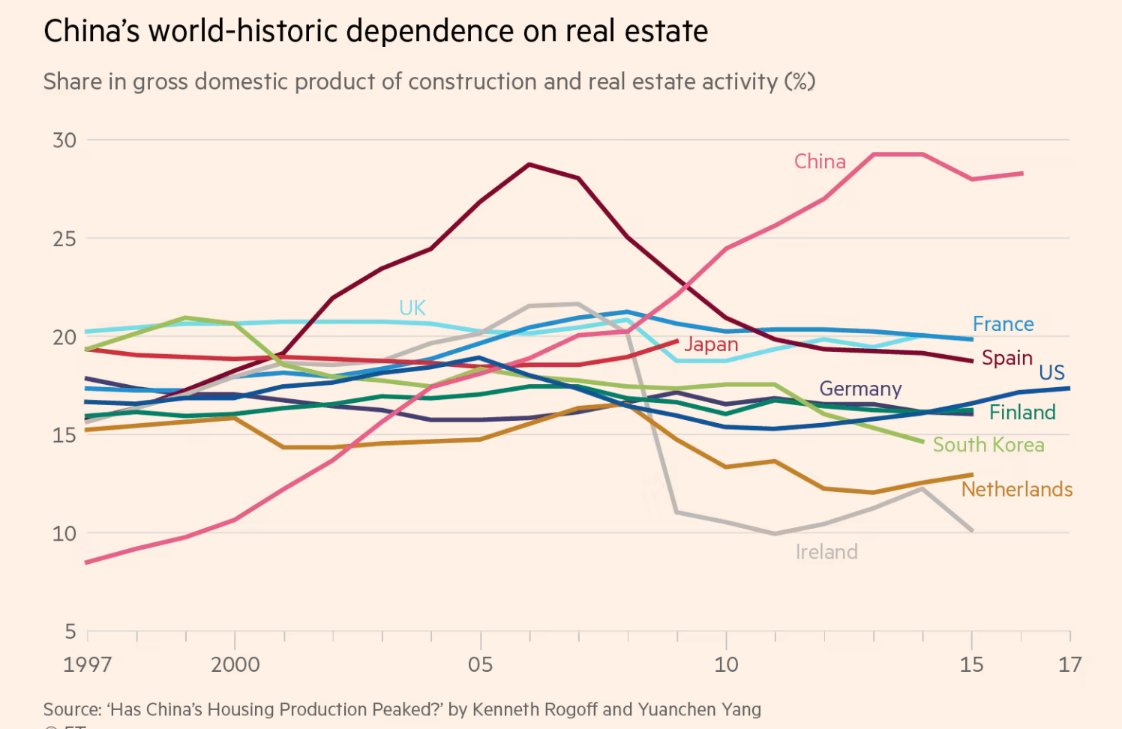
1. China is in a recession. The official numbers won’t show that. But they are. This contraction is being driven by a bloated property sector, which as the chart below shows, is quite large relative to the rest of the economy. The FT explains what this means (link to article):
“Here is my potted description of what is going on: local governments, which borrowed (often in obscure ways) to drive growth through local construction, are at the crux of the balance sheet mismatch between assets and liabilities. That means they stop financing new projects, which in turn kills the business model of the construction sector as well as a principal engine of growth.
“On the creditor side, doubt spreads whether those who financed local governments will get the return they expect — or even their money back at all. This largely means the household sector, whether directly or through banks (with private sector deposits funding banks’ loans to local governments and property developers). In the former case, you will get a direct effect of lost wealth. In the latter case, you will get a banking crisis thrown in.”
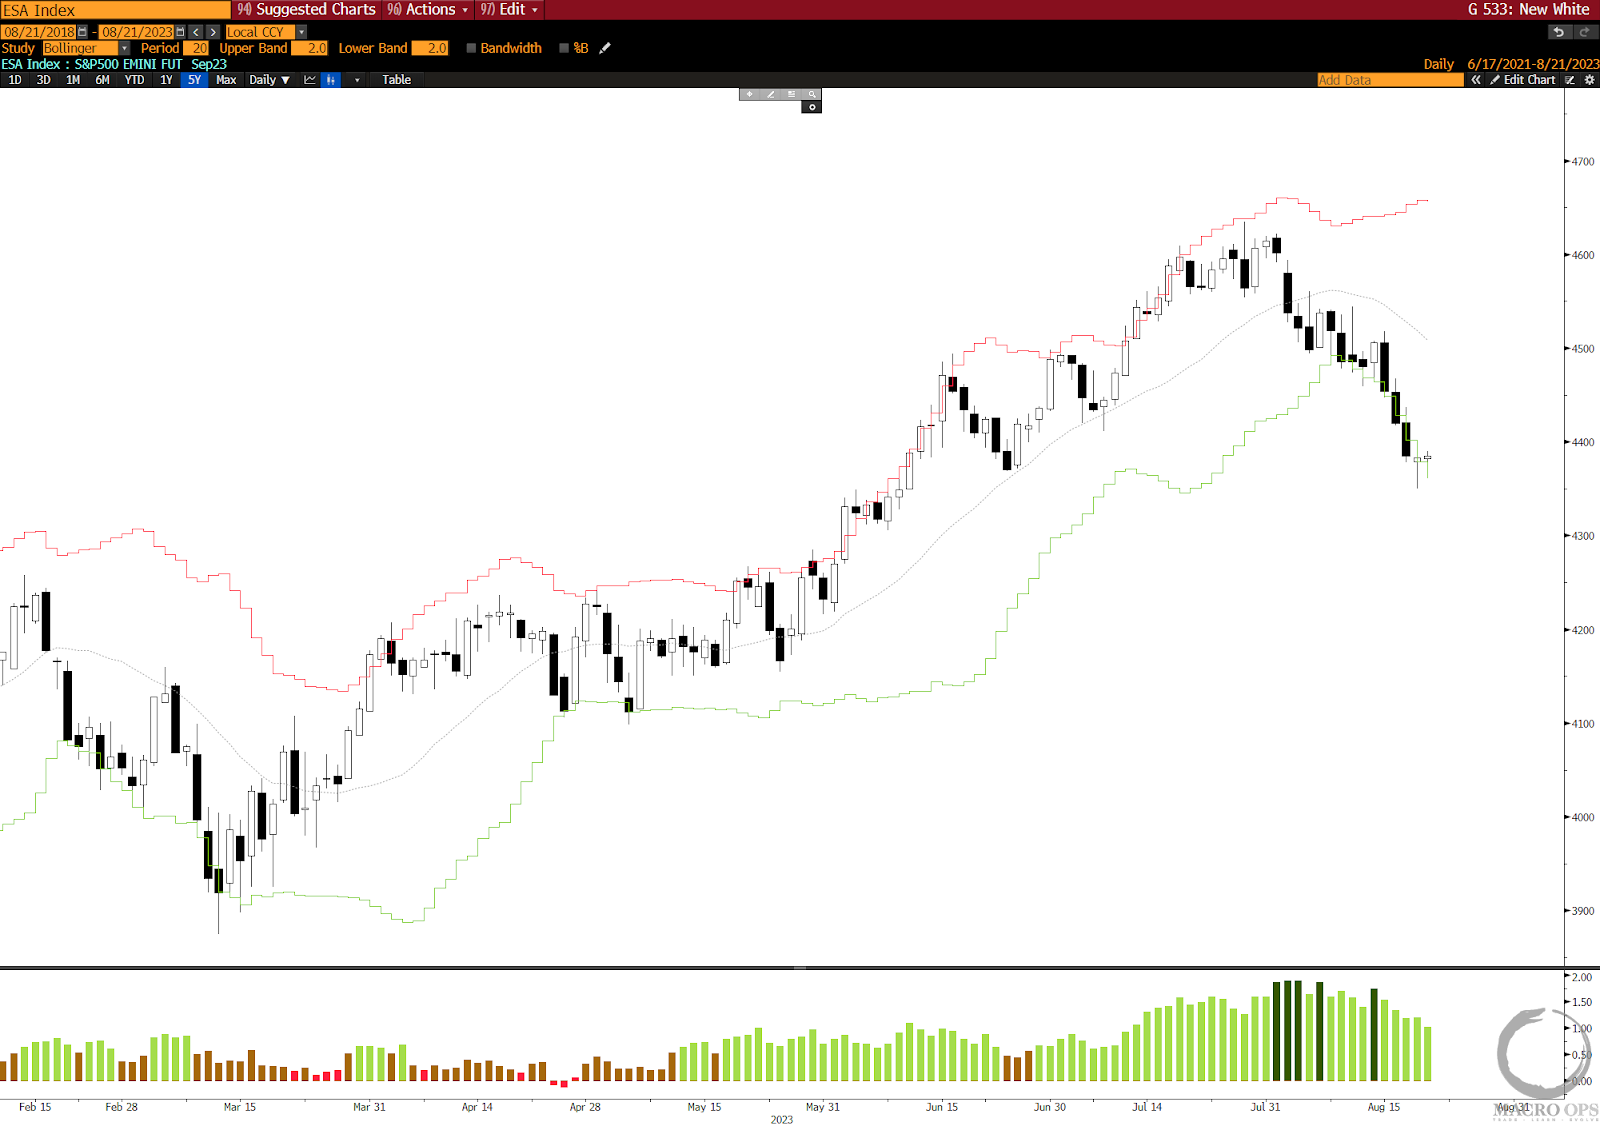
2. The market is in a pullback after triggering a Weekly Nervous & Numb sell signal and a Trend Fragility > 90% sell signal two weeks ago. We have reason to believe this is just a run-of-a-mill pullback and not the top, as I’ll explain below.
This is a chart of the SPX on a daily timeframe. Due to the large consecutive bear bars that preceded Friday’s reversal, the odds favor a retest of these recent lows though we probably see a short multi-day bounce first. We’d consider trying to get long should we get a double bottom later this week or early next week.
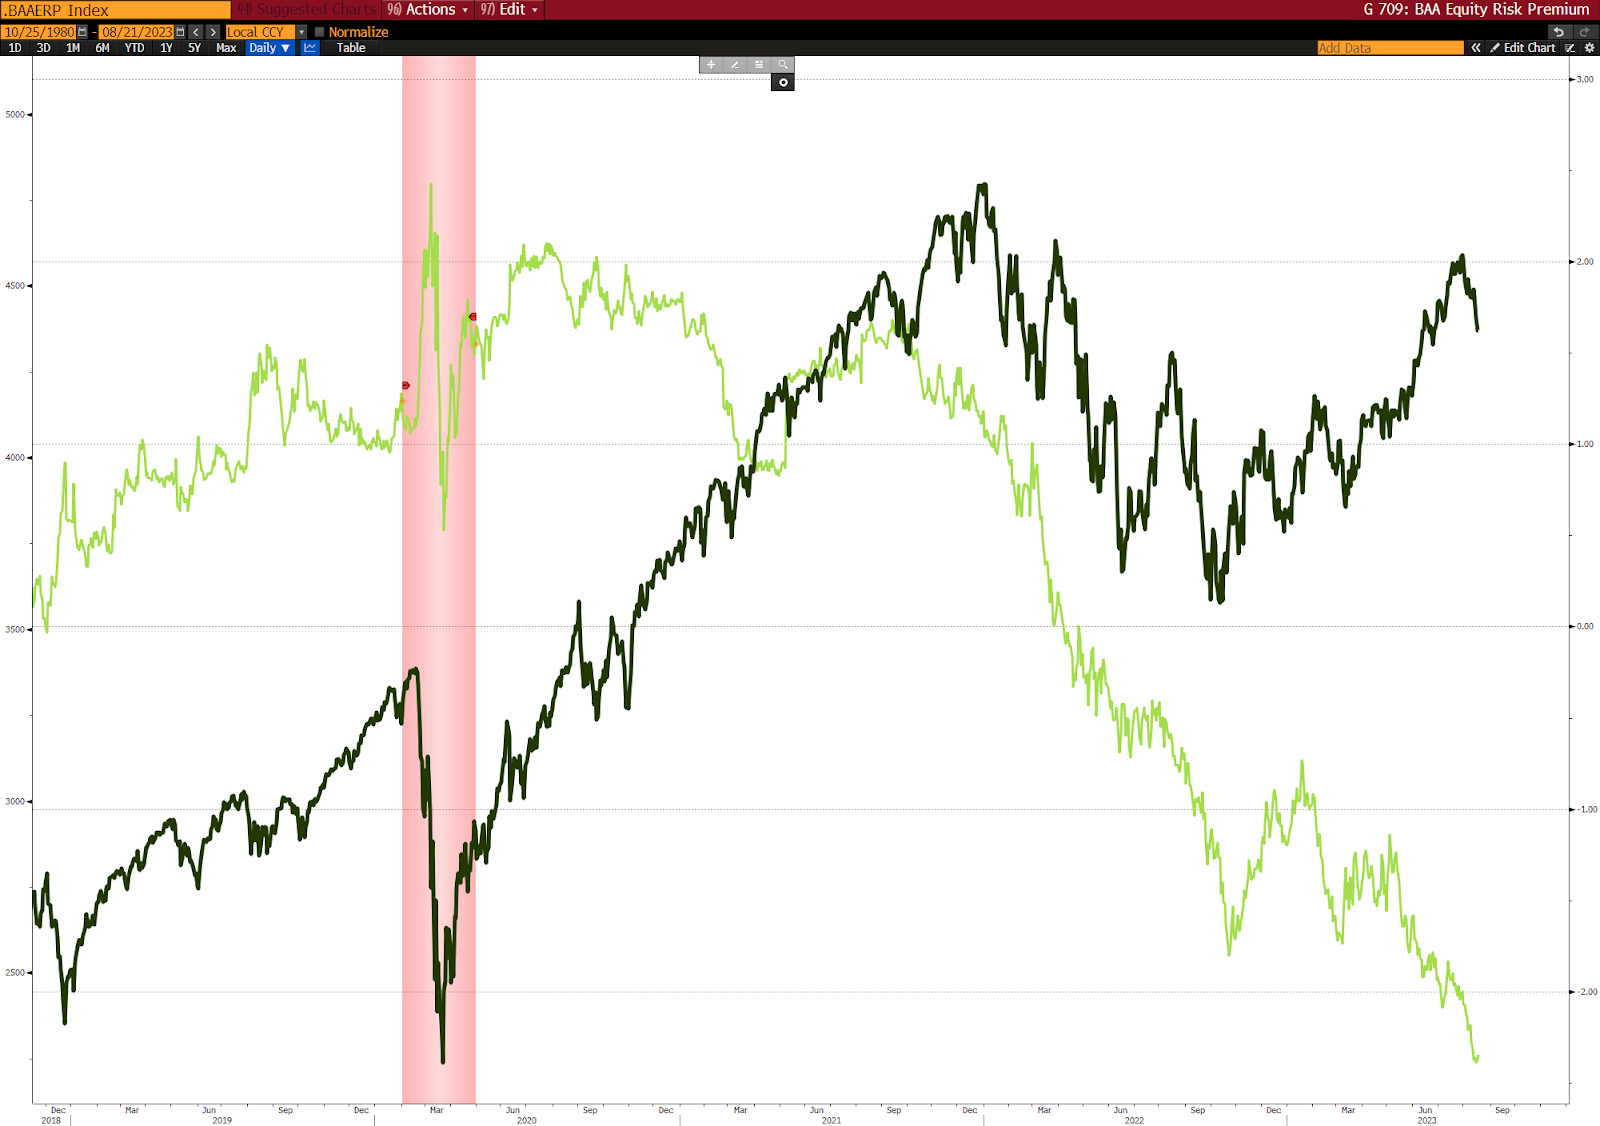
3. This move has been entirely driven by rising rates and not large risk-off flows. We can see this in the equity risk premium which is hitting new lows.
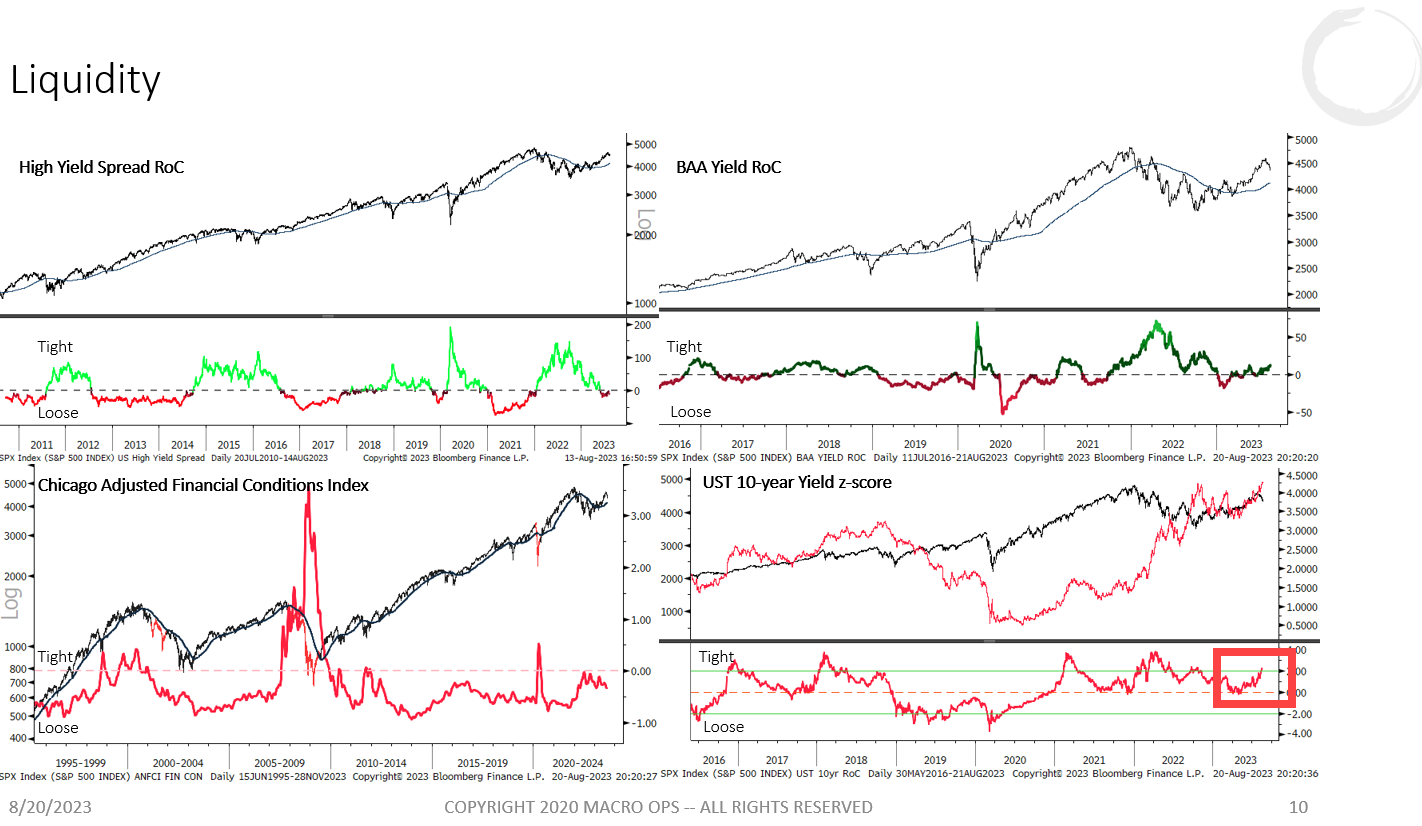
4. And while 10yr yields are running at highs (chart at bottom right), the credit market is taking things in stride. HY spreads aren’t blowing out and financial conditions are staying fairly easy.
For us to turn more bearish we’d want to see some confirming weakness here, which we’re just not at this moment.
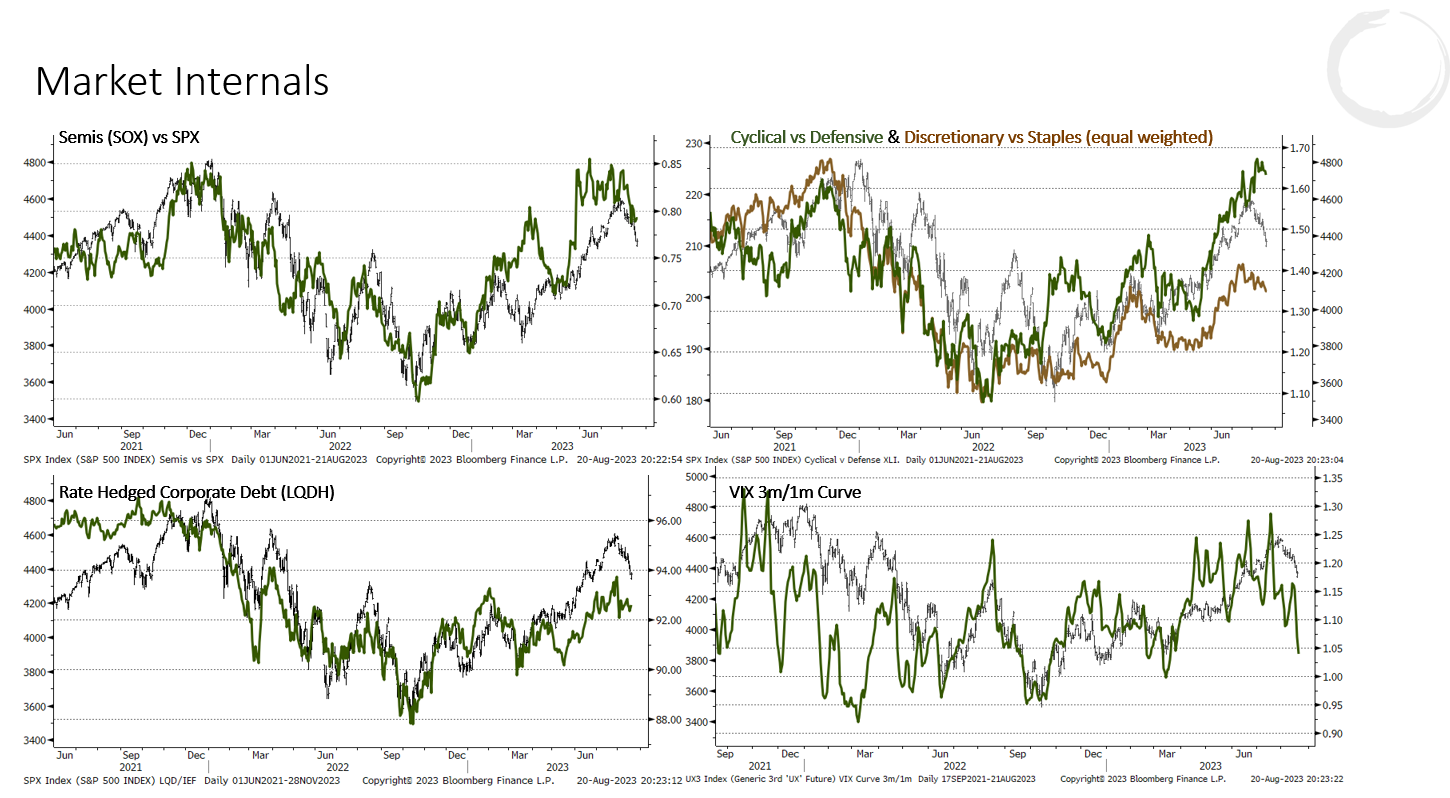
5. We’ll keep sharing this chart because it’s an important one to watch right now. Market internals are by and large still supportive of the broader uptrend in stocks. We’ve seen no major negative divergences. Cyclicals vs Defensives continue to lead the way higher. And the 3m/1m vix curve is a shorter-term sell signal, so less important on a broader timeframe.
Our base case continues to be to expect elevated chop and vol as these are characteristic of Bull Volatile regimes, which we are in. But the odds favor a run at recent highs and we shouldn’t expect a larger top until we see more evidence of one.
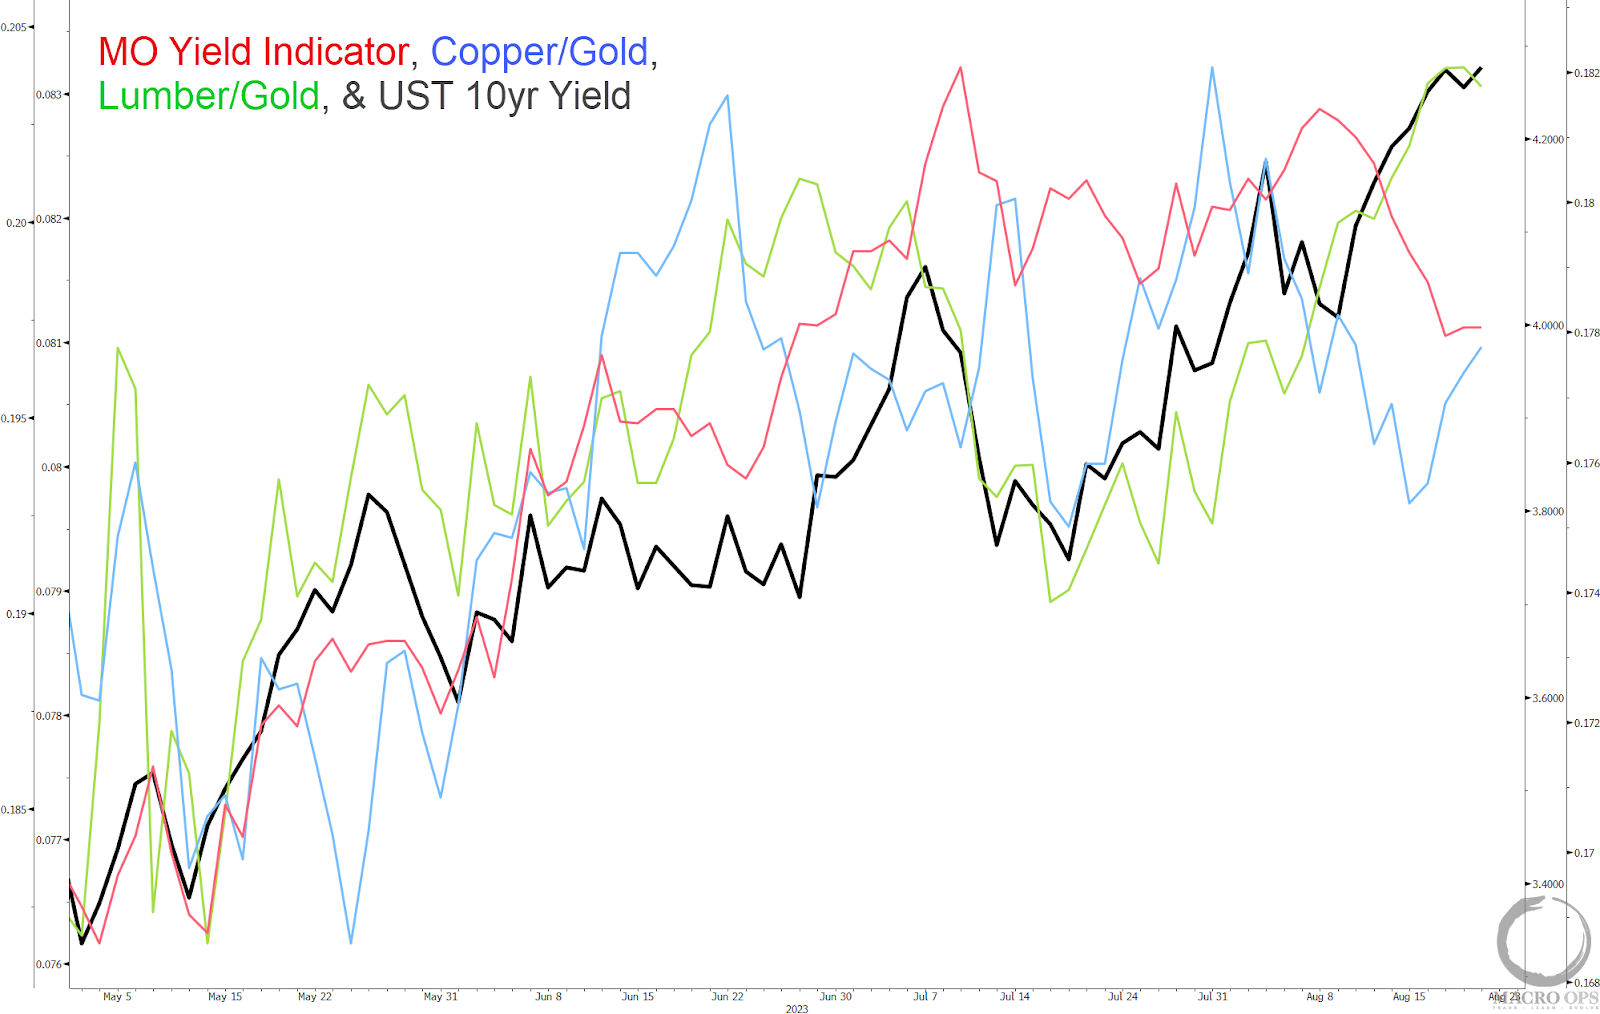
6. Looks like we’re getting that break-to-new-lows bear trap that we’ve been waiting on. Our MO yield indicator started to diverge lower last week, which is promising. Still need to be patient as this trade will take a few more weeks to develop but everything is setting up nicely so far.
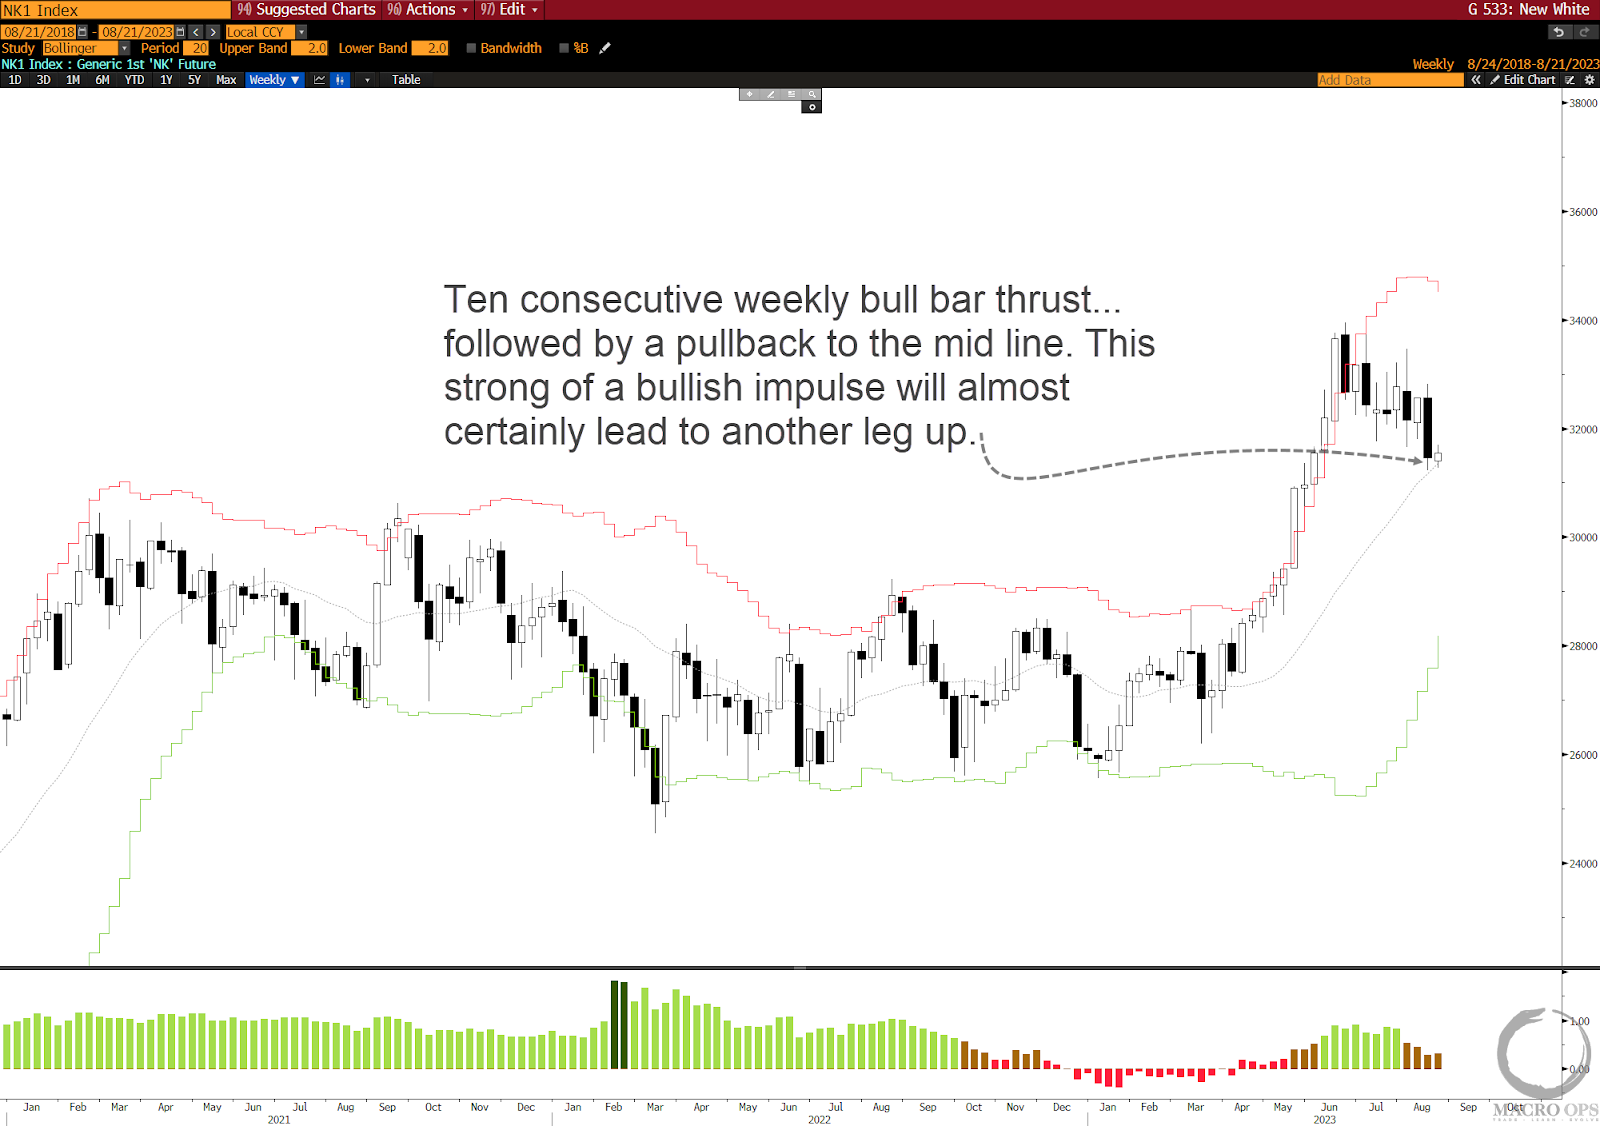
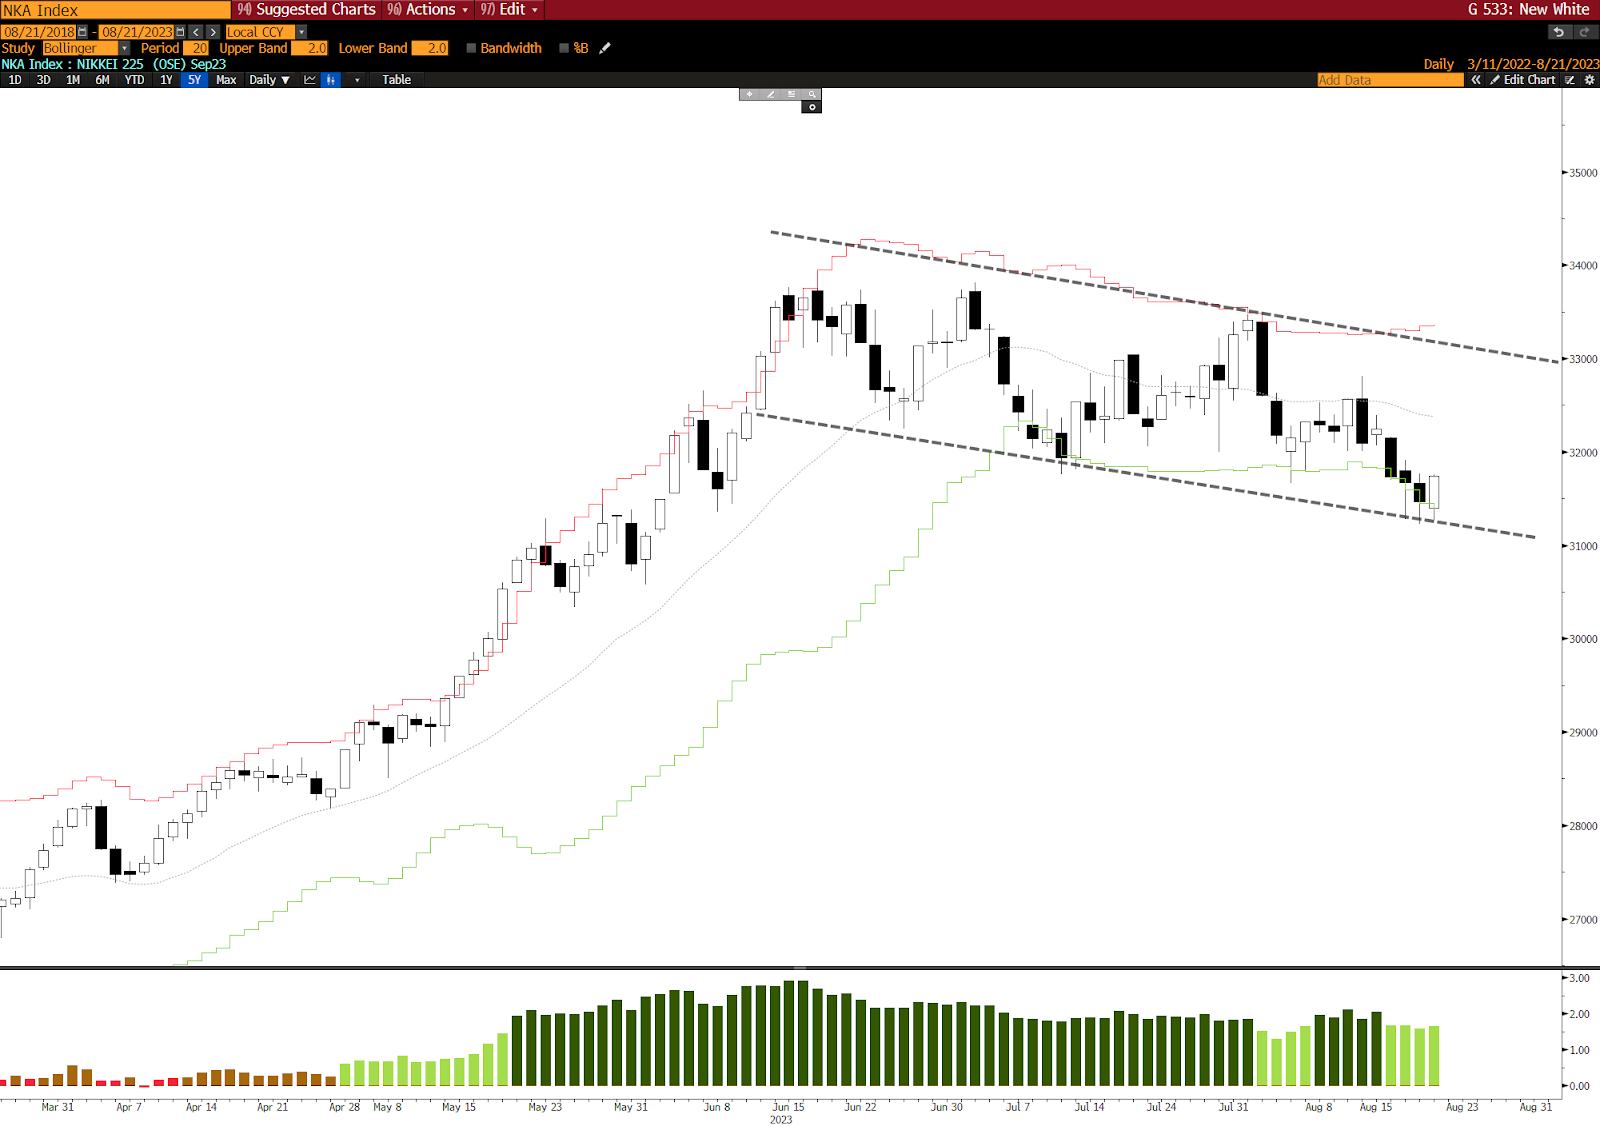
7. Here’s a weekly chart of the Japanese Nikkei. It was one of the strongest markets earlier this year and put in an impressive ten consecutive bull bars before letting off some steam in a bull flag back to its weekly Bollinger Band midline. This is a very healthy-looking chart. A second large bull leg almost always follows after a large bull thrust such as this, as it’s a sign of a major imbalance in supply and demand.
The current technicals give us a good area to look to get long.
8. We can start nibbling at the lower range of its bull flag, allowing us to place a tight stop and get some size on. Chart is a daily.
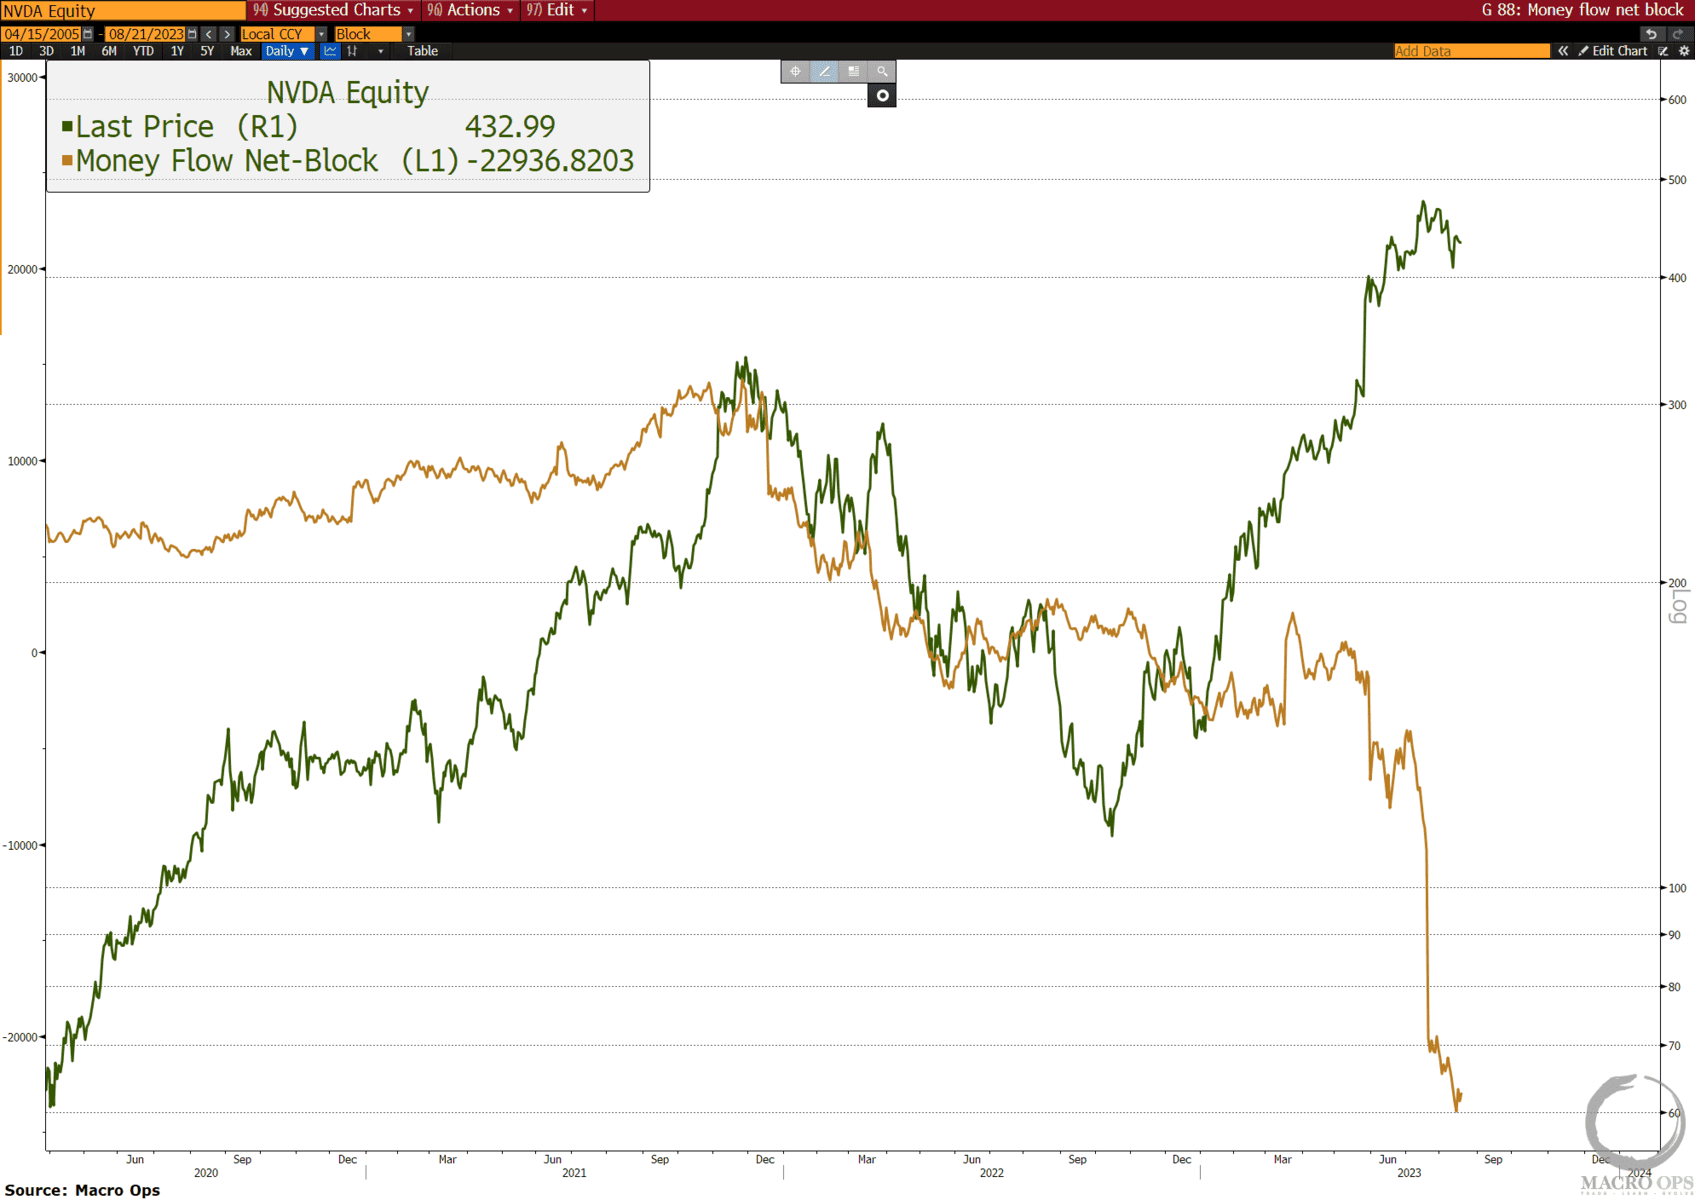
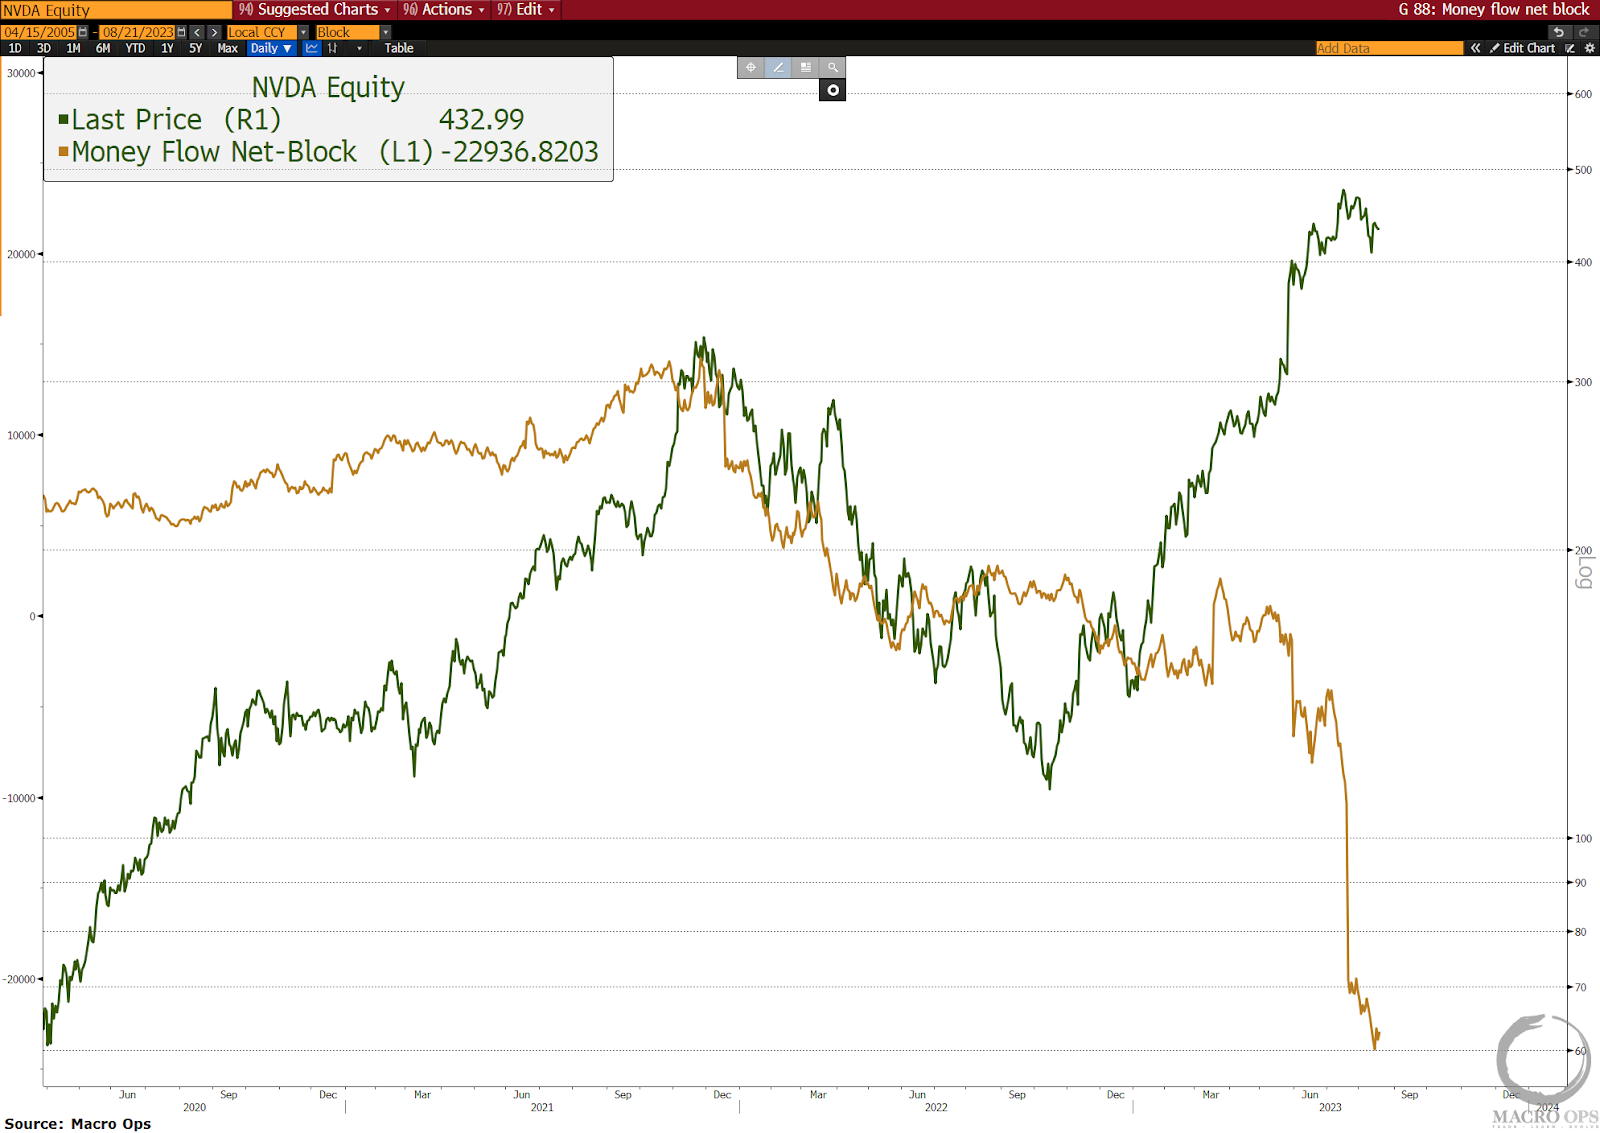
9. NVDA reports earnings this week. I have zero views on the print versus expectations. But this chart showing net block order flow tells us that whales have been bailing out of this rally (selling to mostly retail) for the last few months.
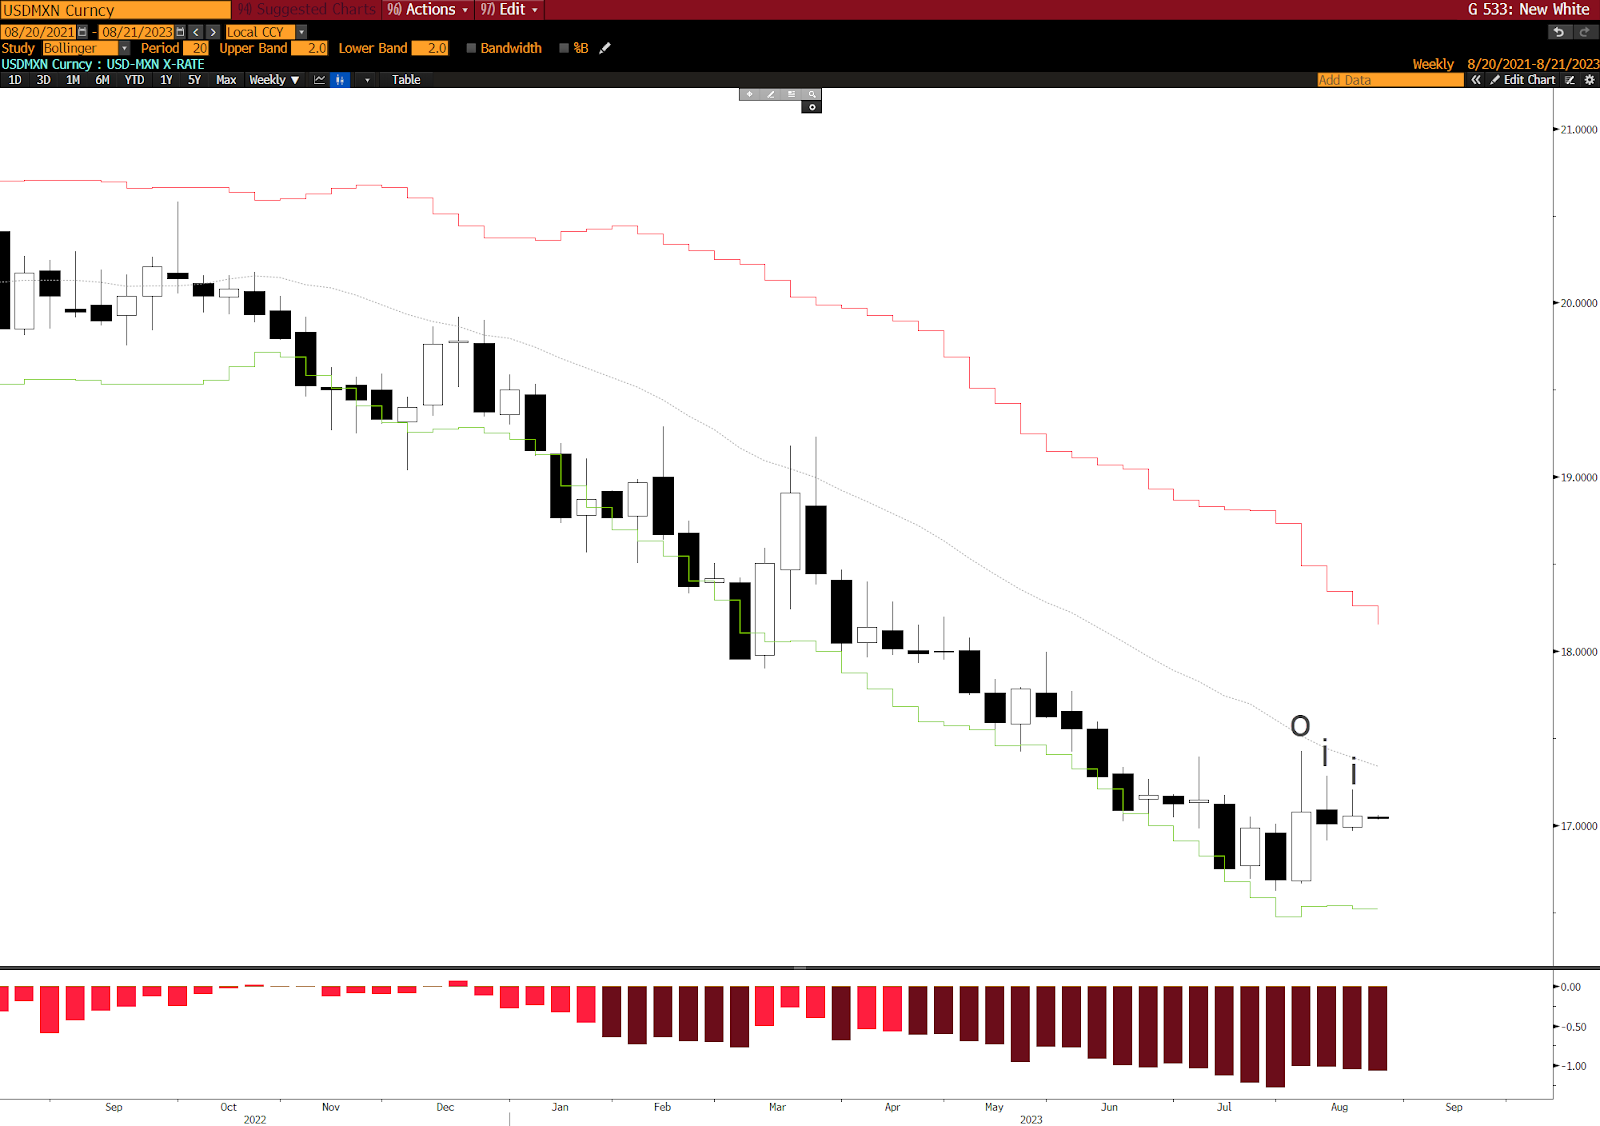
10. We’ve been long USDCNH for the better part of the year. And with positioning short USD across the board, we’re interested in looking for crosses to build out a long USD basket. USDMXN is one of these.
The peso has been on an incredible run. Positioning and sentiment though have gotten crowded. The weekly chart has formed an outside-inside-inside pattern. This is a breakout pattern and means the odds favor a big move is coming.
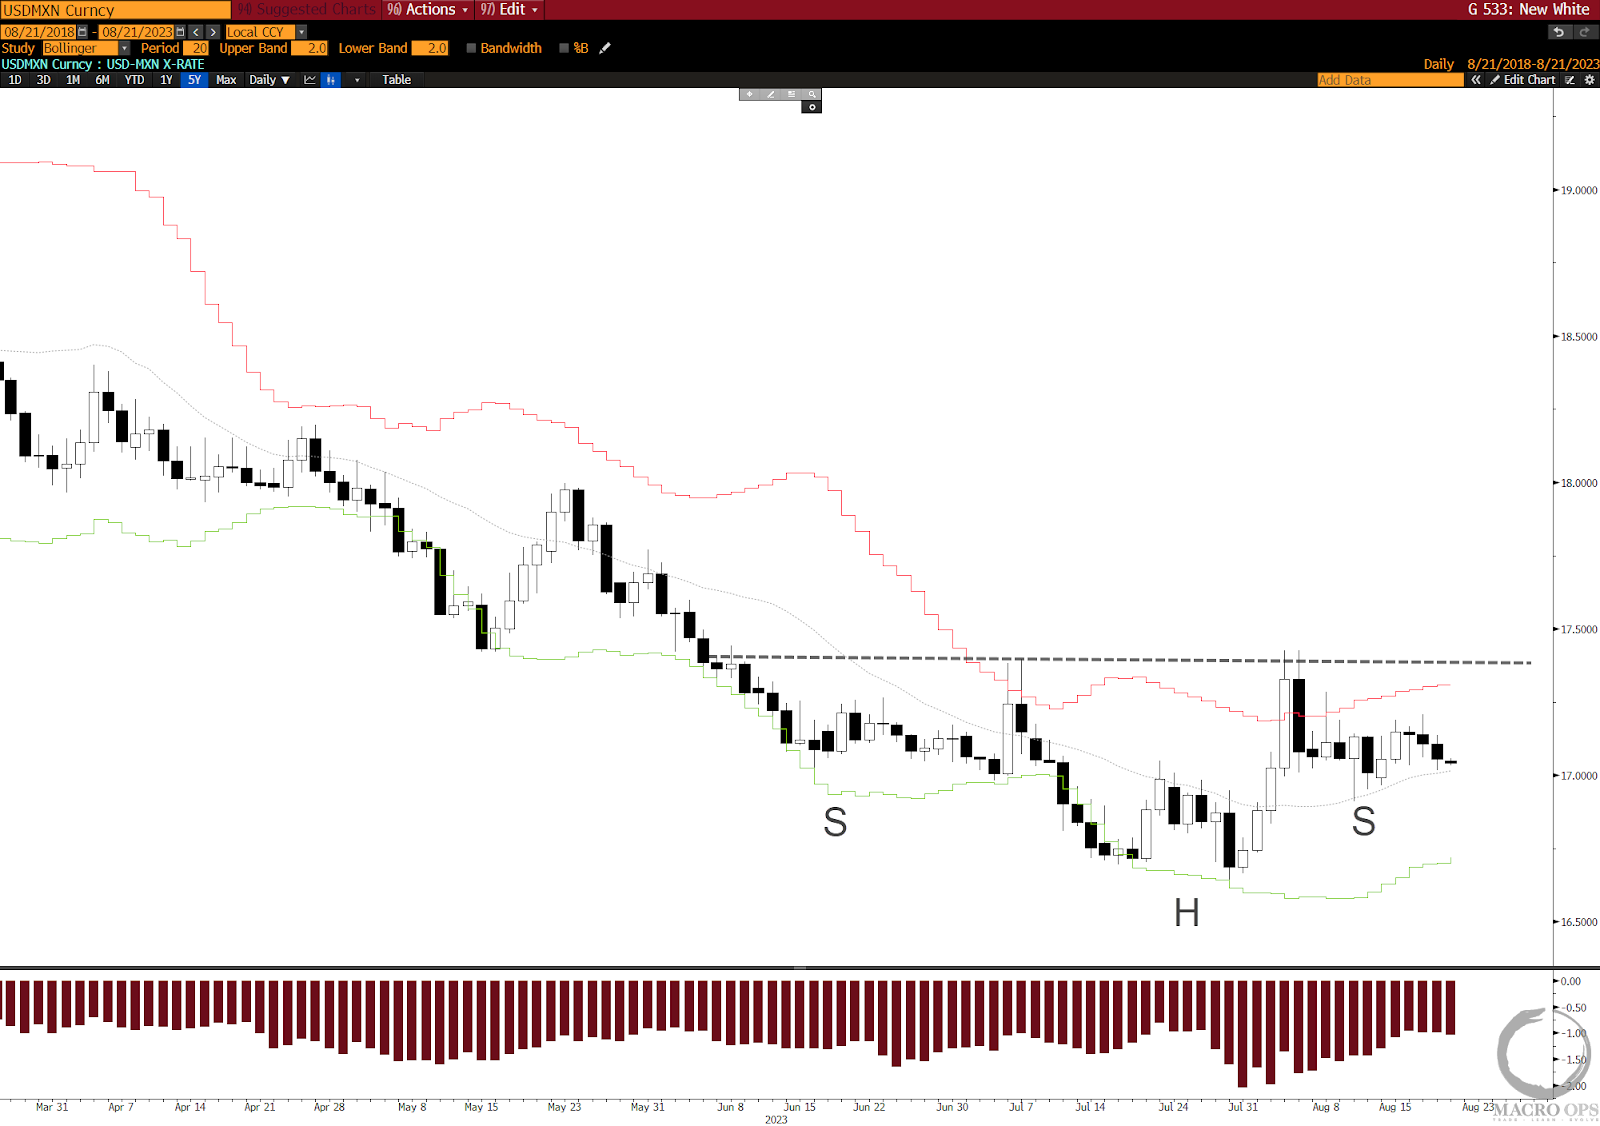
11. The daily shows a potential inverted H&S bottom being put in. The chart still needs time to develop and because going long USDMXN would be fading a strong trend, we have to be patient and wait for the tape to tell us that the trend is in fact about to bend.
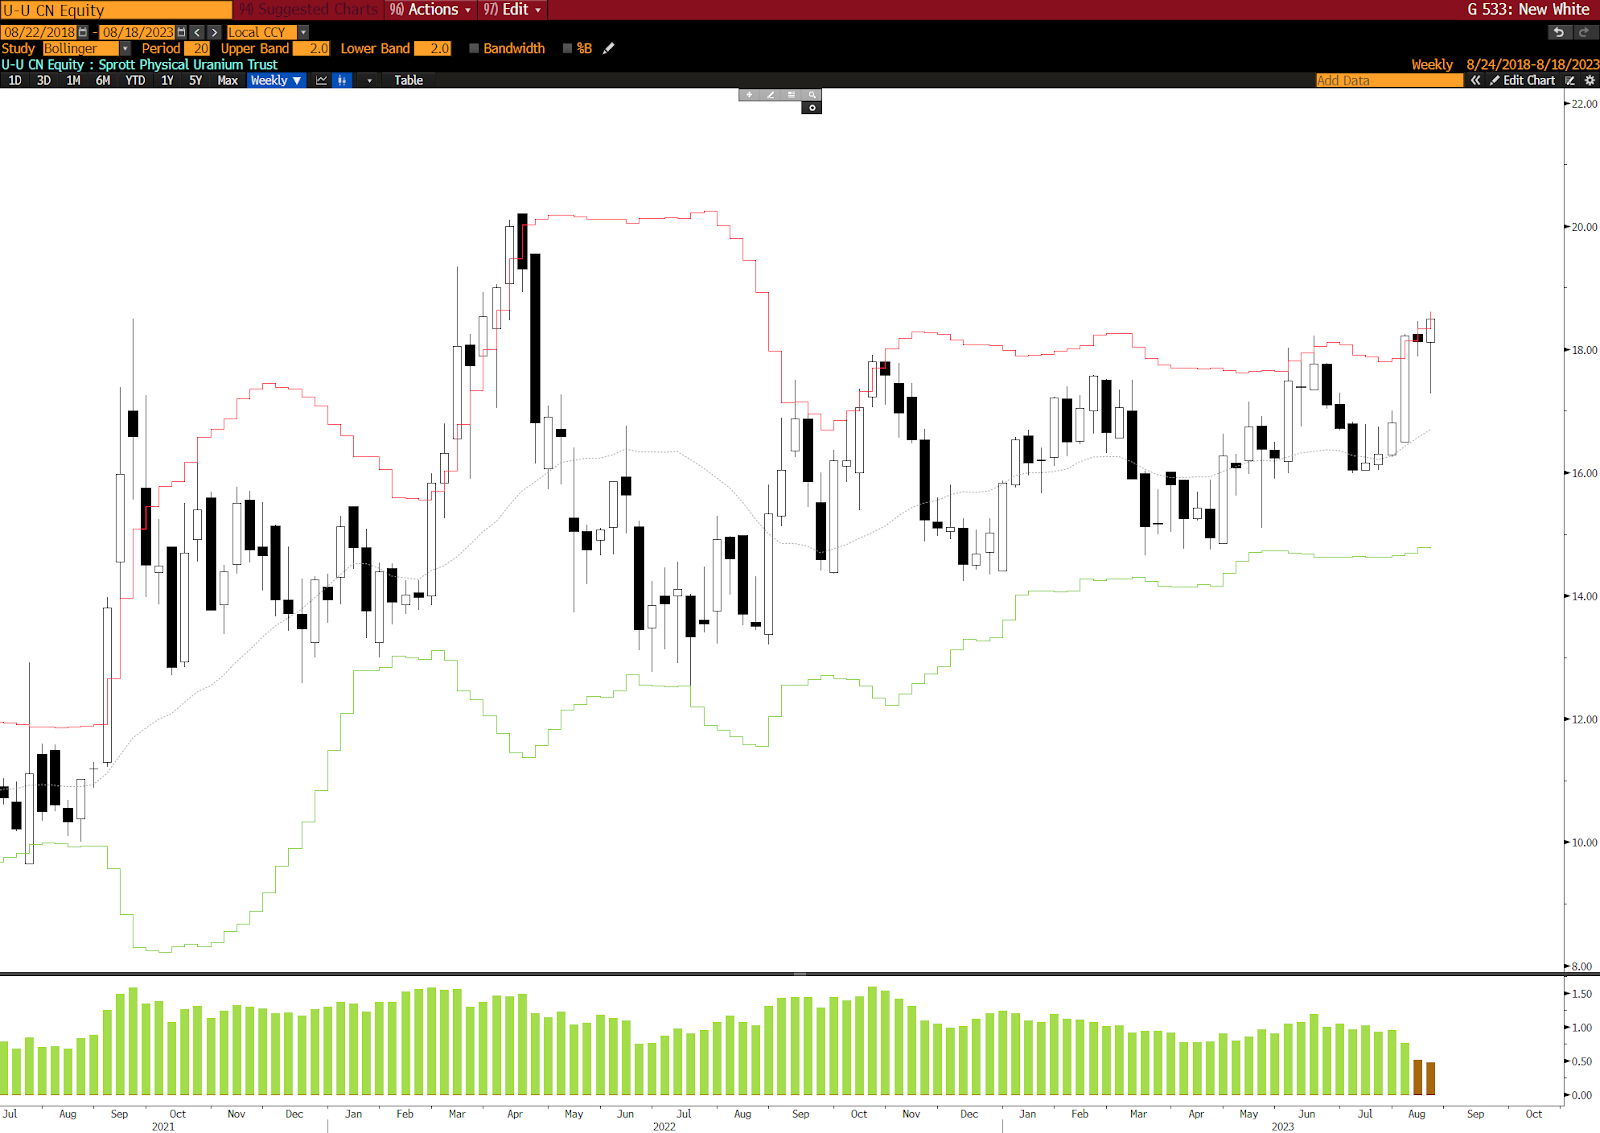
12. The Sprott Uranium Trust (U.UN), one of our larger equity positions at the moment, is looking like it’s about to break out from its multi-year consolidation zone.
Thanks for reading.


