Current Systematic Positioning:
- Long S&P 500 ($ES Emini Futures)
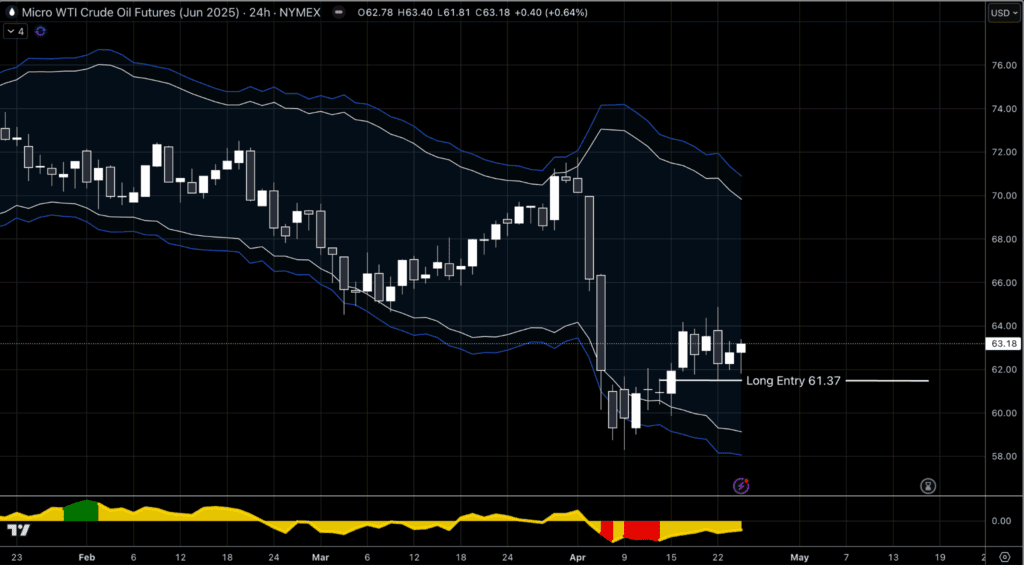
- Long Crude ($CL Futures)
- Long Mexican Peso ($6M Futures)
- Long Soybeans ($ZS Futures)
- Short Corn ($ZC Futures)
- Long Bitcoin (BTCUSD Spot)
This week we were finally pulled into a long S&P 500 position after waiting for a week to be filled. I wrote about the trade all the way back on April 9th and you can read more about it here.
Suffice it to say, we were very lightly positioned heading into the market selloff holding a large cash position. The past few weeks volatility had dropped and a number of our systems started entering the market again.
This is the largest positioning we’ve had in the Quant book all year.
While the S&P 500 took a >-21% drawdown off the highs and about -18% drawdown on the year, we outperformed the index with barely any drawdown.
Current Performance:
- Macro Ops Portfolio: +9.03% year to date
- S&P 500 Index: -6.06% year to date
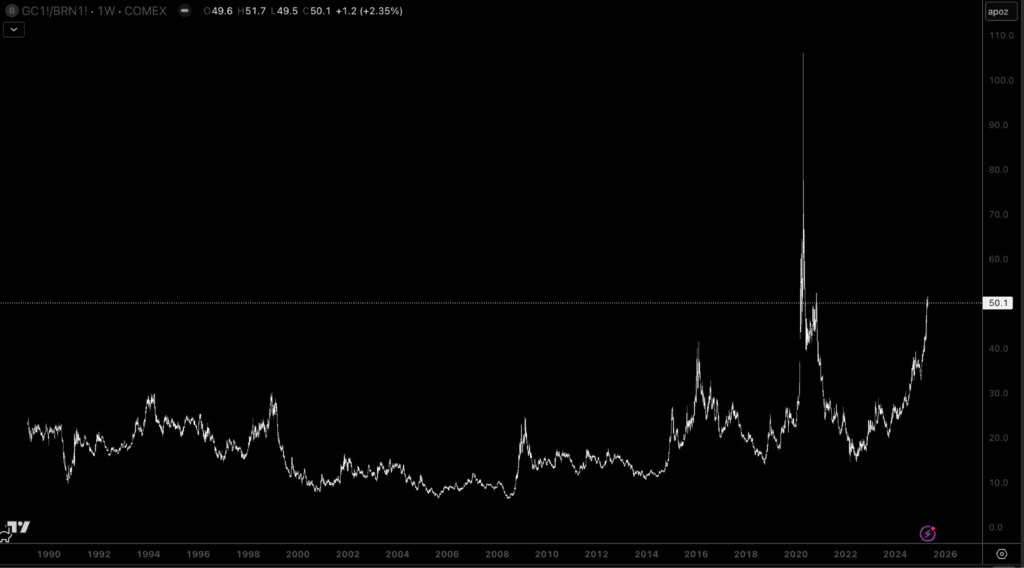
The Gold-to-Oil Ratio Just Hit a Critical Level
The gold-to-oil ratio has recently crossed above 30 barrels of WTI crude oil per ounce of gold, marking a significant threshold not seen since the banking crisis of March 2023. Historically, this isn’t just an arbitrary figure, it’s a key indicator of global economic stress and potential market shifts.
I posted about it on X earlier this week, and I got a lot of interest in it. So I’ll dig a bit deeper today.
The gold-to-oil ratio measures how many barrels of crude oil one ounce of gold can buy. Historically, a high ratio indicates gold’s outperformance, often signaling heightened fear in financial markets, while a low ratio typically signals confidence in economic growth and robust industrial demand.
When this ratio has surged past critical levels, such as during the 2008 Financial Crisis, the COVID-19 Pandemic in 2020, and the recent banking crisis in early 2023,it has often preceded substantial market volatility, economic slowdowns, and significant policy interventions.
- 2008 Financial Crisis: The gold-to-oil ratio spiked dramatically, indicating deep global economic distress. This move preceded sharp downturns in equities and commodities.
- COVID-19 Pandemic (2020): The ratio again jumped as oil prices collapsed and investors rushed into gold as a safe haven. Equity markets faced severe downturns followed by substantial stimulus-driven rebounds.
- Banking Crisis (March 2023): The recent spike correlated with banking stress, prompting investors to seek safety in gold amidst liquidity concerns.
Today’s elevated gold-to-oil ratio occurs amid rising geopolitical tensions, including conflicts in the Middle East, disruptions in global energy markets, and persistent inflationary pressures coupled with recession fears. With oil prices facing volatility due to potential supply shocks and gold rallying on safe-haven demand, the ratio could be signaling a deeper underlying fragility.
For investors, a rising gold-to-oil ratio can suggest:
- Potential downside risks for equities: Particularly energy and cyclical sectors vulnerable to economic slowdown.
- Opportunity in precious metals: Gold and silver often benefit during high ratio periods, serving as effective hedges against market turbulence.
- Commodity trading opportunities: Pair trades, such as long gold/short oil strategies, can be particularly effective.
Given the macroeconomic backdrop, the current spike could persist or intensify.
In the Collective we’ve already entered our first leg of this trade via a June Crude Oil long at 61.58 on April 15th.
Gold reacted immediately after I put out that post on X, which I’m not taking credit (or blame) for.
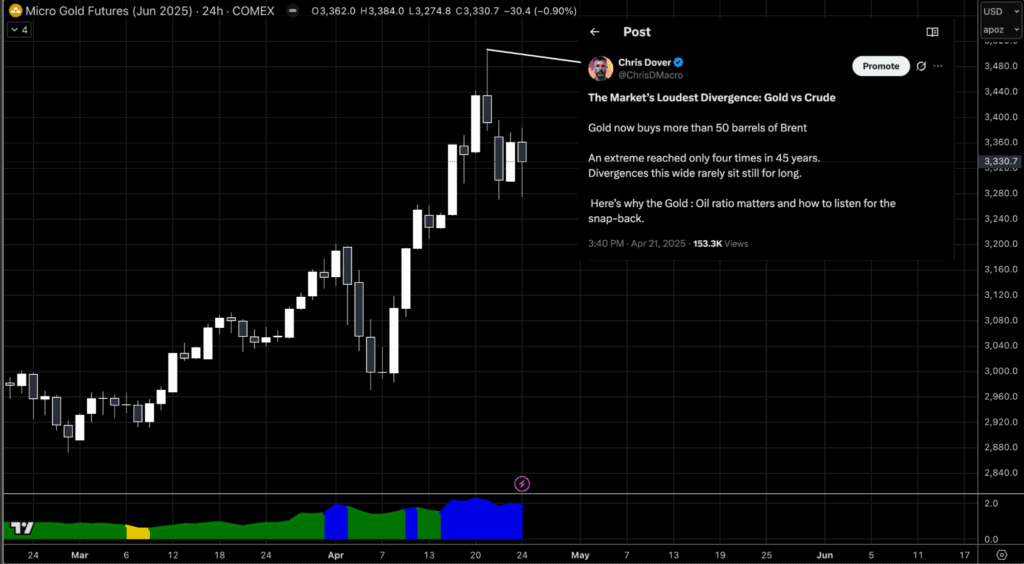
The SQN Indicator (the histogram on the bottom of the chart) indicates that Gold is in the Bull Volatile regime, and this is commonly where 10%+ corrections happen. Gold is a little less than -7% since the peak here, so there is a little more room to go lower.
There is a Curvy short setup on Gold, and I expect to be pulled into the gold portion of this trade this week.
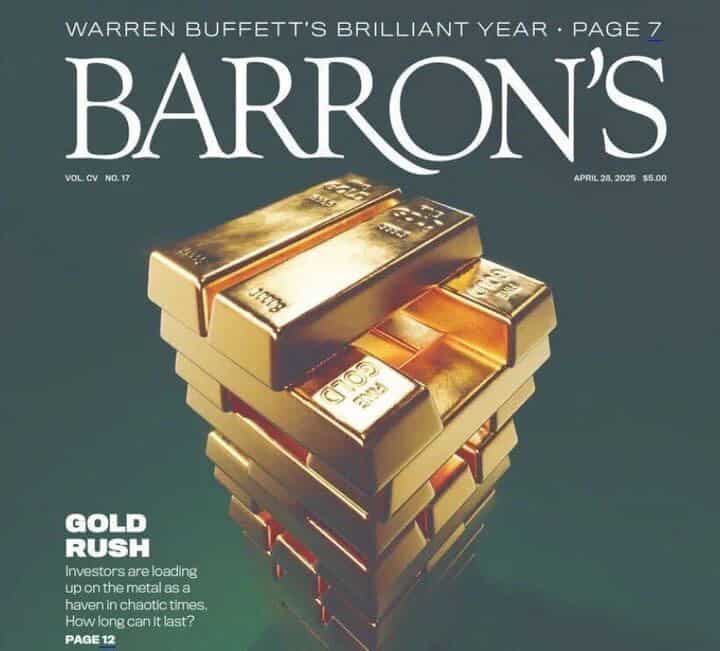
Not that I trade base on the old “Barron’s Front Page Sell Signal”, but here we are.
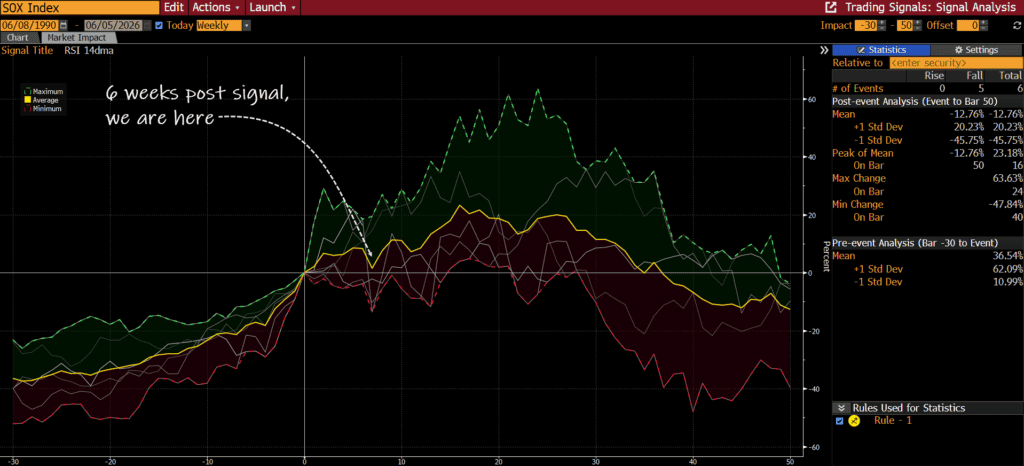
The crypto market is signaling a powerful new bull market. Our proprietary crypto momentum system just triggered a buy signal, an event with a track record of predicting major market moves with remarkable accuracy.
The way I approach Crypto trading is not your typical HODL’er crypto freak show.
It’s simply an asset class I trade, and have been trading now for over a decade.
I get in when the market is performing to my model, and get out when it’s not.
The last time we had this buy signal was October 2023, which signaled the beginning of the crypto bull market.
Bitcoin was at about 25k then. Today we’re inching back up near 100k.
The new bull market signal (the crypto momentum system) for crypto, just fired long this past week.
Our crypto momentum system leverages quantitative analysis to detect shifts in market sentiment and momentum. This systematic approach isolates optimal entry and exit points for the bull market itself, and gets us in on the strongest phases of crypto bull markets.
The recent buy signal is not trivial, historically, this indicator has pinpointed the onset of substantial bull markets:
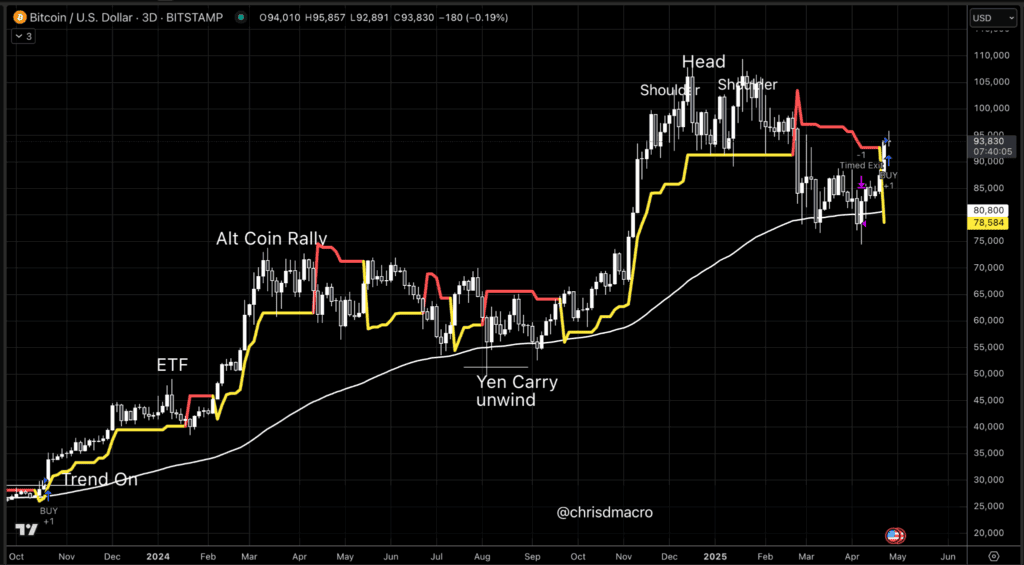
October 2023 Signal: Bitcoin at approximately $25,000. The subsequent move saw Bitcoin surge nearly 4x to its recent peak above $95,000.
Previous Bull Markets (2014, 2017, 2020): Each signal preceded multi-month rallies that generated extraordinary gains across various crypto assets.
Several catalysts underpin the new bull market:
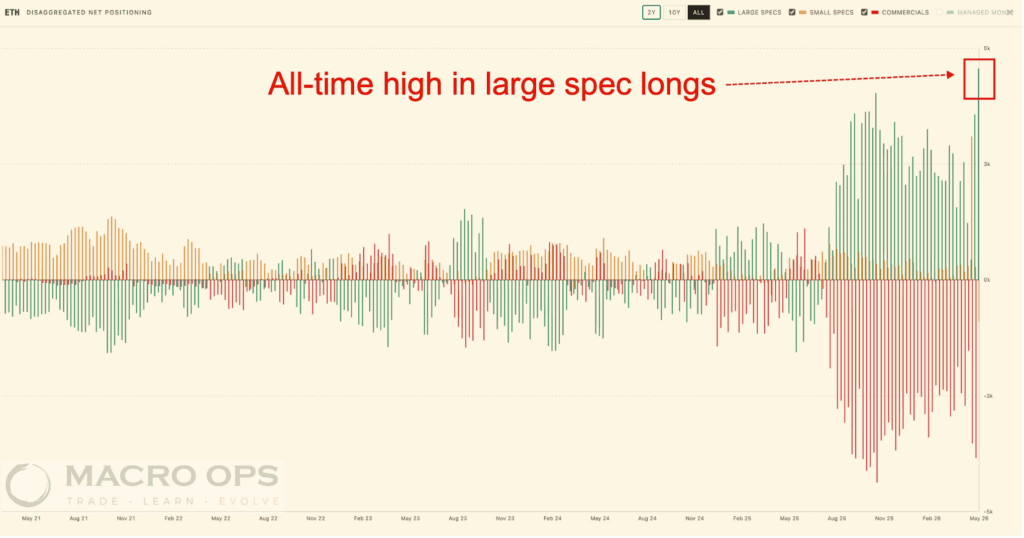
- Institutional Adoption: Major financial institutions continue adding Bitcoin to their balance sheets, signaling mainstream acceptance and confidence in crypto’s long-term potential.
- ETFs and Institutional Inflows: The recent approval and substantial inflows into Bitcoin and Ethereum ETFs have introduced a fresh wave of institutional liquidity.
- Global Economic Uncertainty: Amid ongoing macroeconomic instability and traditional market volatility, crypto assets have gained traction as viable hedges and portfolio diversifiers.
With this momentum system buy signal, we believe the crypto market is positioned for significant upside:
Bitcoin: Leading the rally, the cornerstone cryptocurrencies offer robust liquidity and substantial growth potential. It is the key asset to the entire asset class.
After a strong bull run in Bitcoin, this creates demand for risk and it spills out into the other sectors in Crypto.
And this is where the biggest opportunity is…
Altcoin Opportunities: Smaller-cap altcoins typically outperform in crypto bull markets, presenting opportunities for outsized returns.
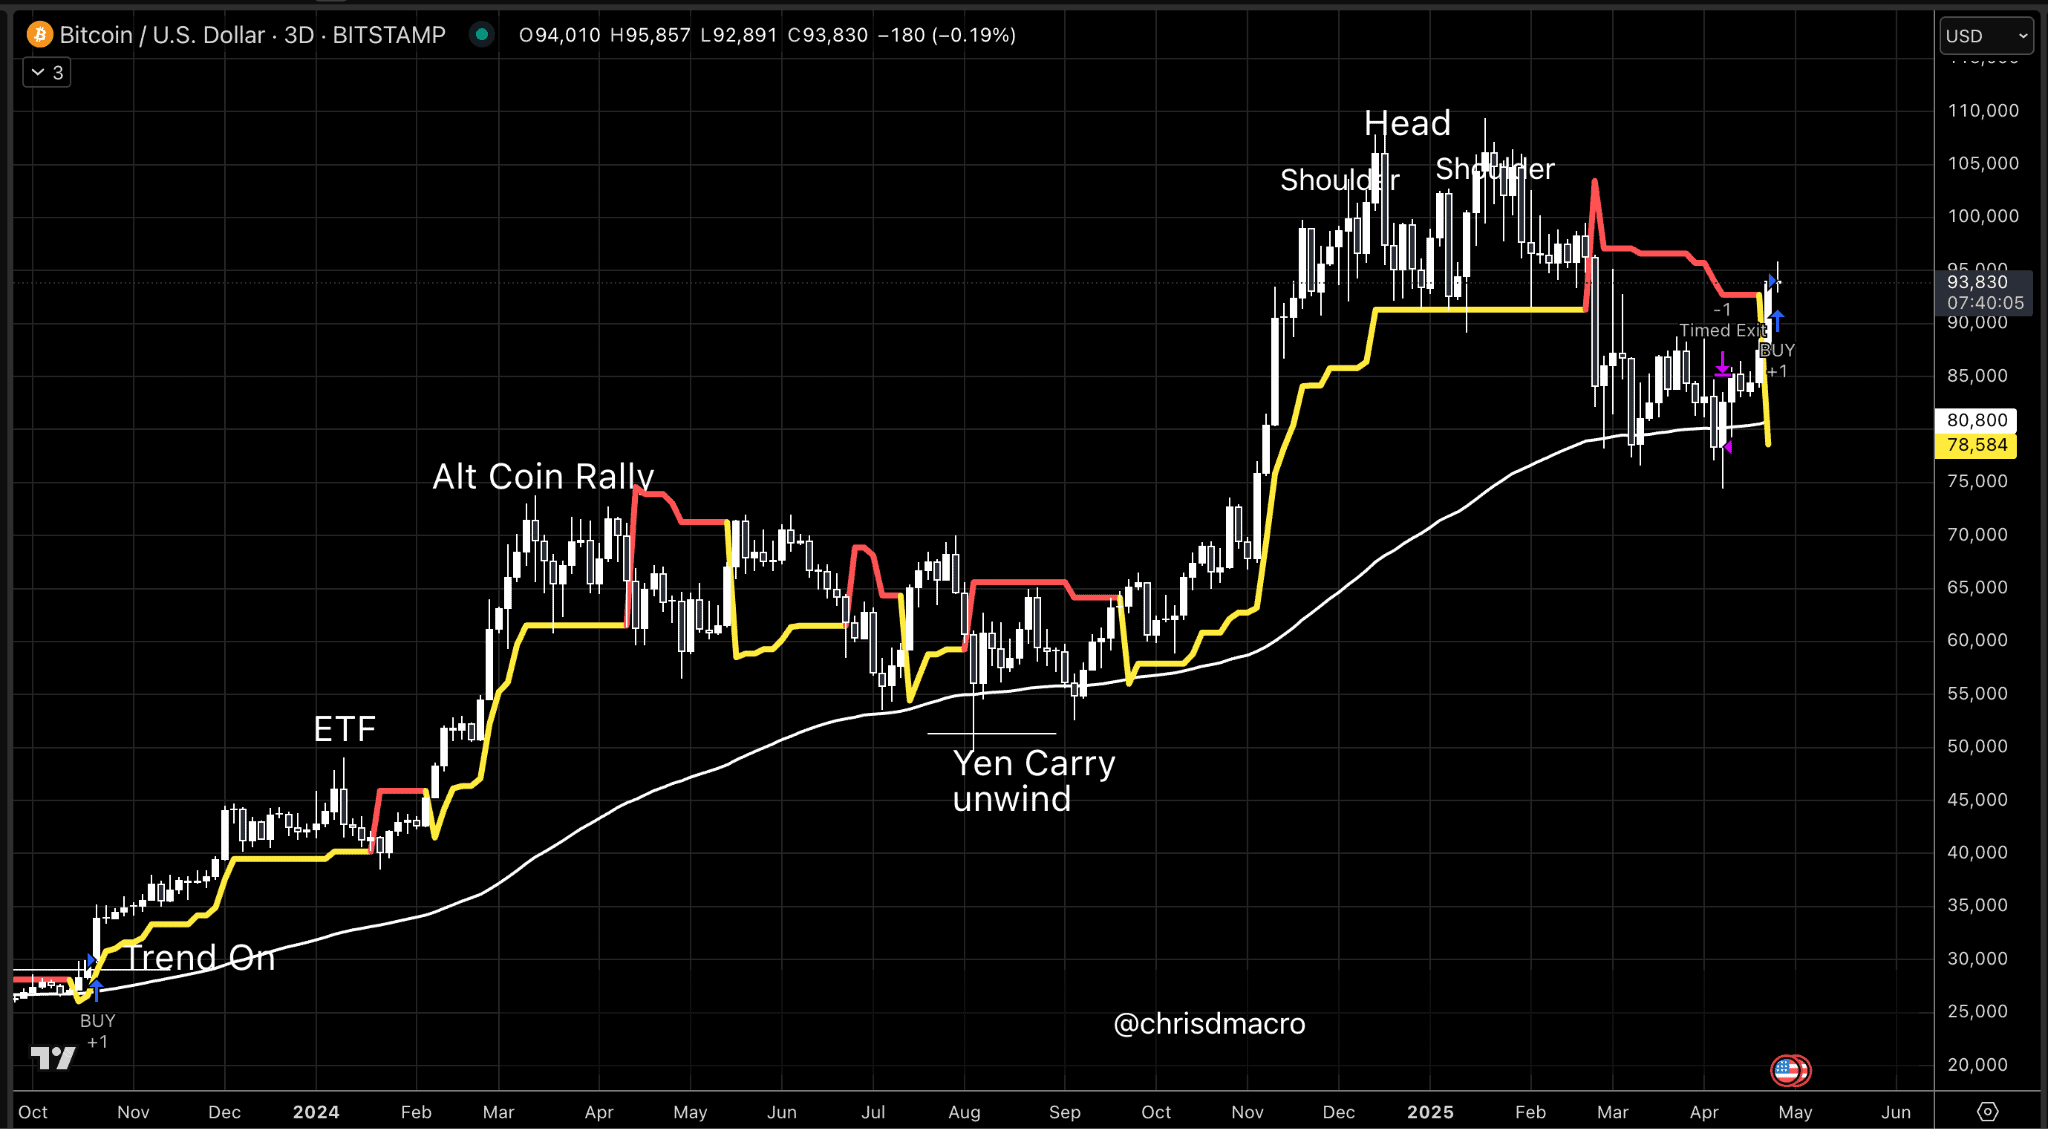
We rotated into altcoins in March/April 2024 catching multiple 300%+ rallies in AI, Real World assets and other sectors that exploded higher in less than a month.
The system got us in, and got us out when it was over.
Then again heading into the US Presidential election, we started scaling into Alt Coins in September, and our system got us out at the peak of the market in December.
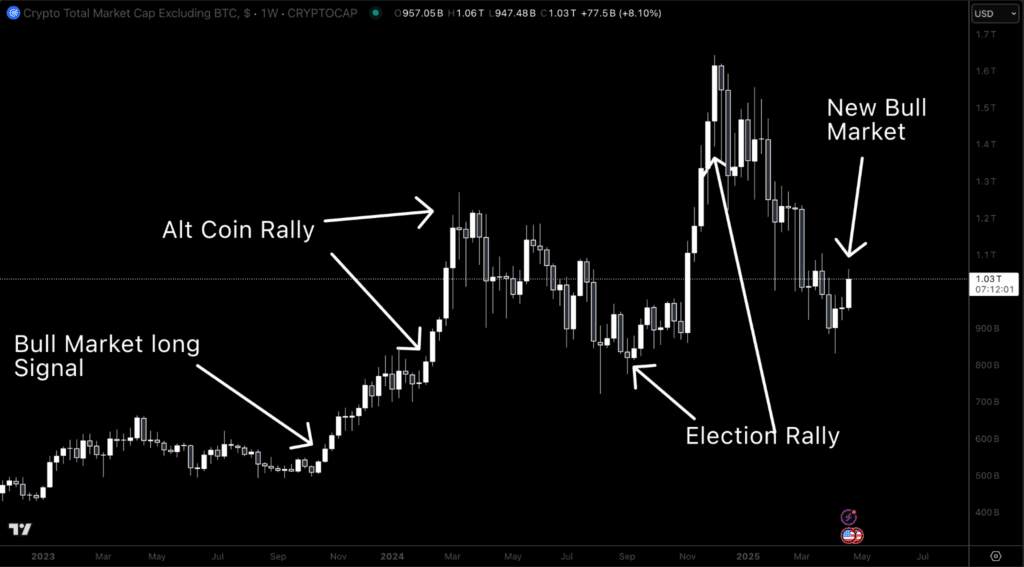
Risk Management: Our system strategically identifies optimal points to scale in and out, managing downside risks while maximizing returns.
Here’s how Bitcoin performed during the last bull market.
The current market environment represents a rare opportunity. Our momentum system provides a proven approach to navigating crypto’s volatility, maximizing profit potential while carefully managing risk.
Join us to ride the next big wave in crypto:
→ Join the Crypto Momentum System ←
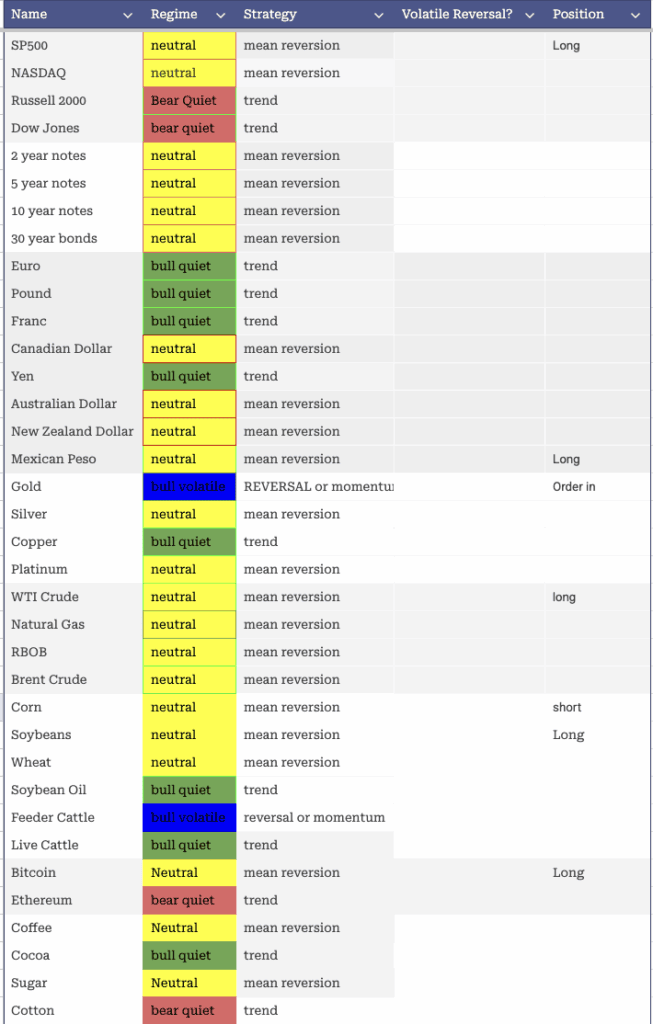
Market Regimes
Setups for next week
We are pretty well positioned in the Quant book now, there’s only one trade I’m seeing with a potential entry.
Gold is set up for a mean reversion move lower. We will likely get pulled into the trade, if there is indeed any weakness, if not, no trade.
If you are interested in the strategies that I use.
And you can work with me on building out your trading business in the Trading Thunderdome (we’re starting a new cohort next week).