It takes a huge investment in introspection to learn that the thirty or more hours spent “studying” the news last month neither had any predictive ability during your activities of that month nor did it impact your current knowledge of the world. ~ Nassim Taleb, “Fooled By Randomness”
In this week’s Dirty Dozen [CHART PACK], we look at monthly charts, talk about the good and bad of market technicals, the economy, and policy trade offs. We end with a look at coiling crude and a small-cap E&P that’s ready to run, plus more…
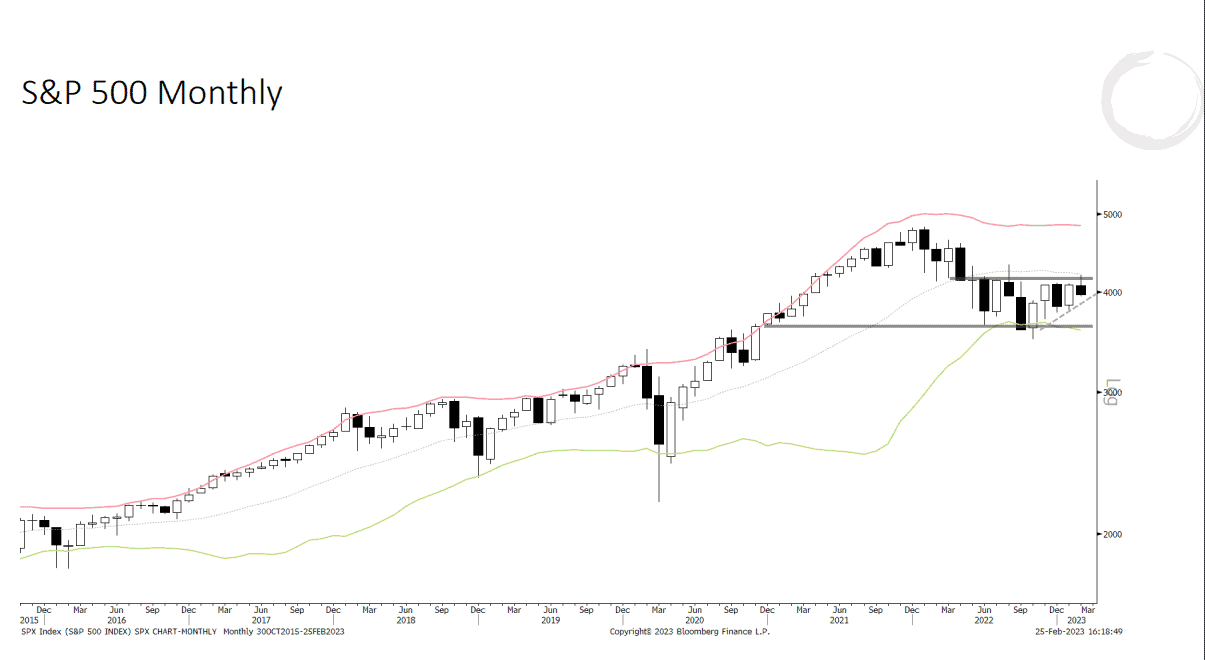
- Two days left… The SPX has only two trading days left in the month to see if it can turn its monthly bar around and close in the green. As of now its not looking so good. Also, the chart is coiling in a tight 10-month range. Compression regimes lead to expansionary ones (aka. Big trends).
We’re fairly neutral in our short-to-intermediate term outlook. So we’ll wait for the market tip its hand on this one. Bonds will be the tell. If they can’t hold a line, then neither will stocks.
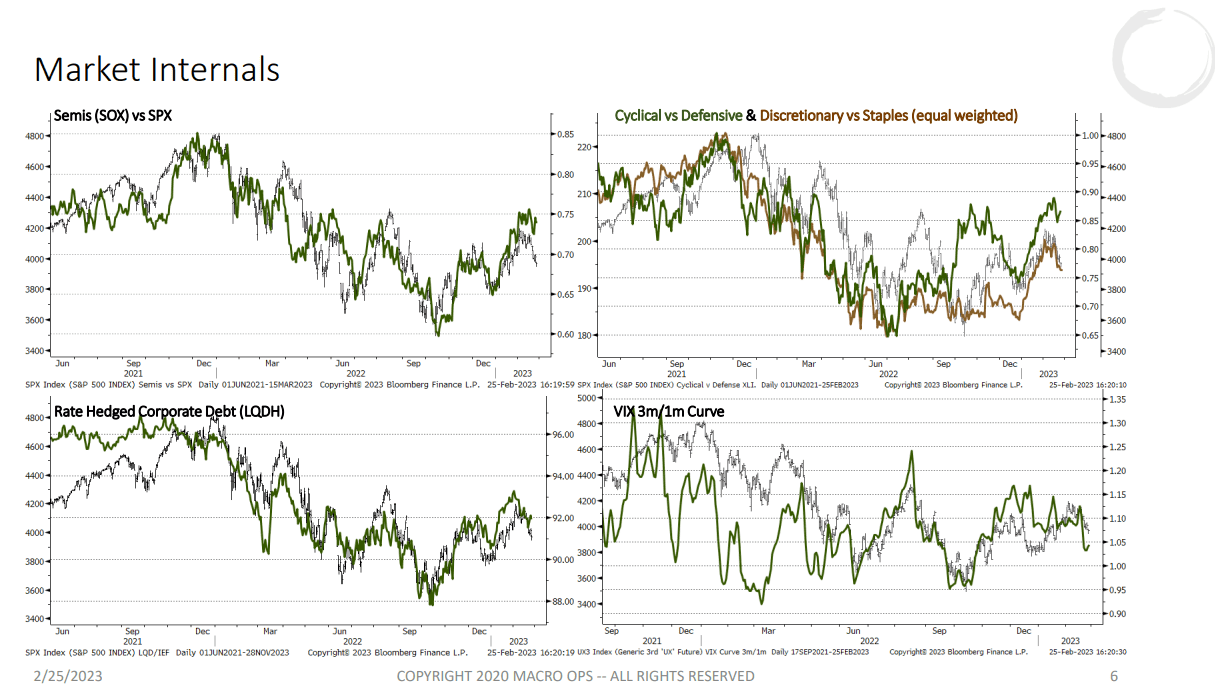
- Not all bad though… Key internal leads continue to hold up well. Typically we’d see cyclicals, semis, corporate debt, etc… underperform on a relative basis if we are in fact about to start another leg lower. And that’s just not happening, yet.
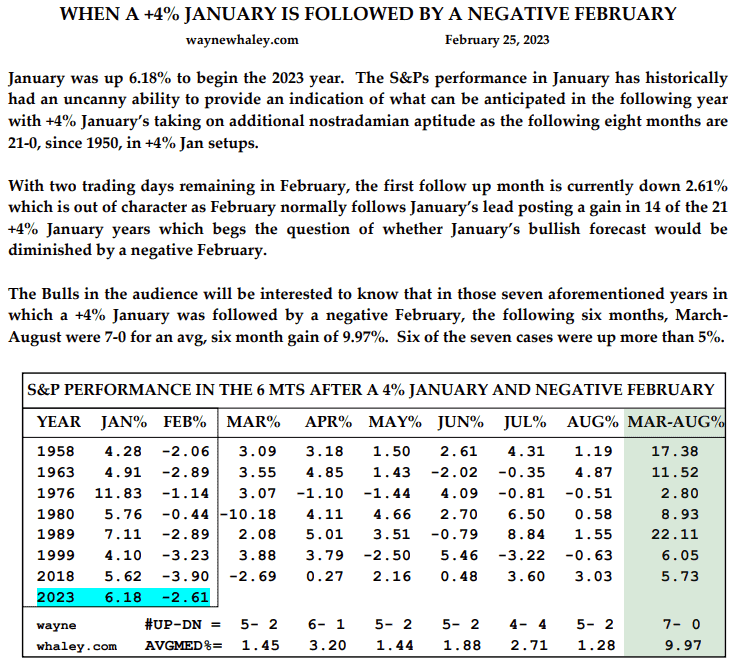
- When negative is positive… The veteran market technician Wayne Whaley posted this study to the twitters last week. It looks at the market’s historical tendencies when a +4% January return is followed by a negative February.
His findings: The seven other instances saw positive gains over the following six month period, with a six month average gain of 9.97%.
Reminder, these types of studies aren’t predictive, just descriptive. The future can and will look different. But if you’re halfway to going full Harry Dent, studies like these should at least make you check your priors.
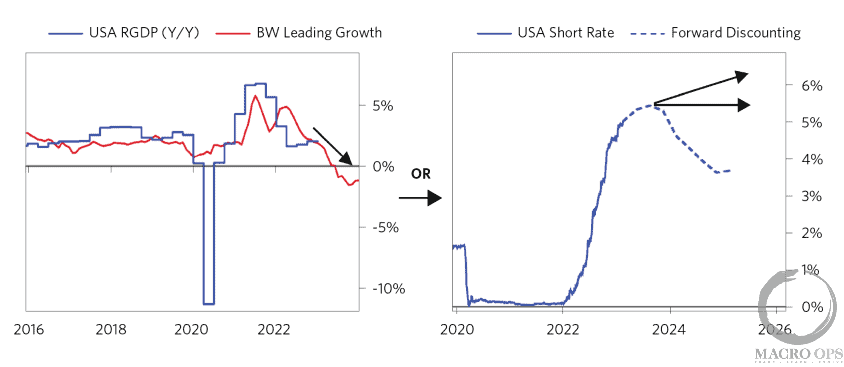
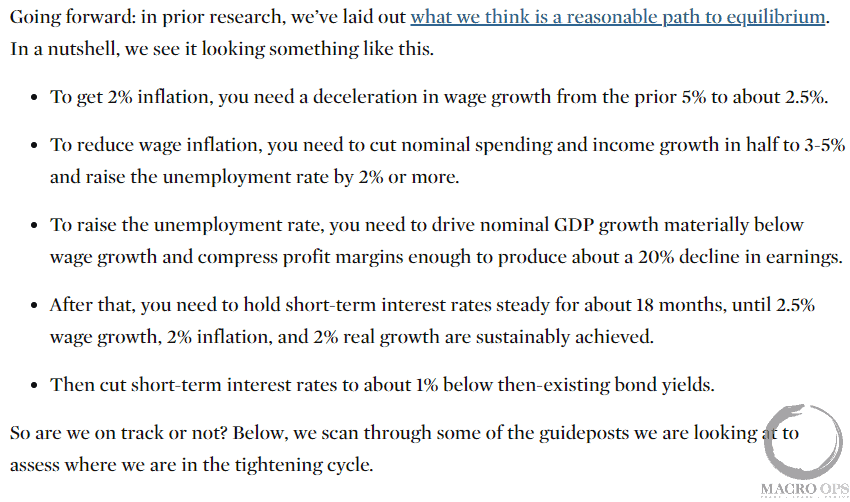
- Two options: Bad and badder… Bridgewater continues to pound the higher for longer rates table (Dalio is obviously a big fan of MO’s work). Their recent report with the riveting title “The Tightening Cycle Is Approaching Stage 3: Guideposts We’re Watching” states the following:
“Given current conditions and the cause/effect linkages, odds favor that there will be a third stage and that it will mostly likely take the form of an economic downturn. And if that doesn’t happen, inflation is likely to remain above central bank targets, prompting a continued rise in short-term interest rates or at least a period of sustained higher interest rates than what the markets are now discounting. As an illustration, odds favor the below left chart, and if not that, then the below right chart, and maybe both.”
- Kill Joy… Here is what BW thinks needs to happen in order to obtain a more stable equilibrium. And FWIW, we agree with them.
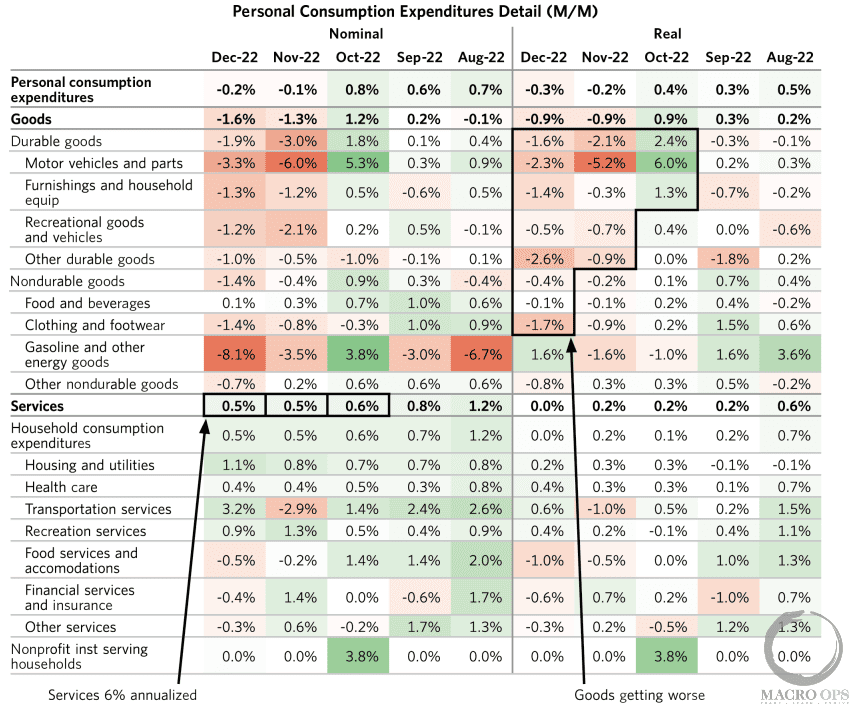
- The Great Conversion… Nominal demand for goods is still above its pre COVID trend, while services are a hair below. But these two are finally starting to converge at a quicker pace. And as BW notes, this convergence has implications as greater spending on services puts upward pressure on wages and employment (makes wages stickier), while weaker demand for goods has a greater impact on corporate revenues. So not a great mix for bulls.
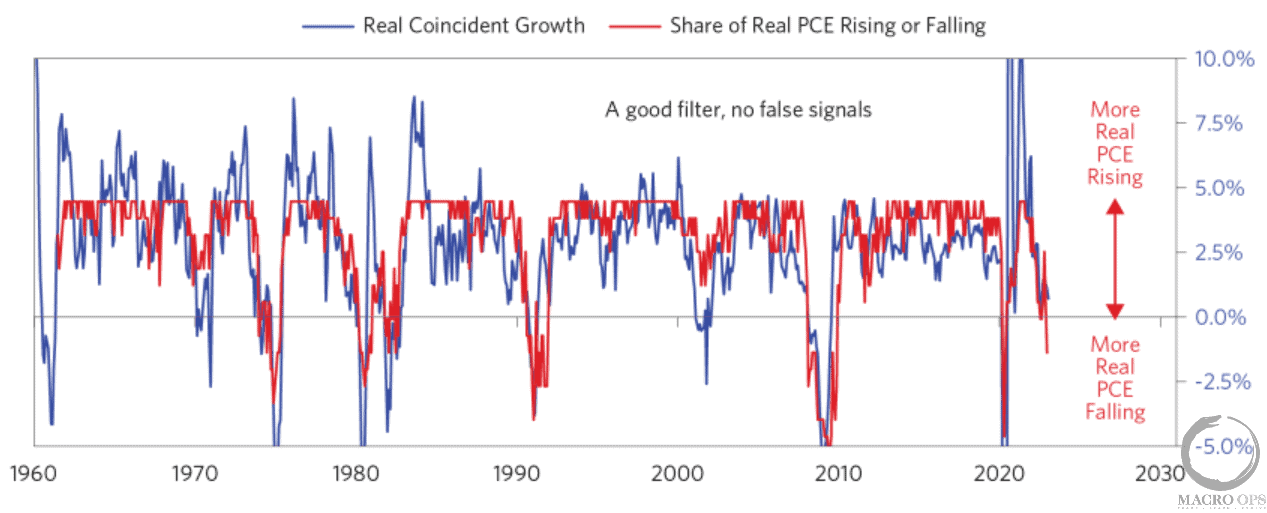
- End on a positive note… BW’s diffusion index of monthly real PCE goods demand (chart below, red line), has a decent record predicting inbound recessions (it’s 100%).
BW writes, “since 1960, in each of the prior cases that the diffusion index was negative, there was a contraction in growth. On the other hand, when growth dropped negative but the diffusion index was positive, the apparent downturn quickly reversed. The diffusion index recently breached the zero line for only the seventh time since 1960 — another indication that we’re headed for a third stage of the tightening cycle.”
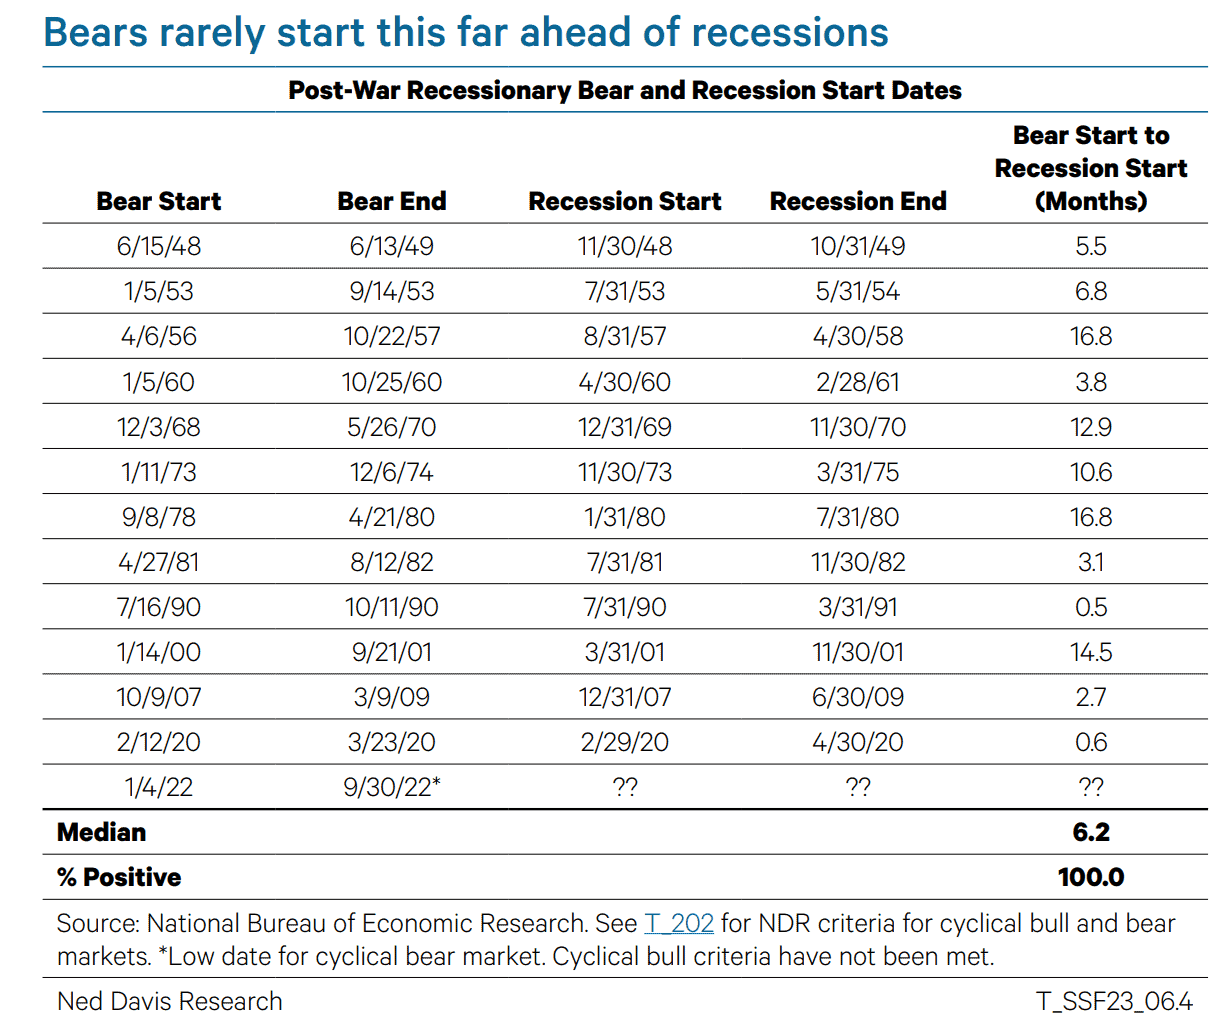
- Not so fast… NDR’s @edclissold shared this thread last week. At first, it reads as if he’s in the recessionary bear camp. But…
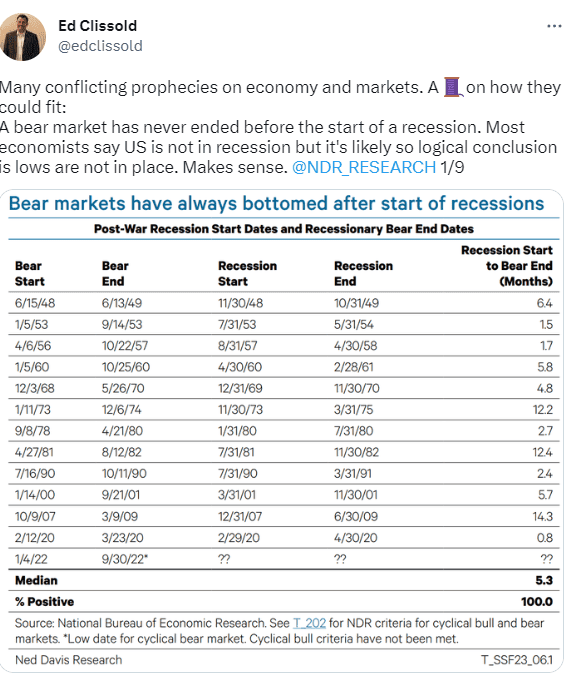
- Too soon… Clissold goes onto explain that “Bears start a median of 6 months before recessions. Longest is 17M (1956 & 1978). Recent data imply a recession is not imminent. If recession is pushed to late 2023 or 2024 there is no precedent for staying in a bear that long.”
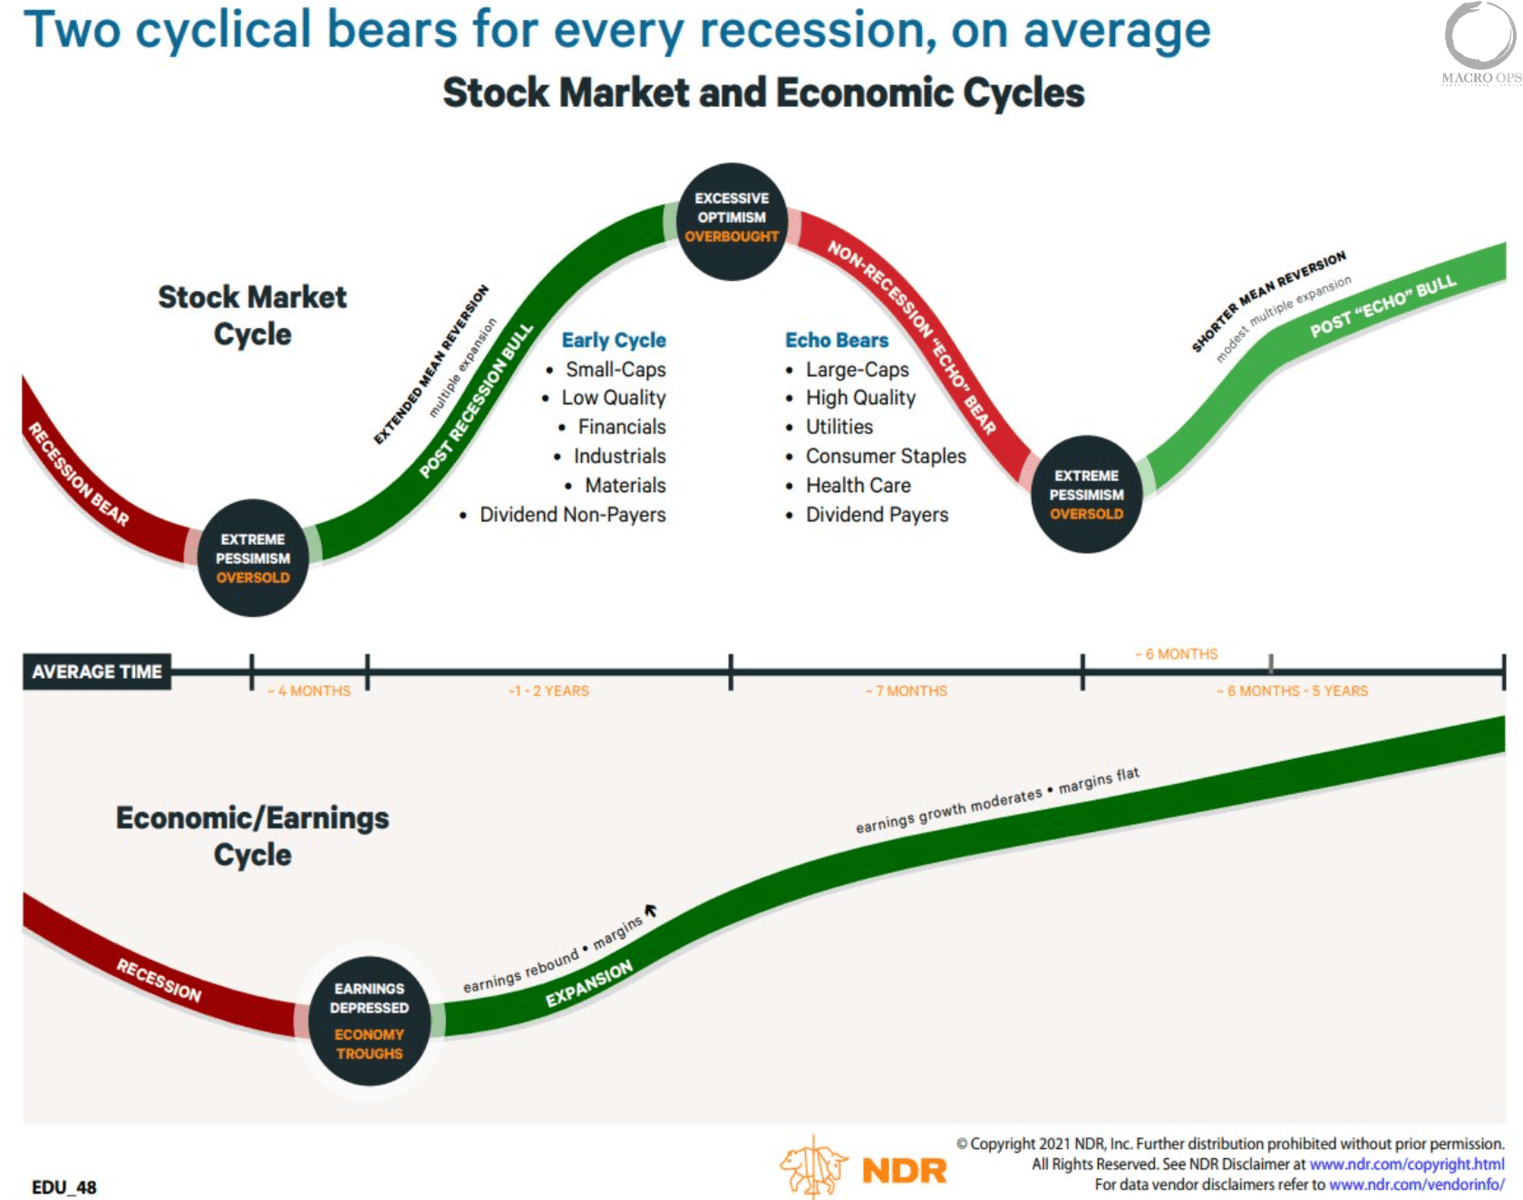
- Two for one… Ed points out that its typical for the market to experience two cyclical bears for every recession. And that “the 2022 bear ~2yrs into the expansion and is close to the average echo bear. Perfectly normal cycle behavior!”
If this week’s Dozen has muddied the waters for you, good. That was the point. There are times to have conviction and there are times for patience and balance (balanced risks and exposures). Now is the latter.
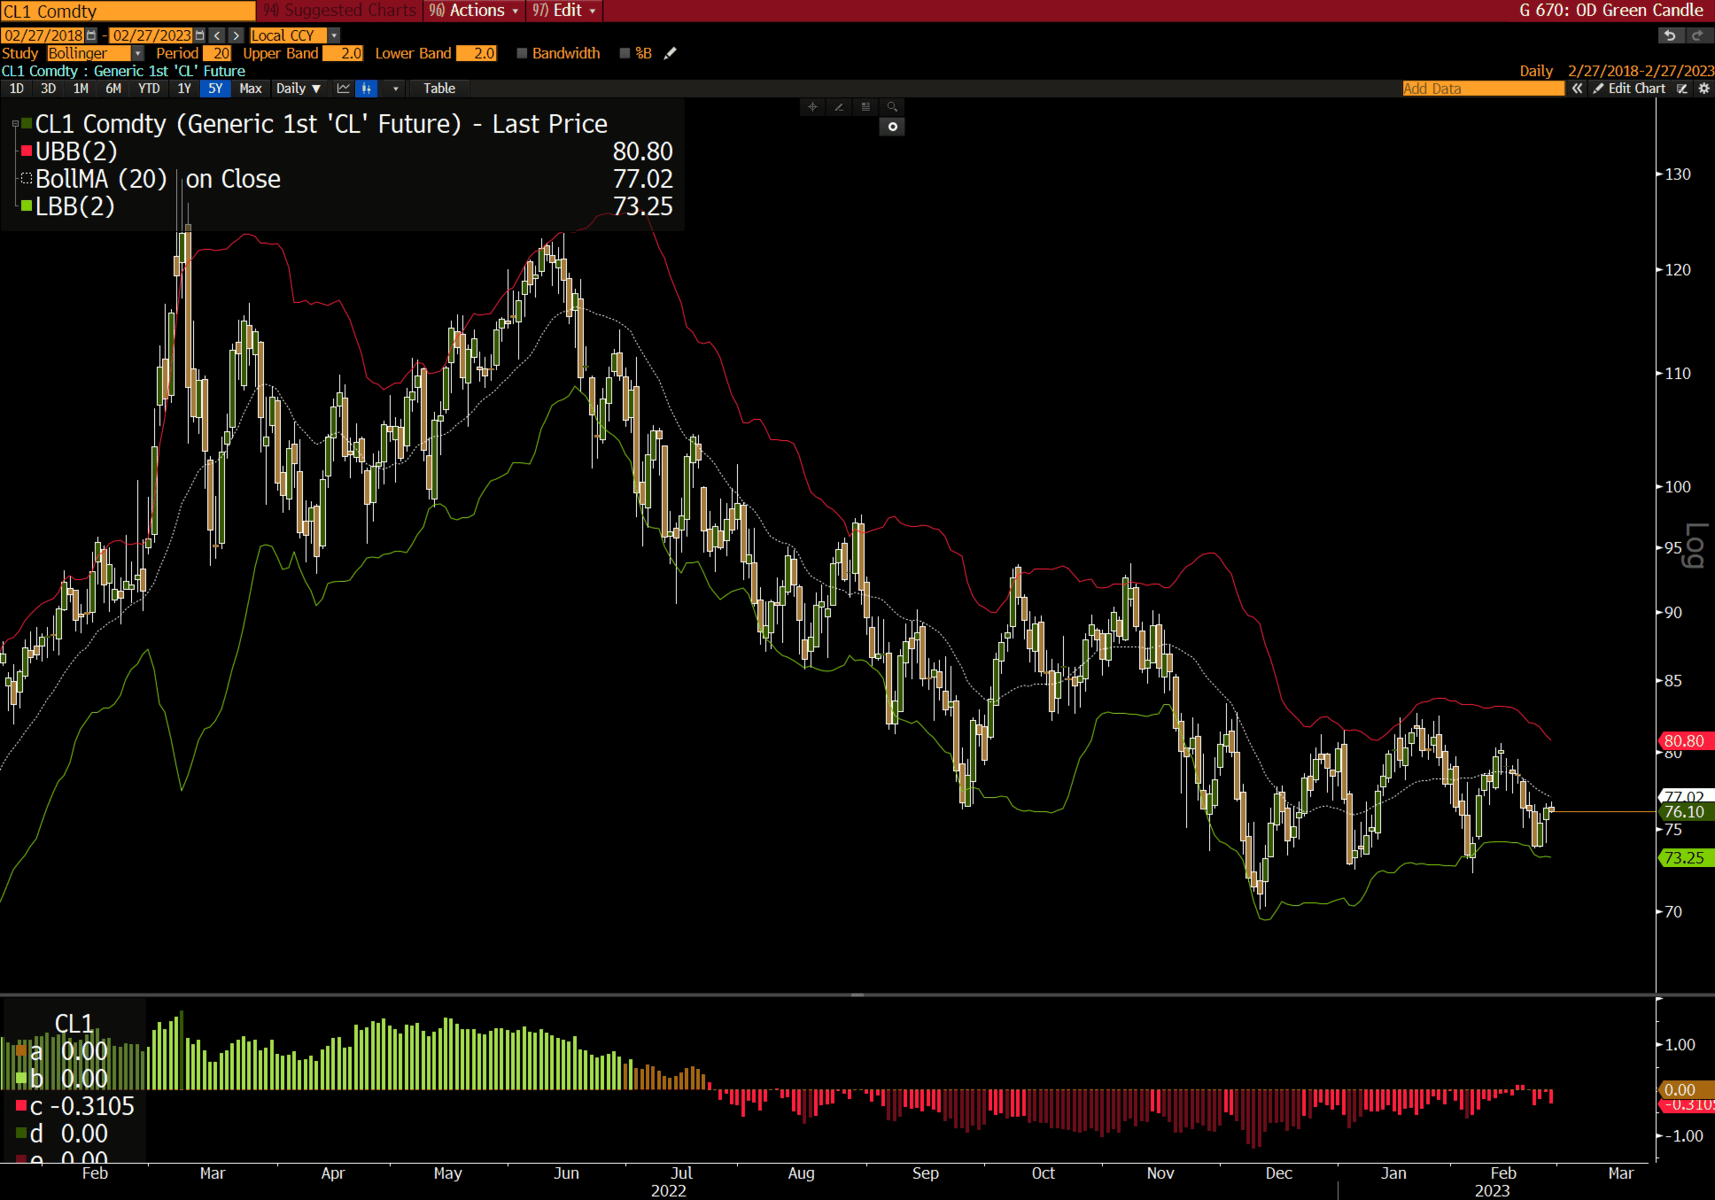
- Crude coil… a big move in oil is coming. You don’t need to know whether its up or down. It’s okay to have your biases (I do) but the money is made on the trade, not your prediction of the trend. We’re watching this one for a break and we’ll play in size when we get the signal.
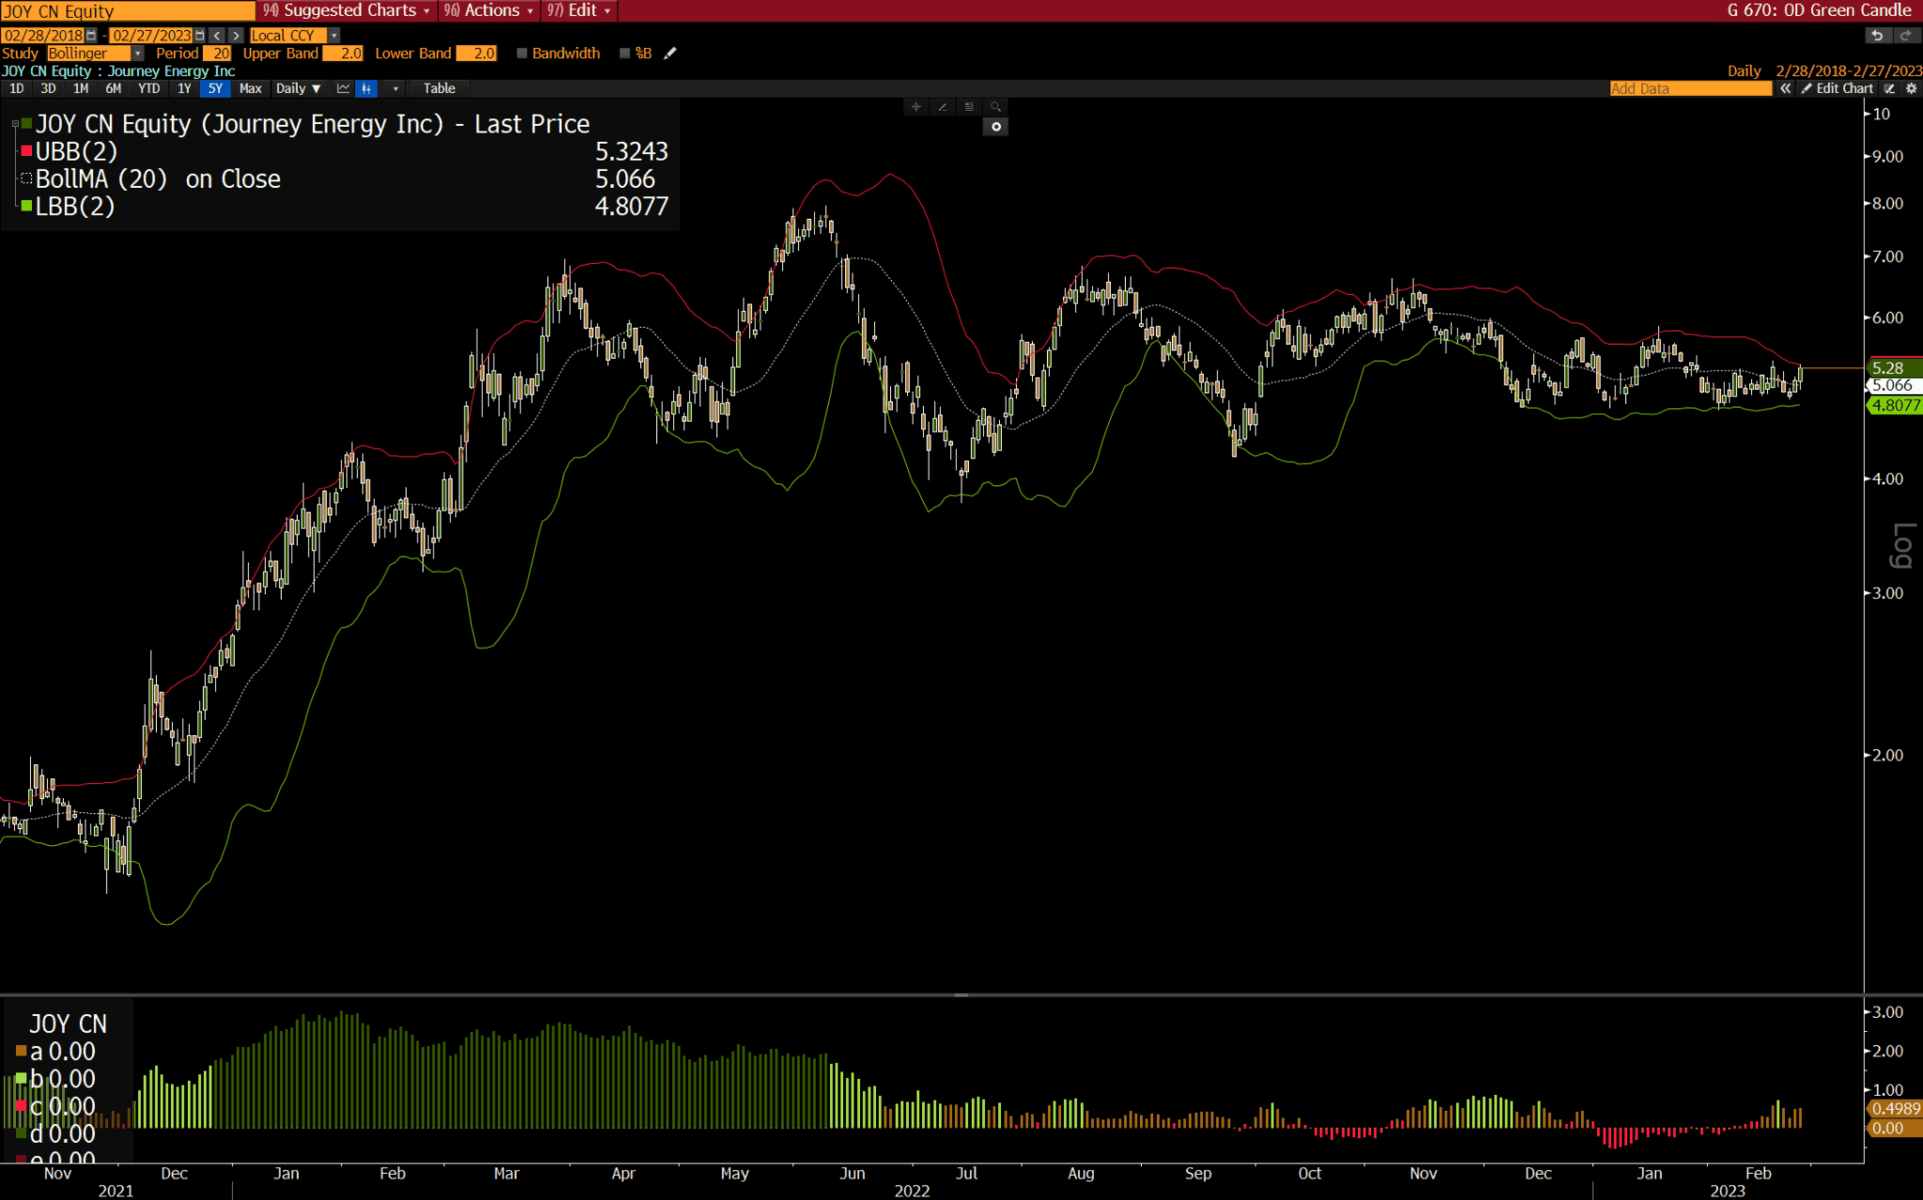
- Gas up… Energy names have held up well despite gas’s violent about face over the past 6-months along with the sideways shuffle in crude.
I like SD, TDW (which we own), and JOY which is featured below. Josh Young of Bison Interest has a good SA writeup which you can find here.
Thanks for reading.
Stay frosty and keep your head on a swivel.


