“This company looks cheap, that company looks cheap, but the overall economy could completely screw it up. The key is to wait. Sometimes the hardest thing to do is to do nothing.” ~ David Tepper
In this week’s Dirty Dozen [CHART PACK], we look at disappointing cyclical breadth, deteriorating SPX and sector margins, bearish positioning amongst small speculators, general sentiment that’s quick to flip, a long Ag, crypto, and metals setup, plus more…
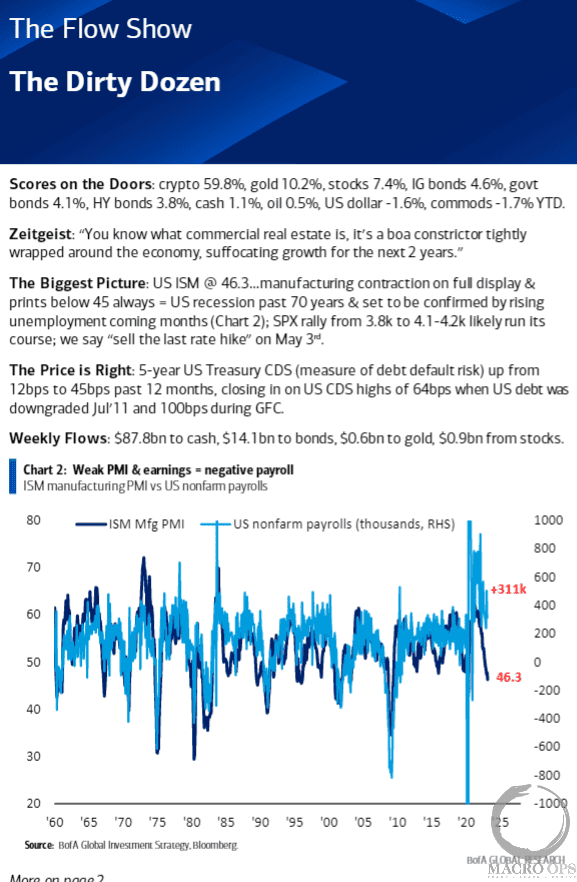
- This is a bit meta but here’s the BofA’s Flow Show summary titled “The Dirty Dozen” brought to you by the Dirty Dozen. The report showed 12 charts indicating we’re in/entering a recession. I strongly believe a recession is coming but that it’s a 2nd half thing as this econ still has some momentum behind it.
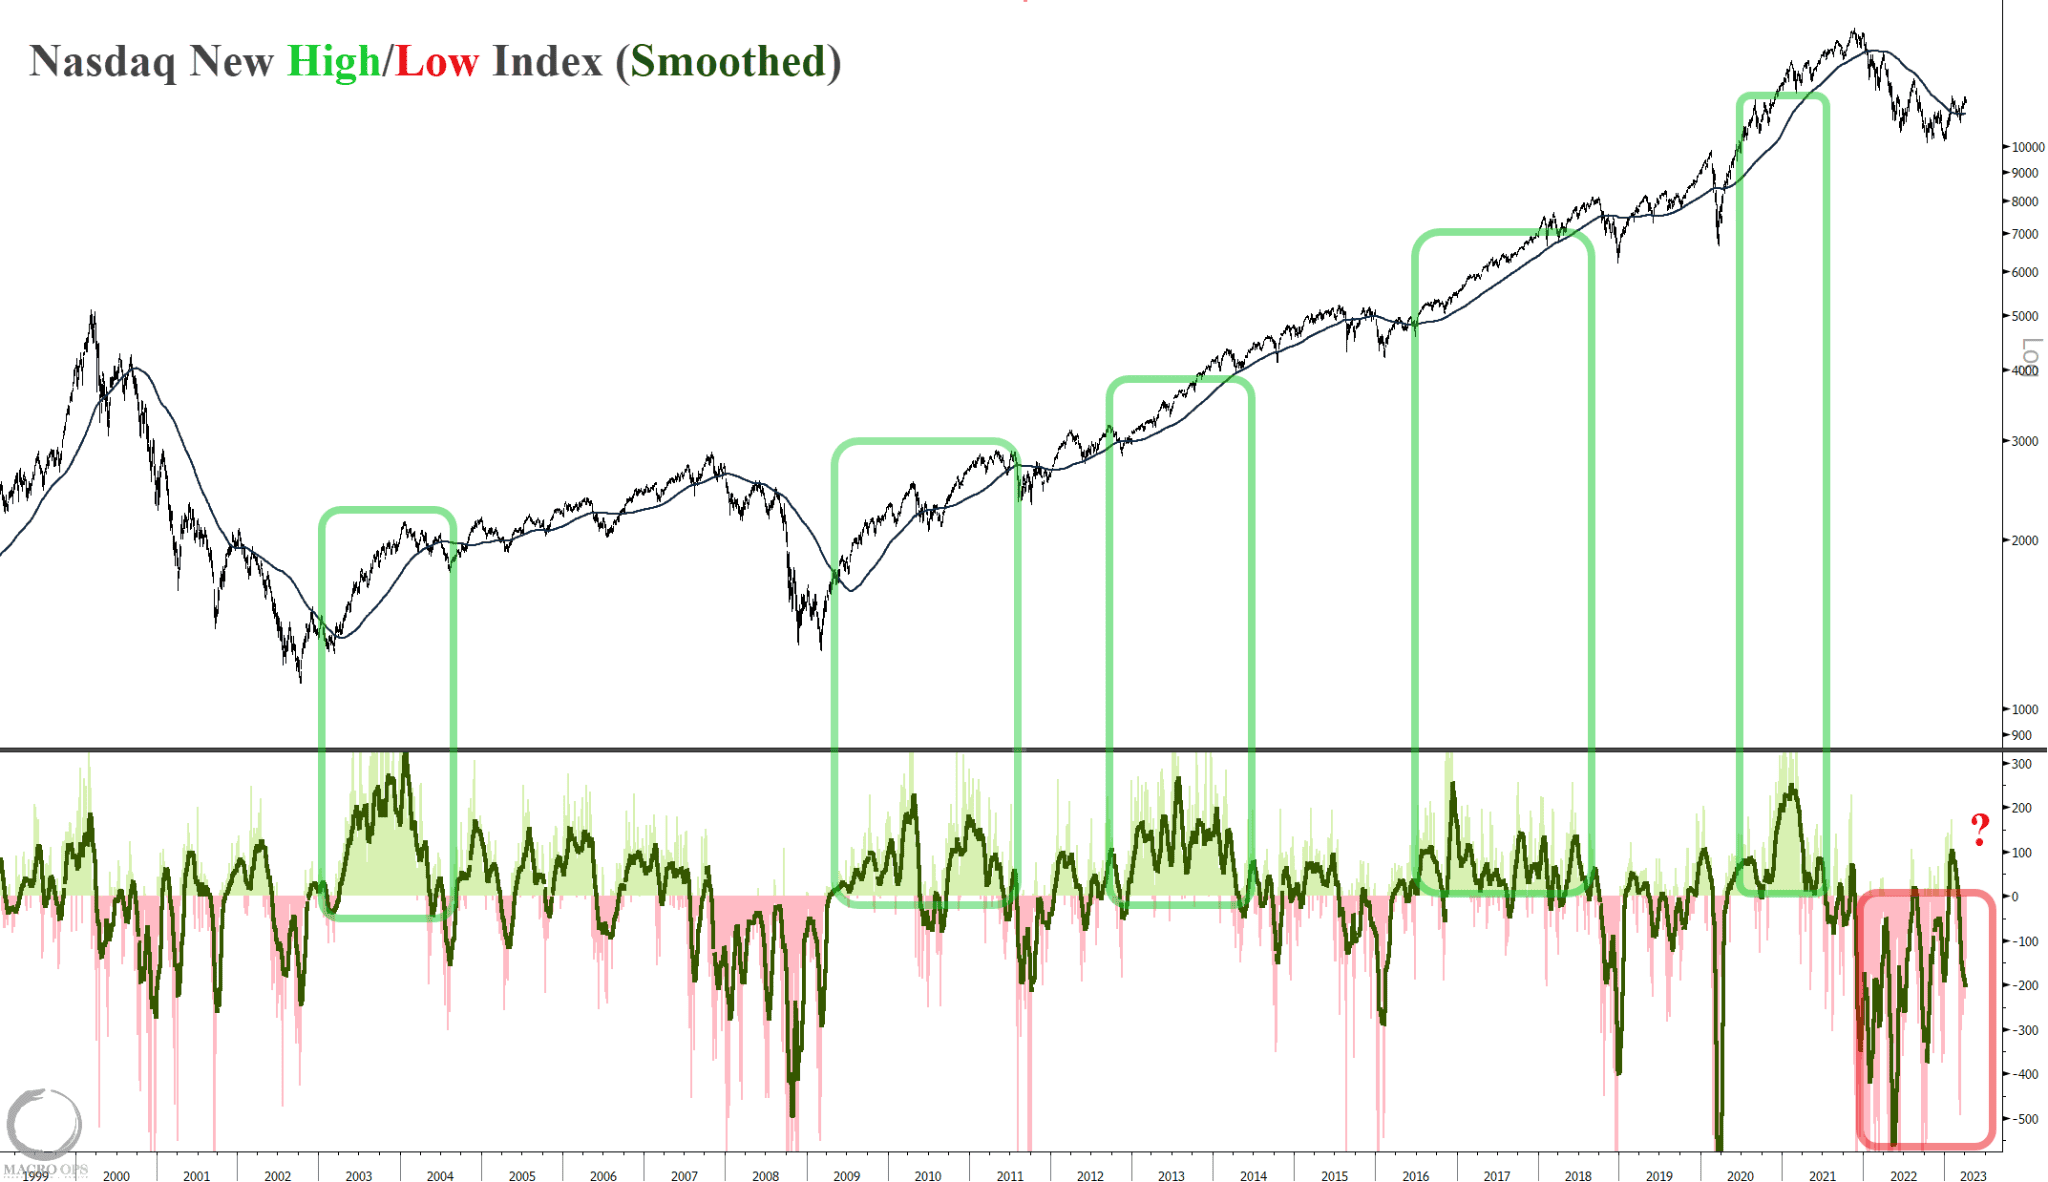
- Our views at MO are that we’re in a countertrend bullish retrace within a cyclical bear market. We remain tactically bullish over the next 1 to maybe 2 months, as long as the tape can hold up. With that said, there are some increasing signs of concern for us. One of these is the Nasdaq New High/Low Index. It’s begun to deteriorate again after having failed to show any enduring strength.
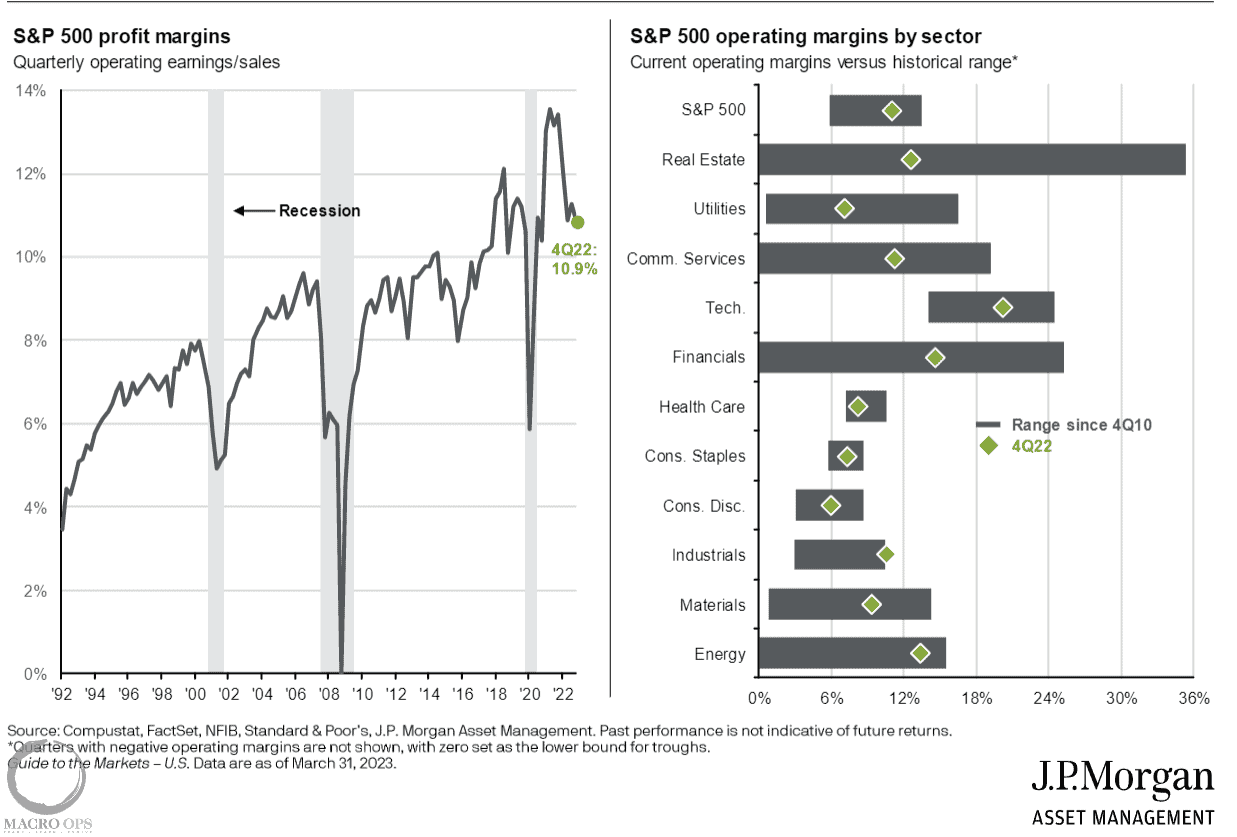
- The Druck once said “What’s obvious is obviously wrong… The present is already in the price… And it’s margins and capacity that matter…” SPX margins are doing what you’d expect them to do in a cyclical bear (contract). The graph of sector margins relative to history on the right is kind of an inverse way of looking at the CAPEX cycle.
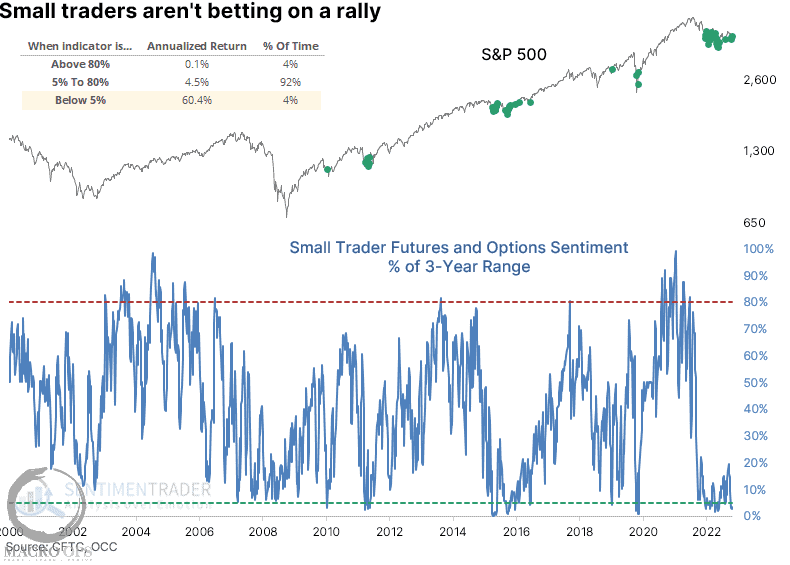
- We’re tactically bullish because too many people were too quick to turn bearish. The chart below from SentimenTrader is an example of this. However, I’d like to caveat that with a look at how bearish this subset of traders were for all of the 08’ bear market. Much in this environment should be taken with a large helping of salt.
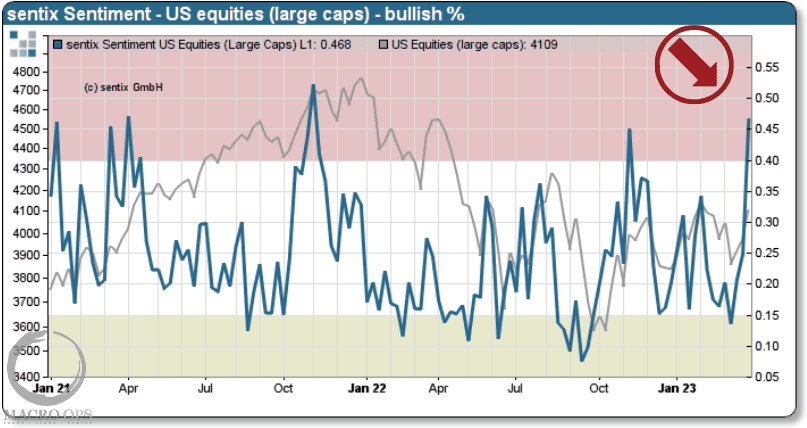
- Sentix’s US equities large cap sentiment index saw one of its largest spikes in recent history, climbing to a level not seen since the Fall of 21’, which wasn’t long before the cyclical top. I wrote about this in a note for our Collective over the weekend but it’s not just the levels of sentiment that matter but the speed at which sentiment shifts is an important tell too.
Action like this makes me suspect of the durability of the current rally.
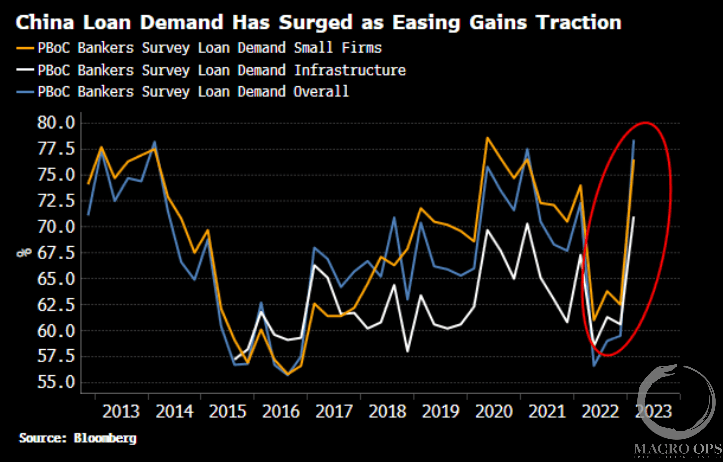
- Simon White of BBG shared some interesting charts tying together easing in China, along with the USD and acyclical inflation. These next few charts are from him. This chart of loan demand shows that credit conditions in China have eased considerably as of late.
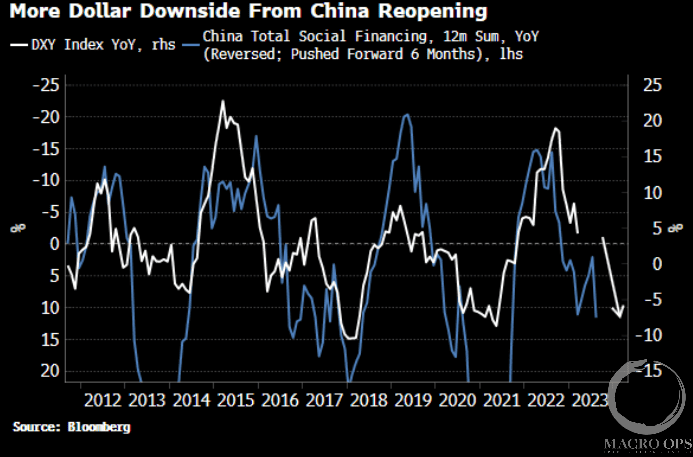
- Here’s China Total Social Financing (blue line, YoY reversed and pushed forward 6m) along with the DXY Index (YoY). If this relationship holds true then we should expect the DXY to continue to trade heavily in the months ahead. And the logic behind Chinese financial conditions and the USD is largely explained by the “dollar smile” concept.
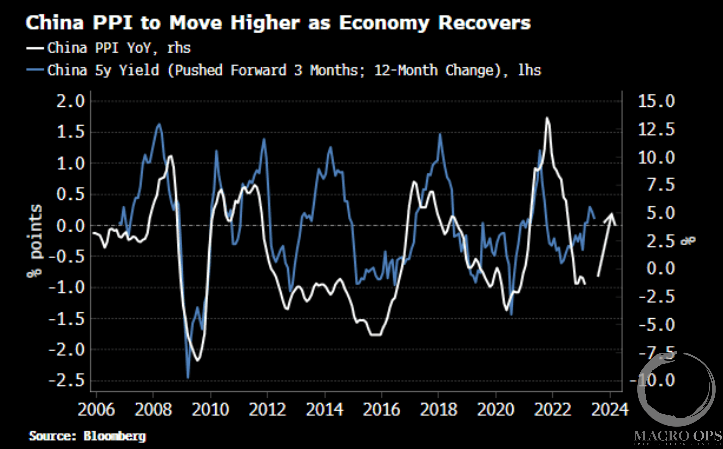
- White also makes the connection between China’s Producer Price Index (PPI) YoY and acyclical inflation (inflation that’s not attributable to cyclical drivers) in the US, arguing that China’s collapsing PPI has been a drag on US Core acyclical PCE over the past 6-months or so. But… he points out in this chart that if the leading relationship of China 5y yields holds, then China’s PPI should begin rising again soon and thus a major headwind to US inflation will become a tailwind.
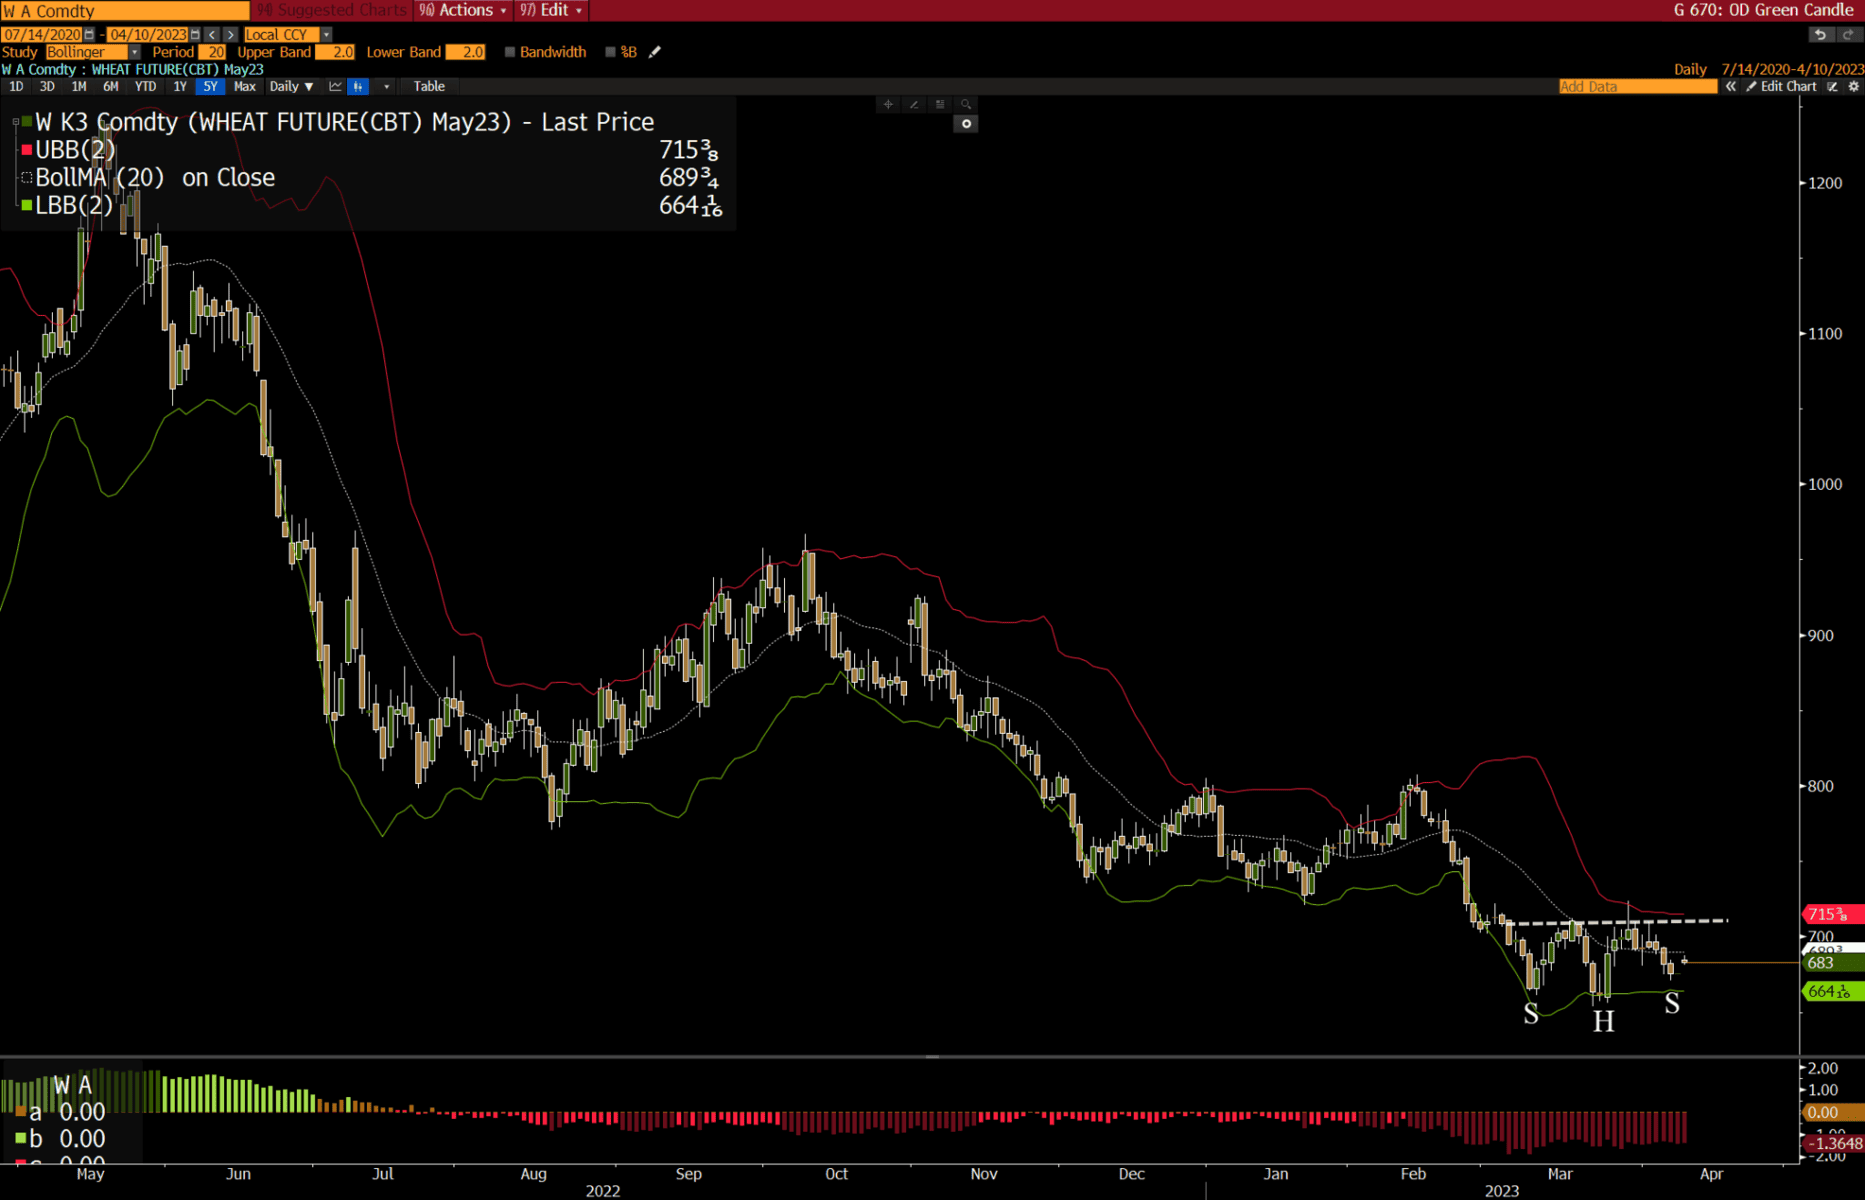
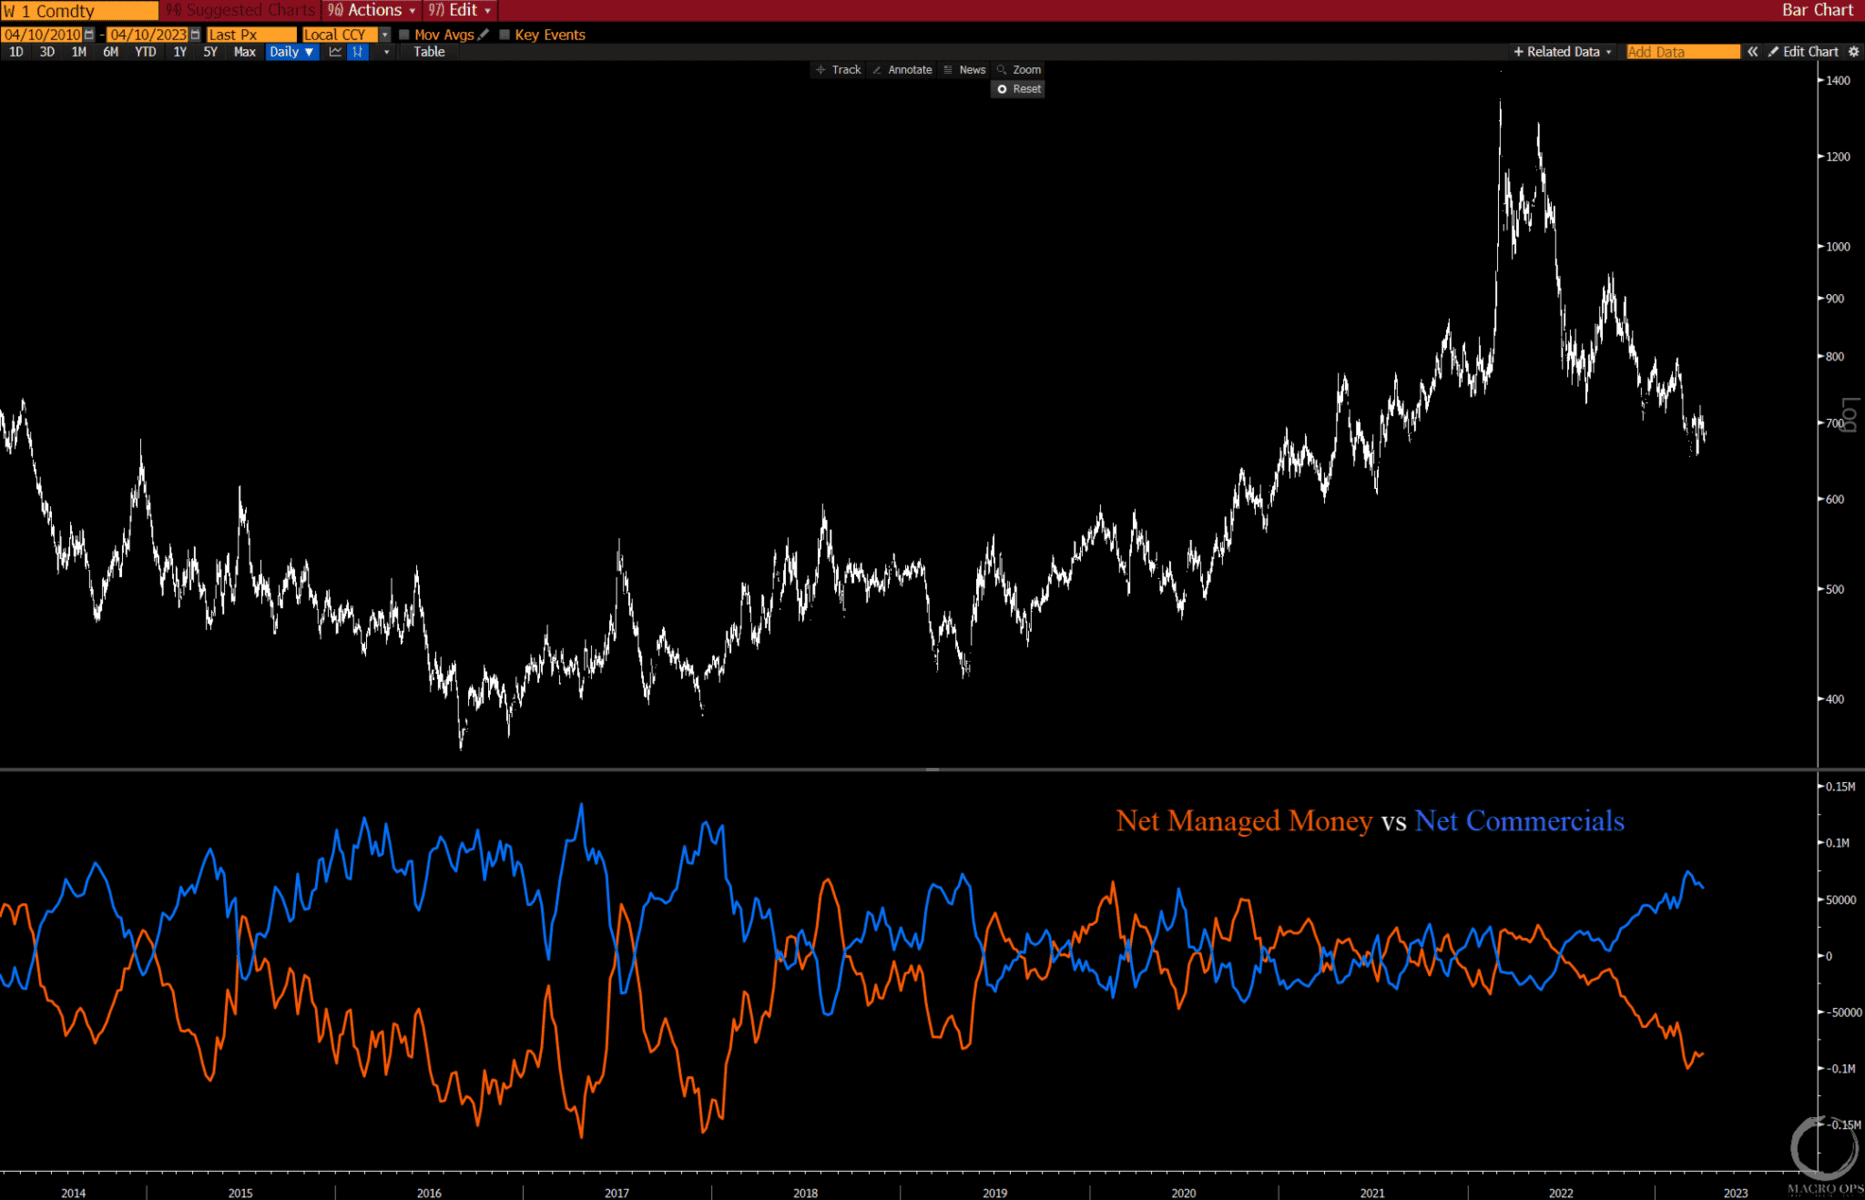
- We’ve been keeping a close eye on wheat futures (WEAT ETF alt). They could be putting in a right shoulder to an inverse H&S bottom. Chart still needs to develop but worth keeping an eye on it.
- And it’s worth watching because Net Money Managers (orange line) and Net Commercials (blue line) are extremely short and long respectively. The last time we saw positioning like this was at the start of 18’, which coincided with a major low.
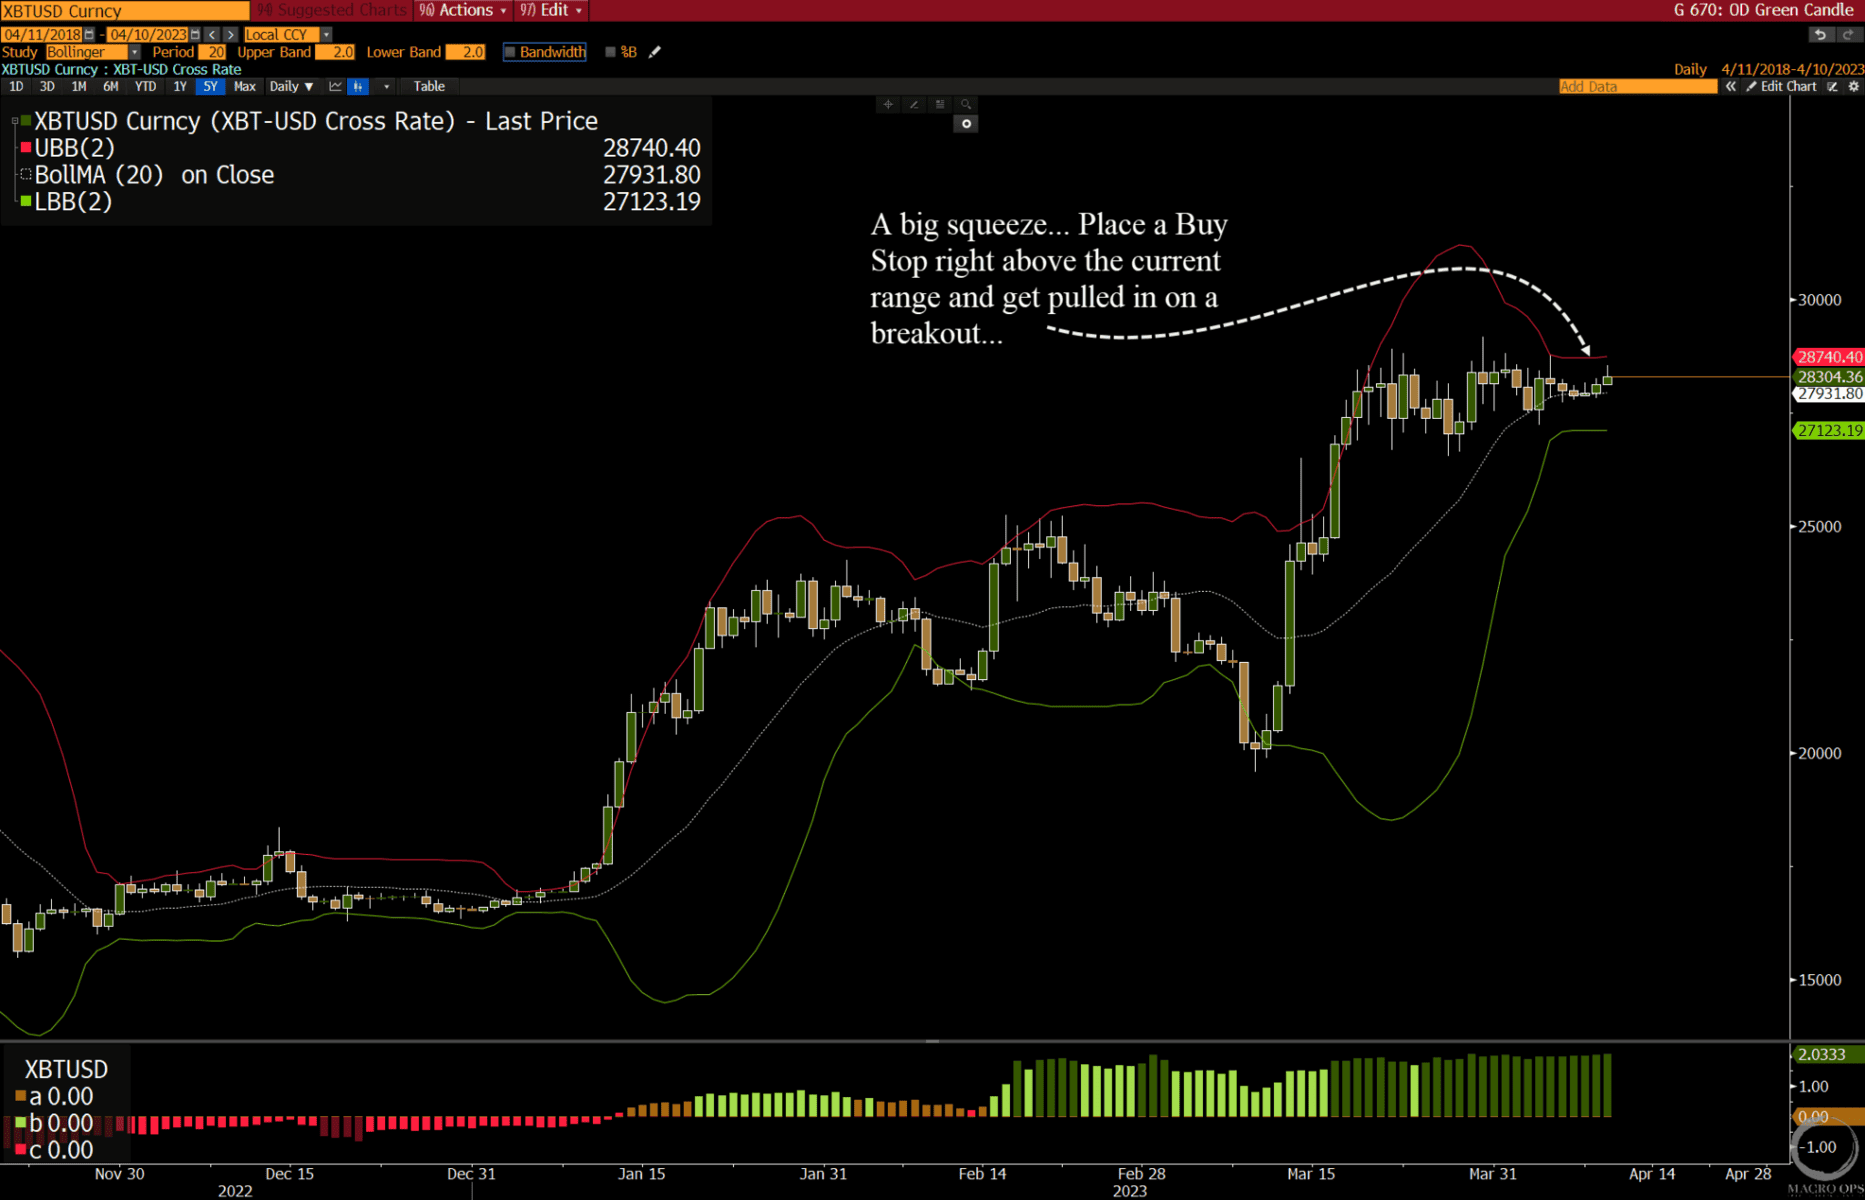
- We’ve been pitching long BTCUSD as a way to play the tactical rally in risk-assets, these last few weeks. The daily chart has entered a major squeeze as indicated by its narrow Bollinger Band. Compression like this tends to lead to expansionary trends. We’re long and will add on a confirmed breakout from this range.
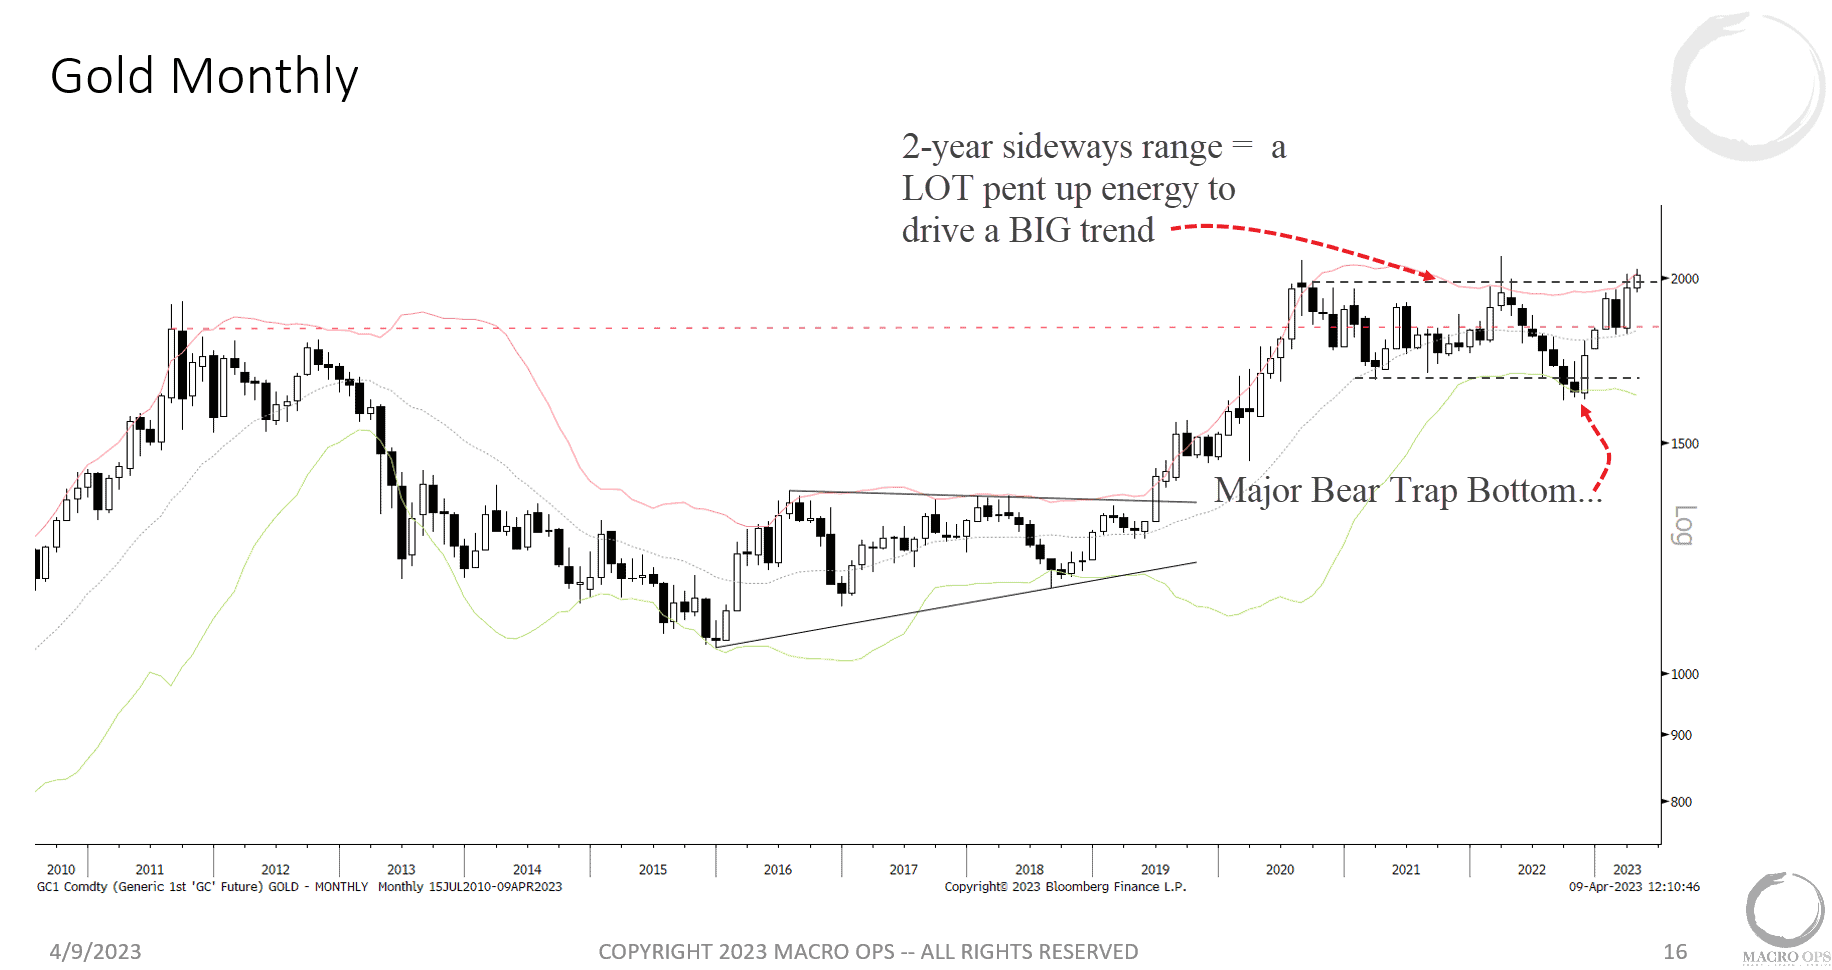
- Long precious metals continue to be our favorite trade looking out over the next 12-24 months. The price action makes this an easy bet to make. Also, it should be noted that this developing breakout from a 2-year sideways consolidation is being met with mostly DISbelief or just general apathy. I see little gold bullishness on my feed.
Thanks for reading.
Stay frosty and keep your head on a swivel.