The primary trend in equities remains up. Expanding breadth, flush liquidity, and strong internals point to strong forward 6-12m returns. However, high positioning and sentiment (read: trend fragility) suggest markets may hit an airpocket soon and go through a positioning rinse over the next month, especially given we have a negative catalyst with the reintroduction of trade war risk. However, the downside should be contained as improving cyclical pressures paint an increasingly favorable environment for risk. But… we live in a geopolitical idiocracy so, of course, stay nimble and keep your head on a swivel.
***The MO port finished 2025 up +50.8% and is currently up +16.4% ytd for 26’. The doors are open to our Collective for the next week, so if you’d like to join our group and tackle markets with us this year (which, by all indications, 26’ is looking like it’s going to be a wild ride) then click the link below and get after it***
Join The Collective
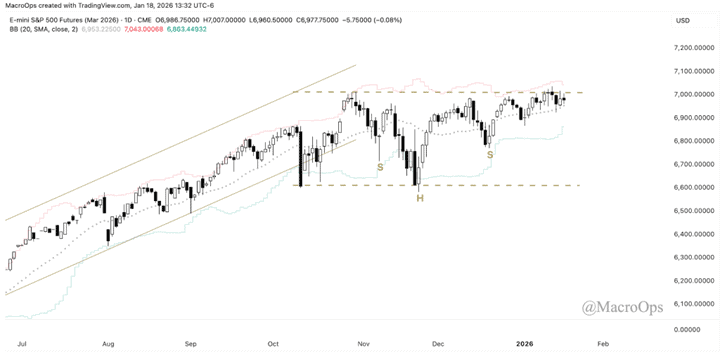
1. The SPX continues to coil near the upper band of its four-month sideways range (March contract below, with spot slightly above). All indications point to a big move coming soon…
2. The story for the past few months has been rotation. The cap-weighted index has gone sideways, weighed down by Mag-7, while the equal-weighted index is trending to new highs. We can see there have been three other extended periods of rotation during the current bull trend, starting in 23’.
The average duration is 41 trading days and -6.17%. The current period is 52 days and -5.5%.
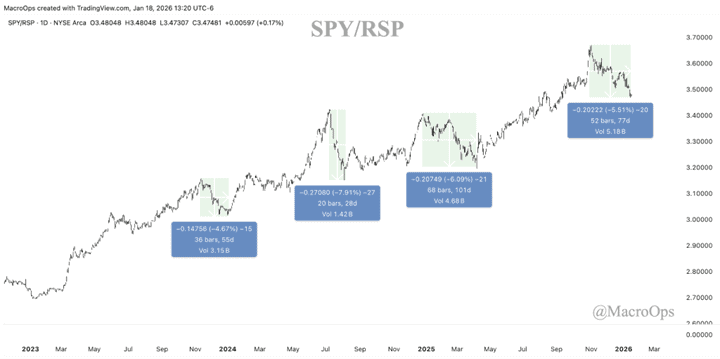
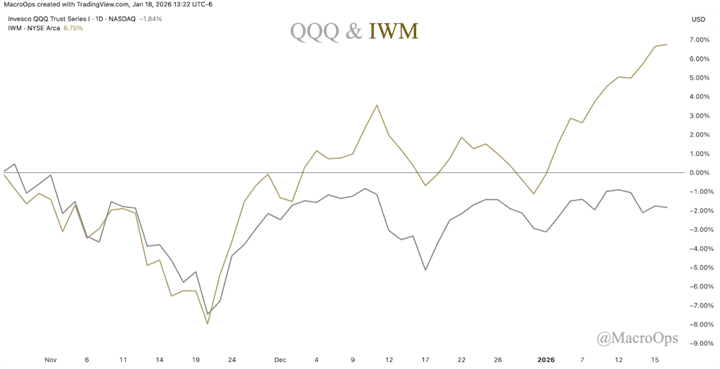
3. Some of this is seasonal, as small-caps and equal-weight tend to outperform around the turn of the year. And some of this is narrative-driven, with the technically extended AI megacaps taking a breather and the AI “beneficiaries” catching the outflows. Since the Russell2k total market cap is only $2.5T, or a bit less than one-half of an NVIDIA, it doesn’t take much rotation to drive these relative trends.
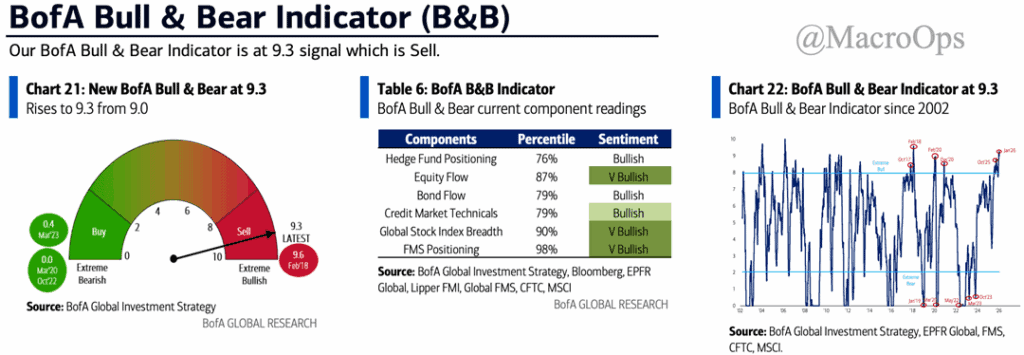
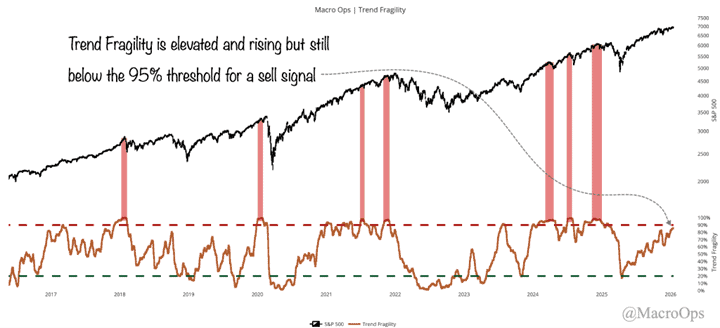
4. The trend is up, but sentiment and positioning are stretched. BofA’s Bull & Bear indicator is firmly in sell signal territory, while our Trend Fragility composite is at 86% and rising — a TF sell signal triggers when it crosses above 95%. This tells me the market will likely hit an air pocket later next month.
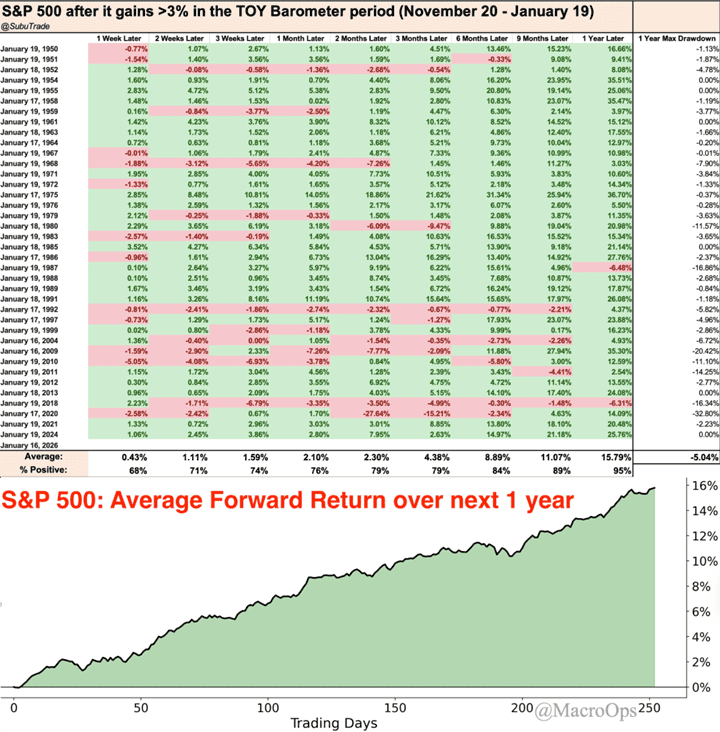
5. While we expect a positioning/sentiment washout sometime over the next two months, the larger Trifecta picture strongly supports a continued bull in risk assets. Wayne Whaley’s Turn-of-Year (TOY) Barometer is another data point we can add to the bullish ledger. Here’s the following from @SubuTrades:
Bullish seasonality:
S&P 500 gained more than +3% during this TOY (Turn Of Year) Barometer period (November 20 – January 19).
Historically, $SPX was higher 36 out of 38 times a year later, with an average gain of +15.8%
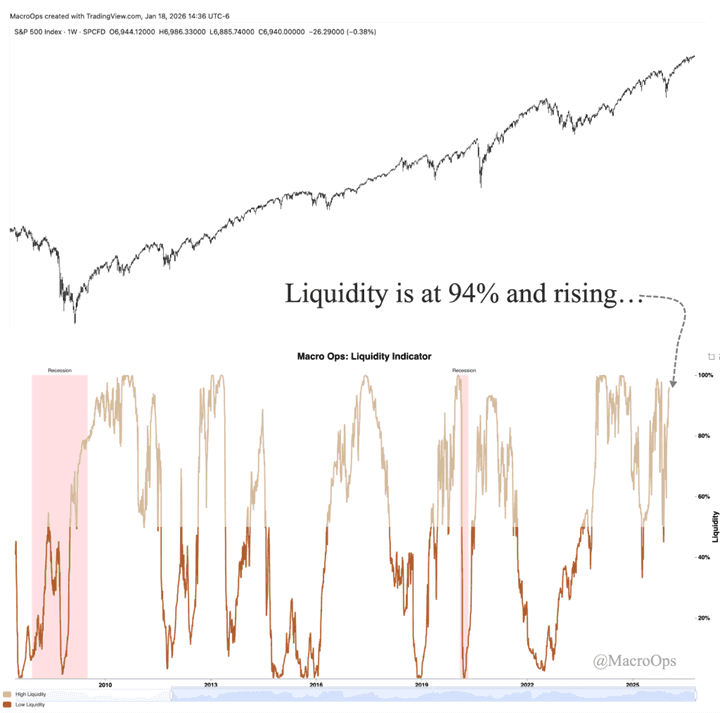
6. Our MO liquidity indicator is at 94% and rising. This is a flush regime which historically points to strong forward 6-12 month returns.
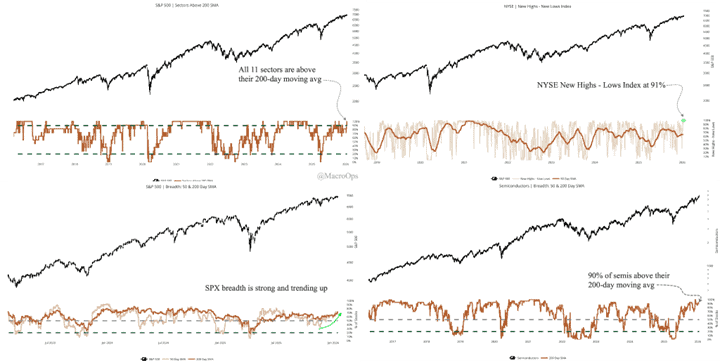
7. And breadth continues to broaden out and strengthen. Last week we saw the A/D lines for the S&P500, S&P1500, and NYSE all hit all-time highs for the first time since late July. That’s bullish.
We also have all 11 sectors trading above their 200-day moving averages, which historically leads to higher than average forward returns. The NYSE New Highs-Lows just climbed above 90%, which is bullish for 3-month forward returns. The percent of semis trading above their 200dma is at 90% and rising, which is… you get the picture.
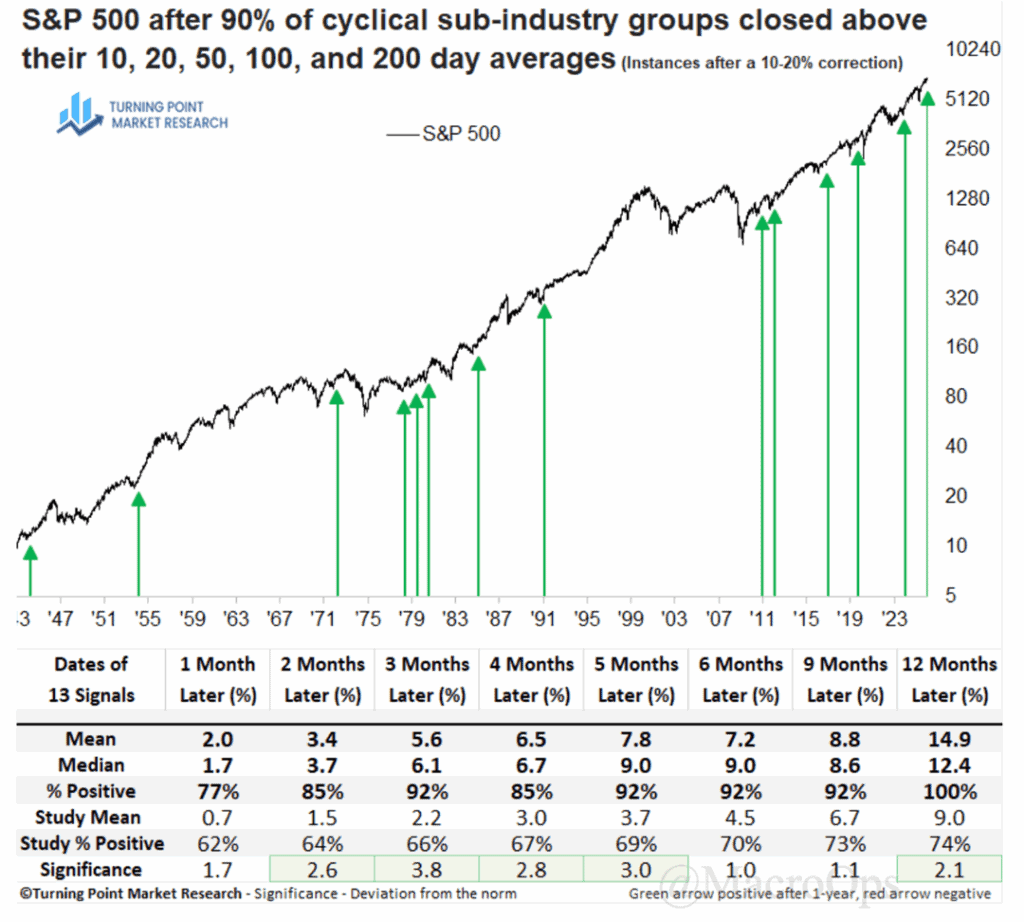
8. Dean Christians at the excellent Turning Point Markets Research recently shared this great study with subs noting that over 90% of cyclical sub-industry groups closed above their 10, 20, 50, 100, and 200 day averages and how this historically foretells strong forward returns for the S&P.
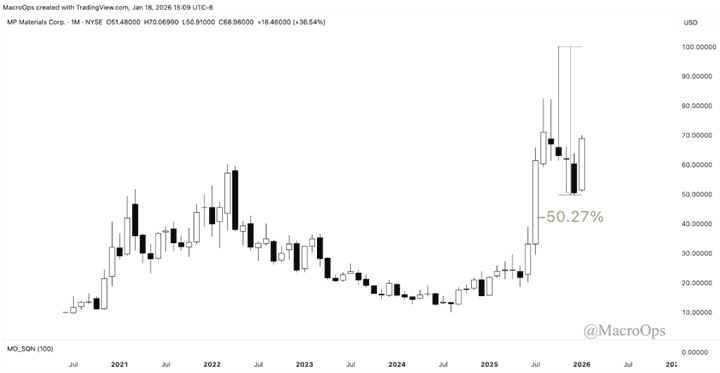
9. Industrials, materials, and real estate are the best looking sectors at the moment, so that’s where the majority of our focus is. MP Materials Corp (MP), a name we previously owned (and which I pitched in these pages when it was trading sub $20), is a play we’re once again interested in. It sold off 50% from its October high and is putting in a strong monthly reversal candle.
This is a powerful setup and MP likely retakes its October highs before Summer.
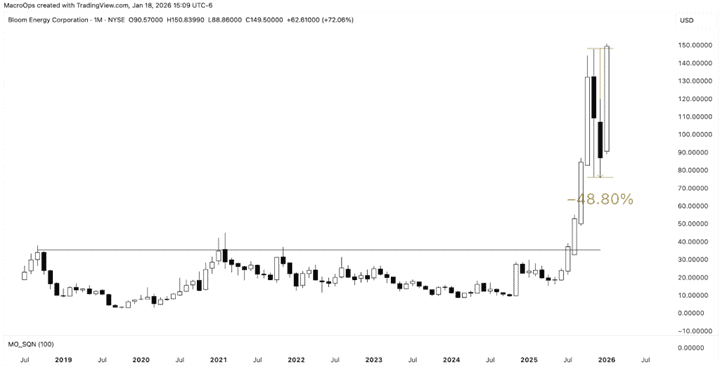
10. Bloom Energy (BE) has a a similar pattern (chart below is a monthly). It aslo reversed nearly 50% from its October top and recently traded back to new all-time highs. This chart is headed much higher.
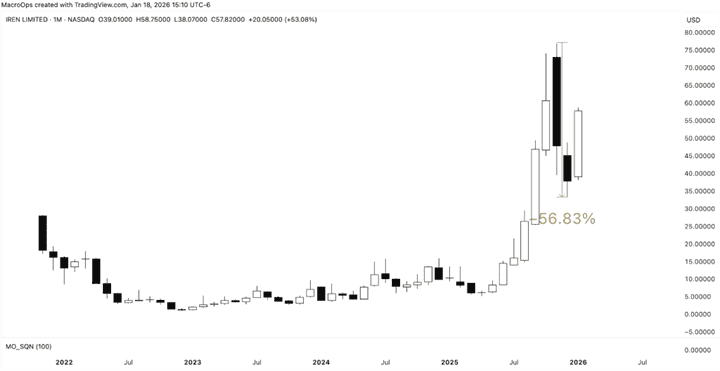
11. Iren Limited (IREN) has also put in a reversal bottom following a 56% correction. IREN is at the center of the AI trade as it builds and operates hyperscale data centers. The AI narrative has taken a breather over the past few months but we think we’re only in the middle innings of this trend.
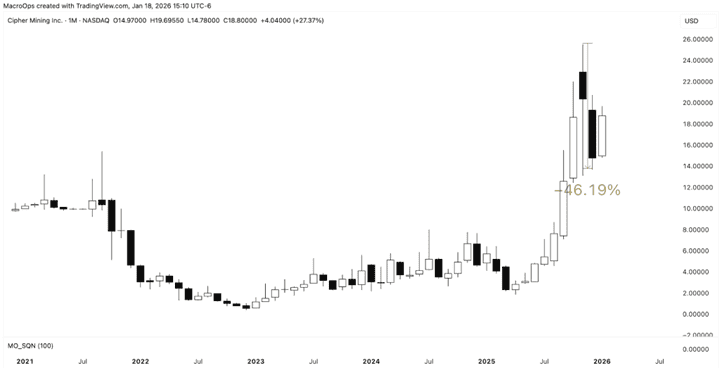
12. Cipher Mining (CIFR) with a similar pattern. CIFR is a US-based large-scale BTC miner focused on ultra low cost mining operations powered by long-term fixed-price energy contracts.
Join The Collective
Thanks for reading.