Summary: The primary trend in equities remainsup with seasonality strongly supportive of a rally into the end of the year. SPX put in a new weekly closing high on Friday (not bearish), the data strongly favors a strong run into the end of the year, following last week’s gains. Silver is stretched but has nothing on 1979… And several international indices are setting up for longs, plus more…
***The MO port is up +51% ytd, and we’re not seeing a shortage of great opportunities in this market. If you’d like to join me, the MO team, and our Collective of sharp, supportive investors and traders as we navigate these markets, then click the link below. I look forward to seeing you in the group.***
Join The Collective
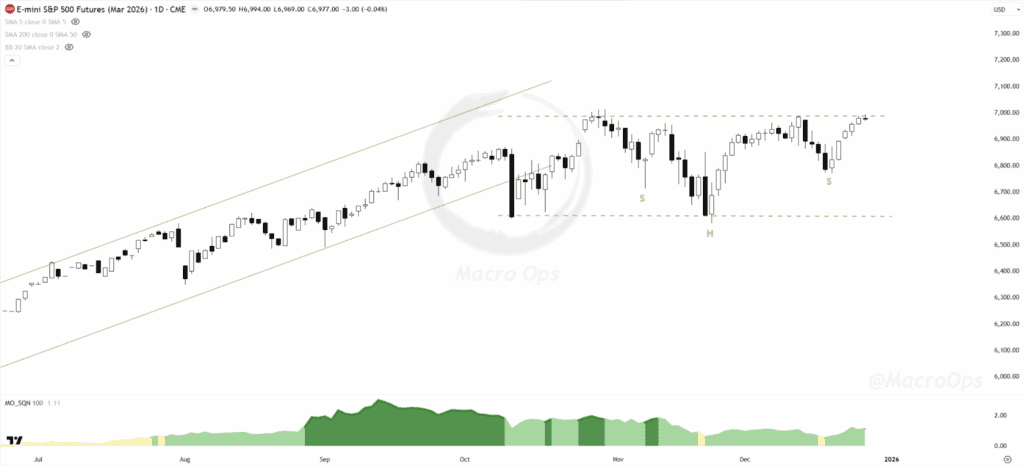
1. The SPX index closed at a new all-time weekly high on Friday. Below is the active month (March contract) for the e-mini. It’s knocking on the ceiling of its 3-month range. We should see it punch through to new highs this week (chart is a daily).
2. @TheMarketStats points out that “Historically, when the S&P gained 1.4% during Christmas week, it was higher one week later in 15 out of 16 cases.”

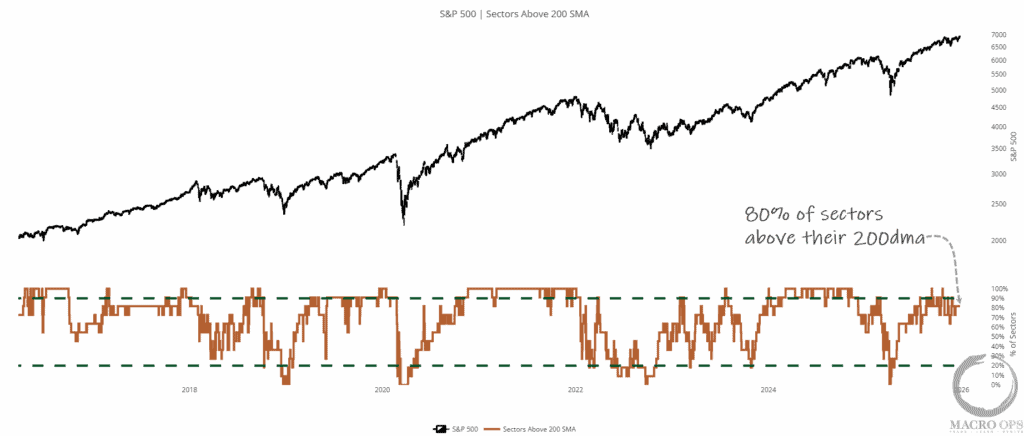
3. The number of sectors above their 200-day moving average has jumped by more than 20% since November, and we expect this trend to continue. This supports the risk-on trend, as the indicator tends to fall precipitously before a larger correction.
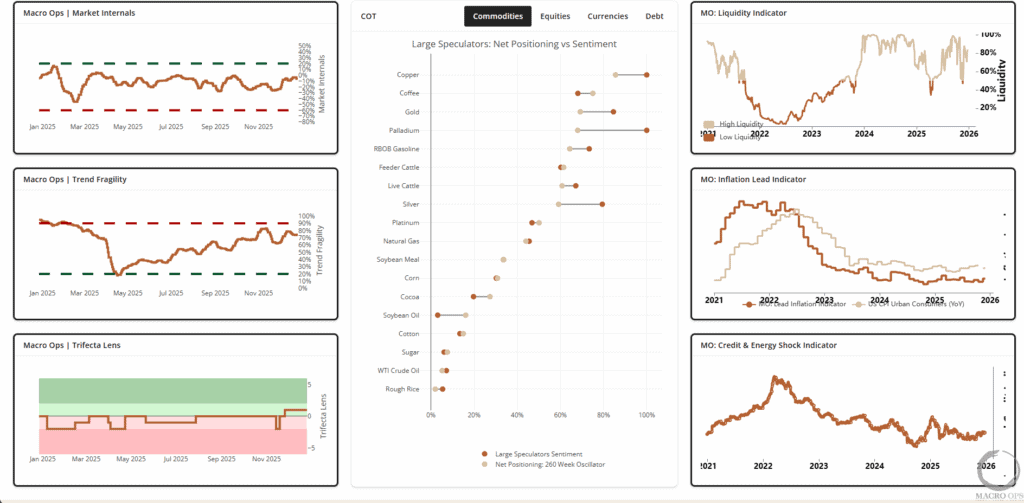
4. Trend Fragility (a measure of sentiment and positioning) is elevated but still below levels that trigger a sell signal. Market internals are strong and trending in the right direction, liquidity is flush, and our Trifecta Lens indicator (a composite of everything) is at +1, its highest reading since Oct of 2024.
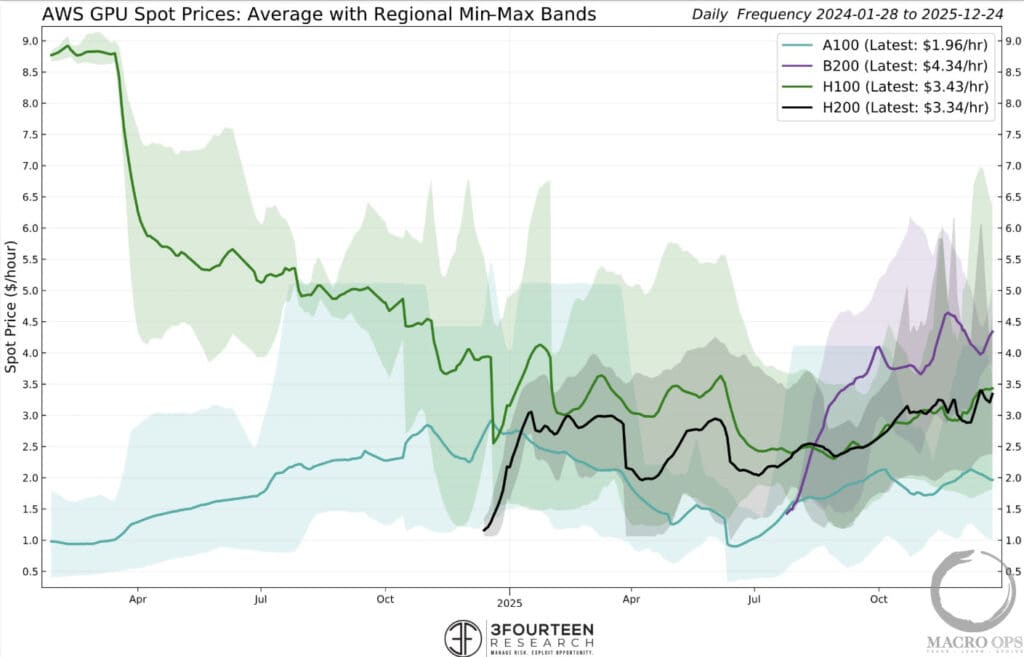
5. Whether or not AI is in a bubble and if so, what will cause that bubble to pop, are two of the more pressing questions for investors right now, seeing as how index concentration is at record highs.
@fernavid shared this interesting data point, writing “Spot GPU prices at AWS rising across all GPU vintages for the last few months, all while the “AI-bubble” ‘ hand-wringing reached a fevered pitch. Remember, some bubblers say rental prices should be in permanent decline from oversupply and obsolescence.”
We at MO believe the AI trade has much further to run.
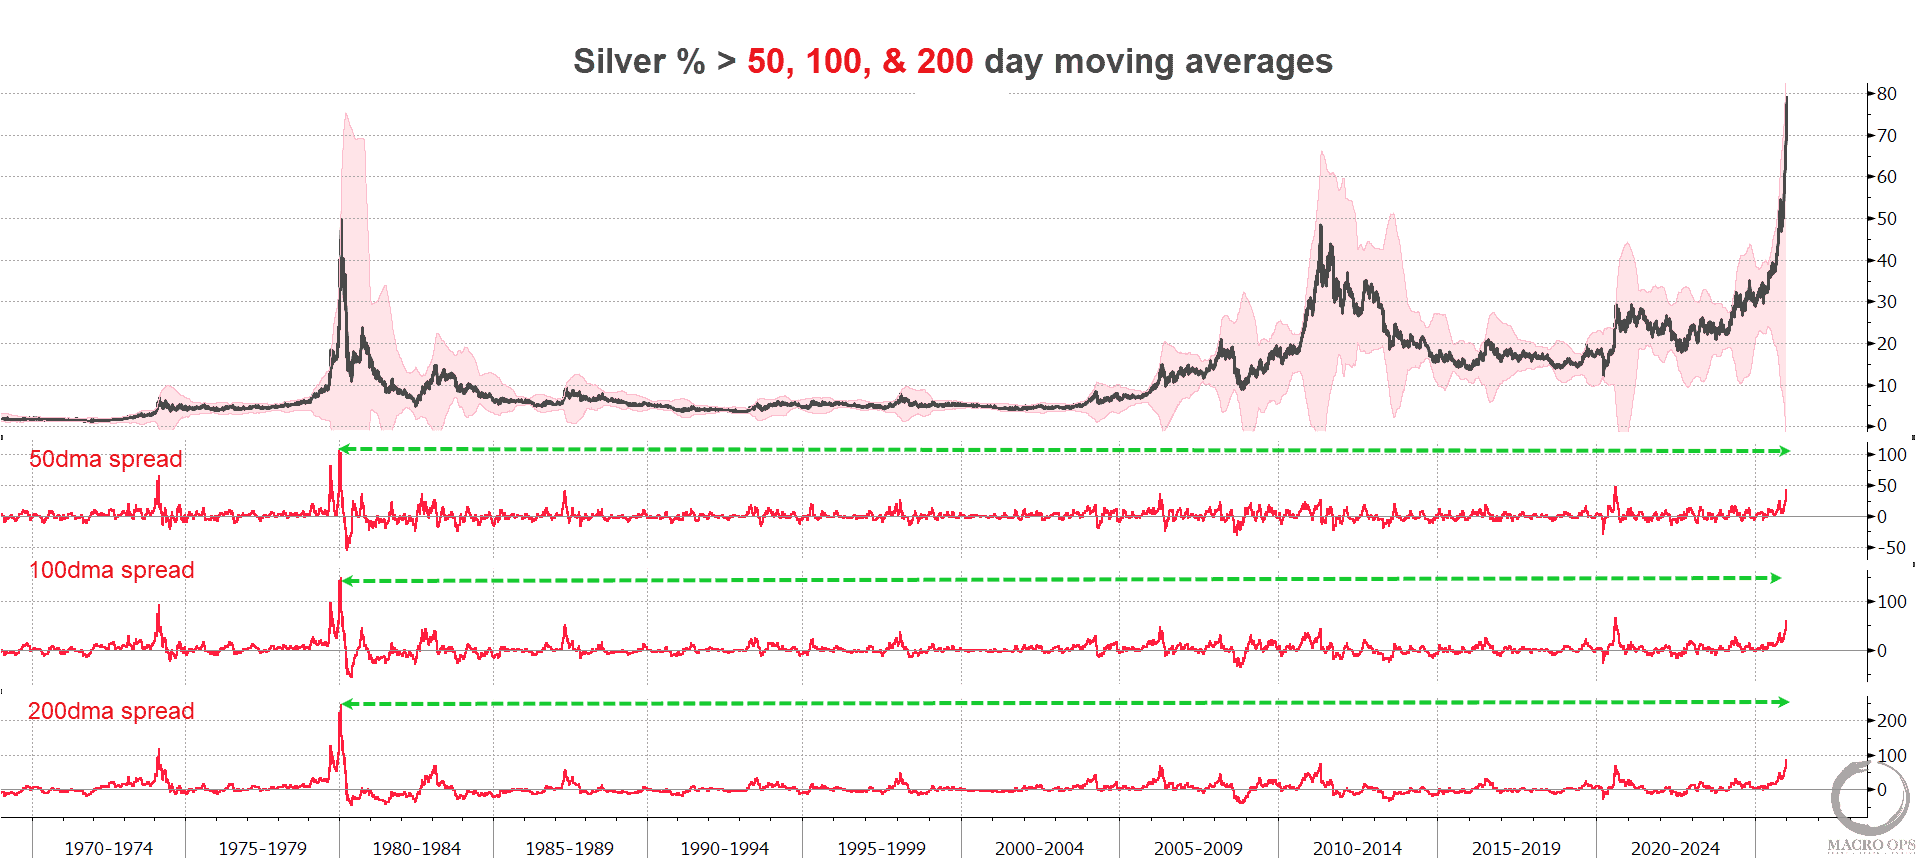
6. Precious metals have been a major contributor to our performance this up (up 51% ytd). We continue to hold full positions in both, though we’ve applied a trailing stop for partial profits on each.
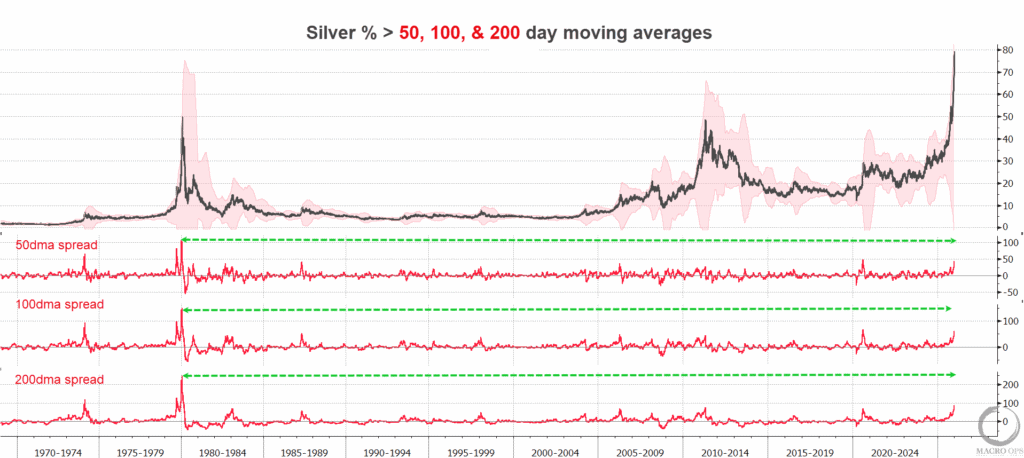
Everyone is talking about how overextended silver is. And indeed, it is. We will see a smashing correction at some point (maybe it begins tomorrow, or another two months, who knows). But… as 1979 shows, the current levels of overboughtness can, well… become a LOT more overbought.
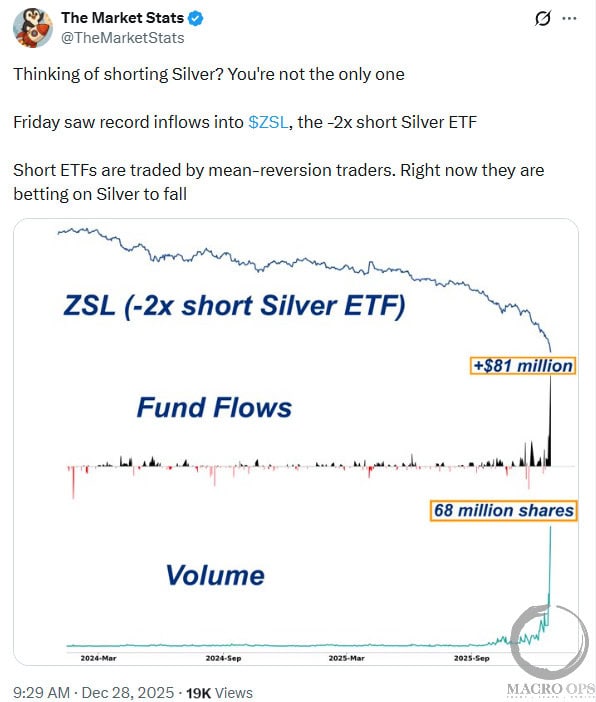
7. Don’t be one of these guys rushing to jump in front of a steamroller…
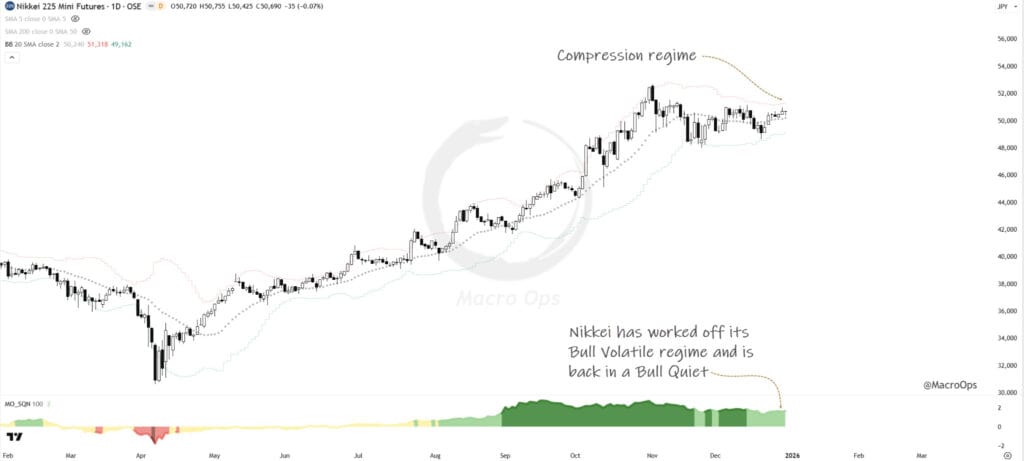
8. Japan’s Nikkei is setting up in a nice compression regime. It’s worked off its Bull Volatile levels and is back to trading firmly in a Bull Quiet. Its monthly chart is a beauty and suggests another strong bull leg is on the way (chart is a daily).
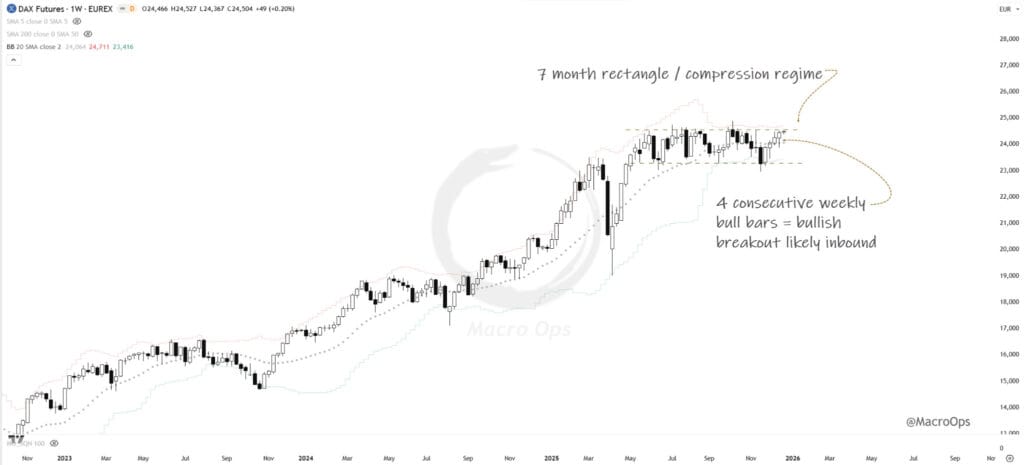
9. The German DAX index is trading near the upper zone of its 7-month rectangle/compression regime. With four recent consecutive weekly bull bars, we should expect a breakout very soon (chart is a weekly).
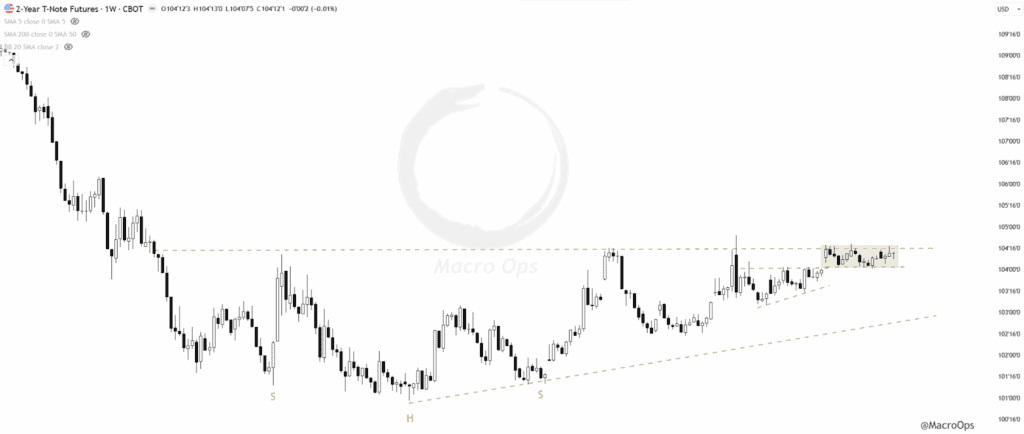
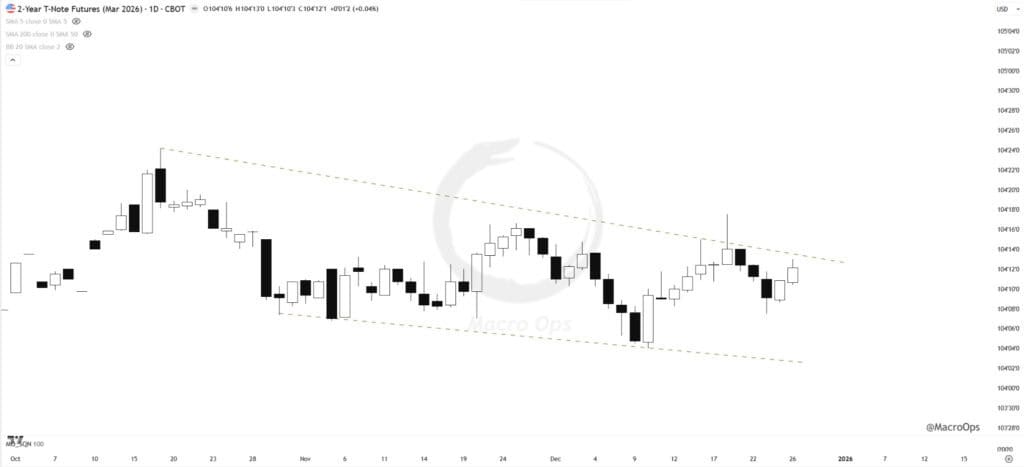
10. Trump is expected to announce his pick for the new Fed chair sometime in early January (Kalshi has Hassett at 41% and Waller at 34%). The 2yr UST Notes continue to compress in a tight trading range right below the neckline of a 3yr+ inverted H&S bottom. The second chart shows the March contract on the daily. We’re interested in playing the longside on a breakout from this range.
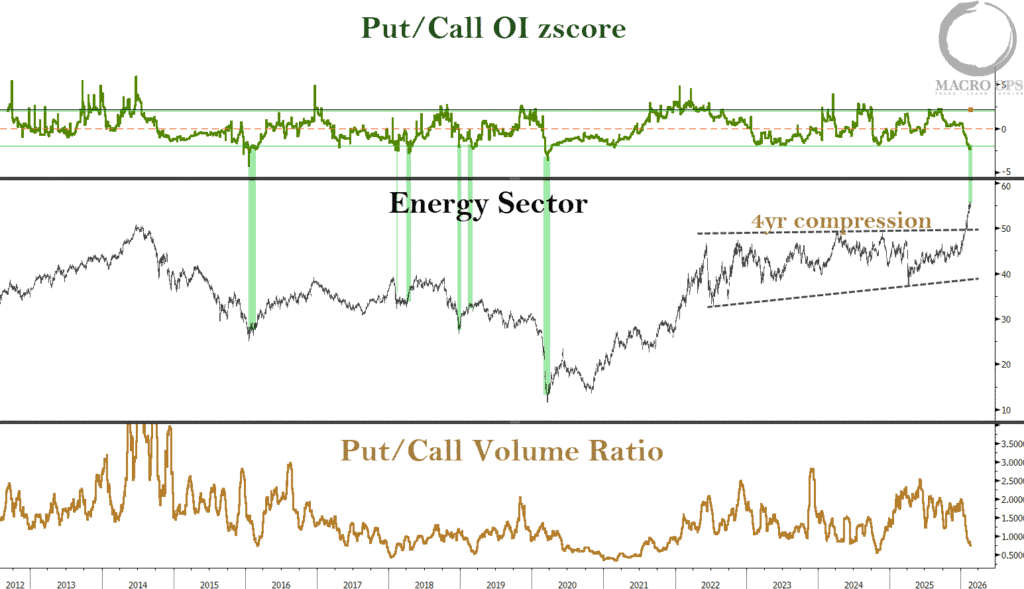
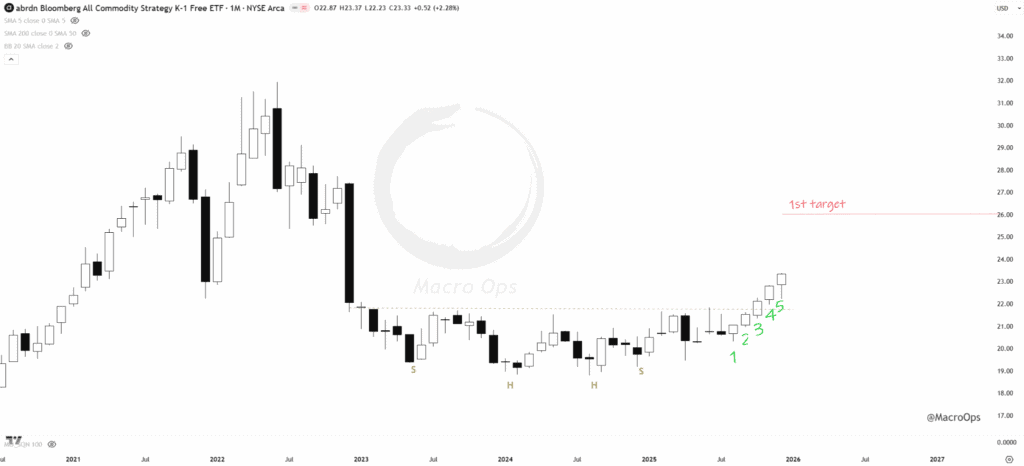
11. We were one of the few shops pounding the table on the long commodities back in the Summer, as we regularly pointed out the major compression regime along with our leads pointing to rebounding global growth. Well, that thesis continues to play out to the T. BCI has put in five consecutive monthly bull bars, which is a strong bullish thrust out from its 2 ½ year H&S bottom.
This trade is only getting started, and we expect it to take out its 22’ highs before 2026 is over (chart is a monthly).
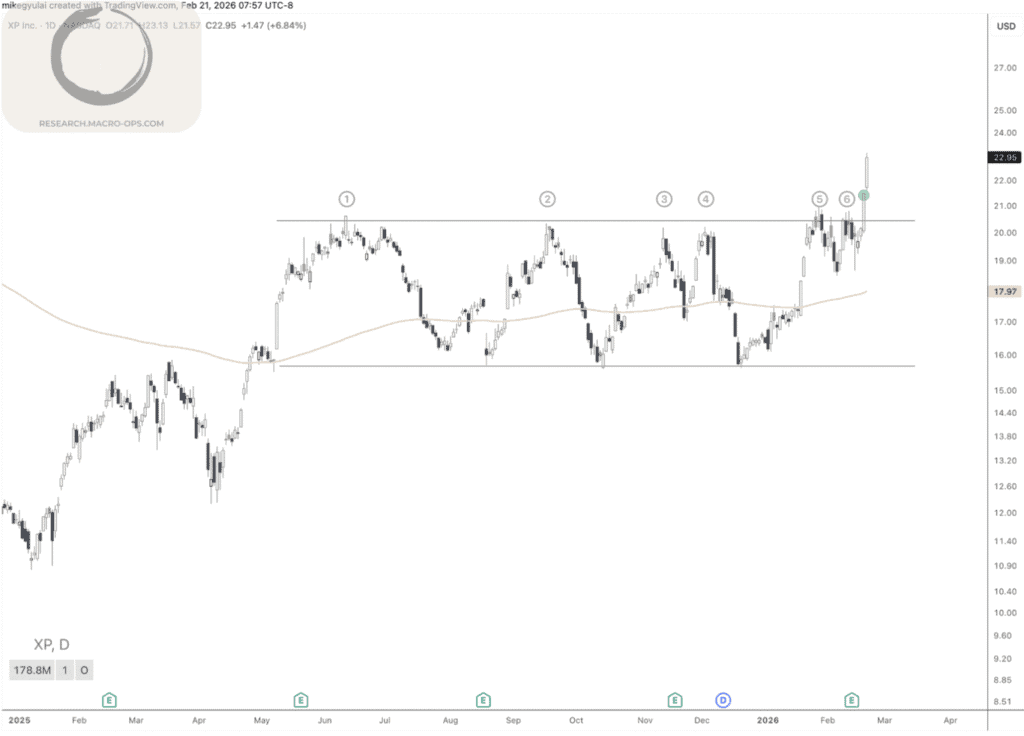
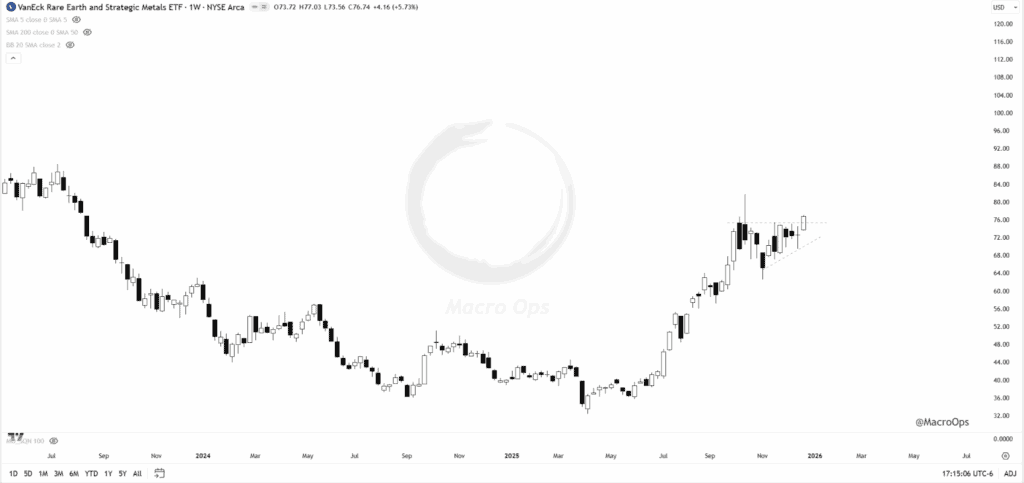
12. We were early to the Rare Earth trade (REMX). And while we’ve traded in and out of the position, it looks like REMX is taking off on another leg after consolidating for the past three months. We’ll likely add to our long this week.
Join The Collective
Thanks for reading.