“Americans are apt to be unduly interested in discovering what average opinion believes average opinion to be and this national weakness finds its nemesis in the stock market.” ~ The Money Game
Summary: The bull trend in the SPX continues to be supported by the tape, stubborn bears, a lack of retail participation, strong breadth, and improving liquidity. While this tape is a bit extended off its April lows, we don’t expect a pullback of more than 7% anytime soon, due to low positioning and leverage levels. Nikkei breaking out to new highs, as well as copper and a copper miner breaking out from a 10-year-long trading range, plus more…
Alright, let’s get to it.
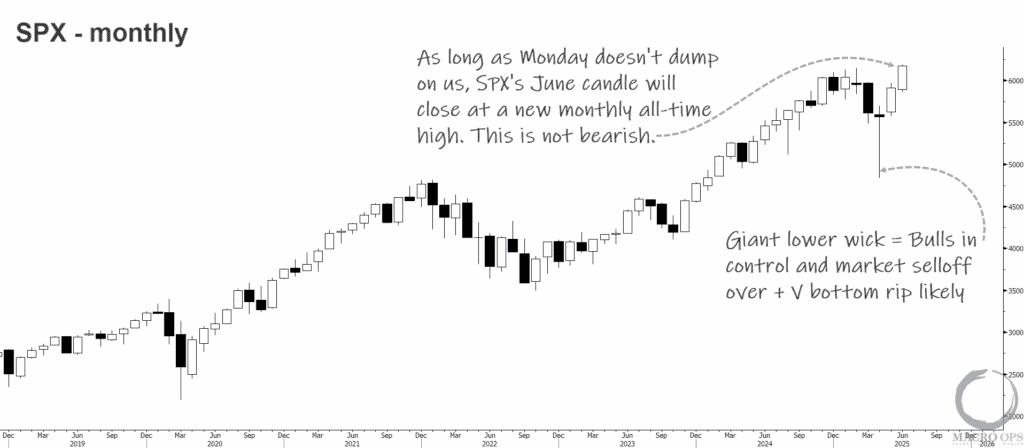
1. Monday is the last day of the trading month, and barring any major moves, these are the most notable monthly charts I’m seeing.
Side note: Bar by bar analysis is a significant part of my analytical process. I look at markets across three timeframes: daily, weekly, and monthly. Each candle illustrates, without bias or emotion, what the supply and demand picture looked like for that period. When you analyze this in the context of the candles that preceded it, you can develop a good feel for where the path of least resistance is (up, down, sideways).
Anyways, the SPX will close at a new all-time monthly closing high as long as Monday doesn’t see a sharp selloff. If it holds near current levels, it’ll close on its highs for the month, also a bullish development. Both point to further upside gains in July.
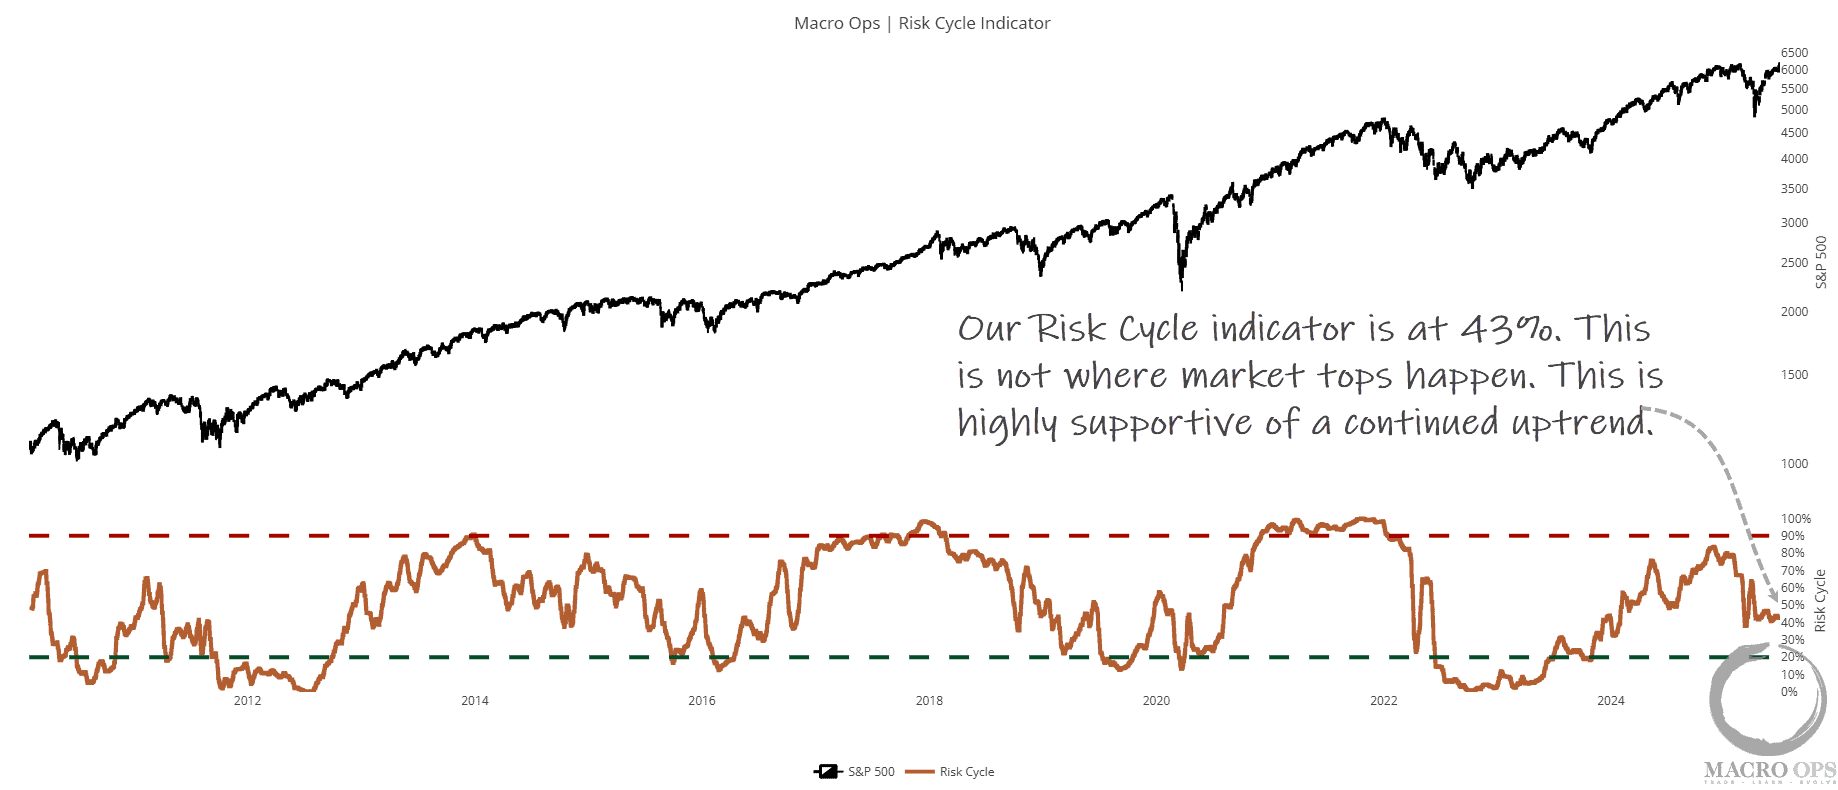
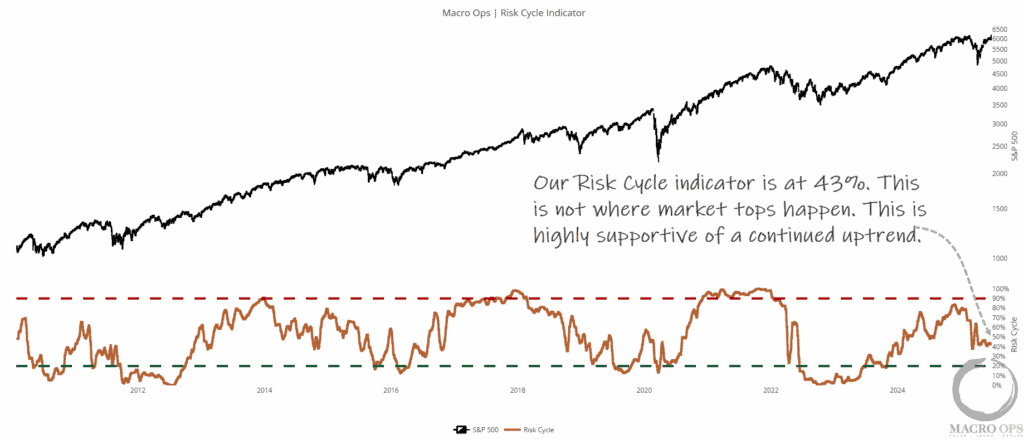
2. Our Risk Cycle indicator, which is a longer-term composite of investor leverage in the system, and therefore a good indicator of cyclical fragility in the market, is currently giving a reading of 43%. Cyclical tops occur when readings are at 80% or above. This tells me that there’s a lot of potential demand to drive this trend higher.
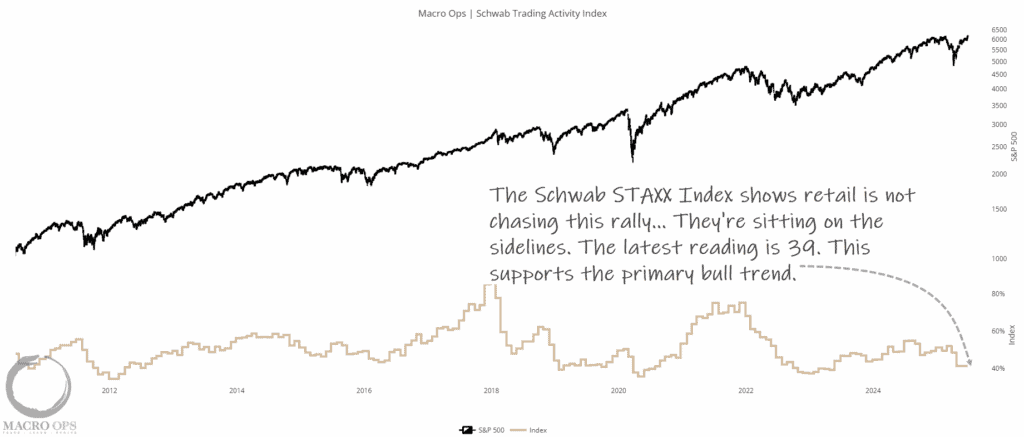
3. Schwab’s STAXX Index is one of my favorite sentiment/positioning indicators. That’s because it’s hard data. It’s not a survey but tracks what retail investors are actually doing. It also has a large sample size, aggregating random accounts from a pool of tens of millions of retail investors. We can see that it clearly signaled trouble in late 2017 and again in late 2021. The current reading is 39. Again, this is not bearish.
Large market selloffs require investors to get out over their skis. And that requires leveraging FOMO and chasing the trend higher. This is not that.
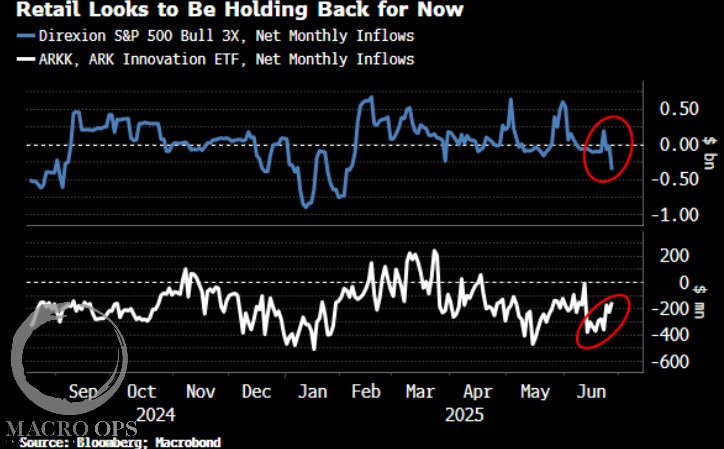
4. More evidence showing the lack of FOMO in this market (chart via BBG’s Simon White).
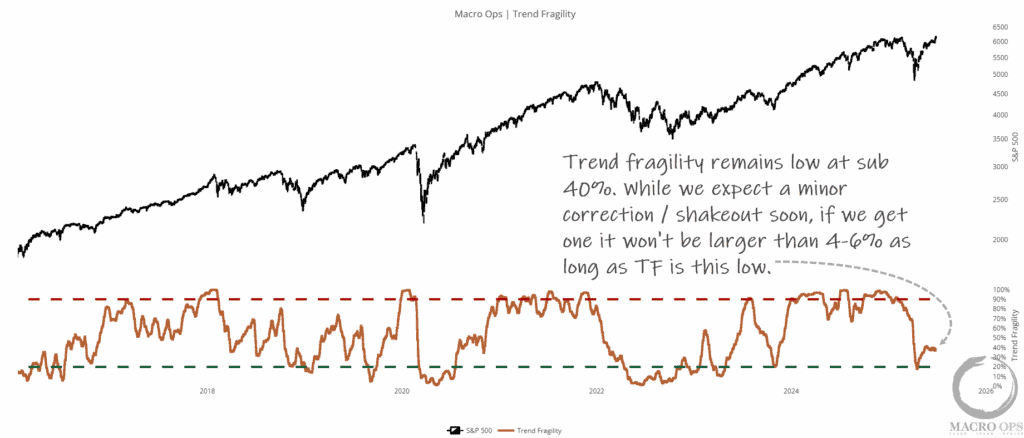
5. Last thing on sentiment… Our Trend Fragility indicator, which is a short-term version of the Risk Cycle, is currently below 40%, which is bullish.
So, while the current rally off the April lows is getting overextended and we expect a pullback to begin within the next few weeks, we don’t expect a selloff of more than 4-7%’ish.
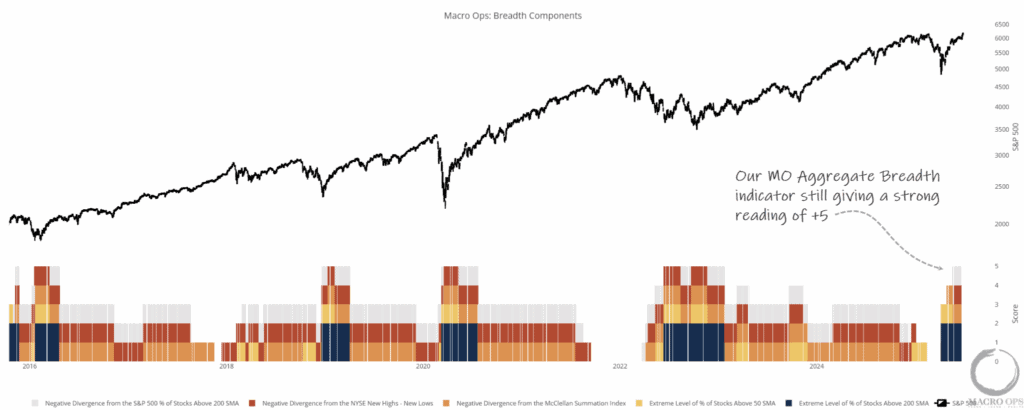
6.Our aggregate Breadth Indicator is still giving a very strong reading of 5. That means we want to stay long and buying.
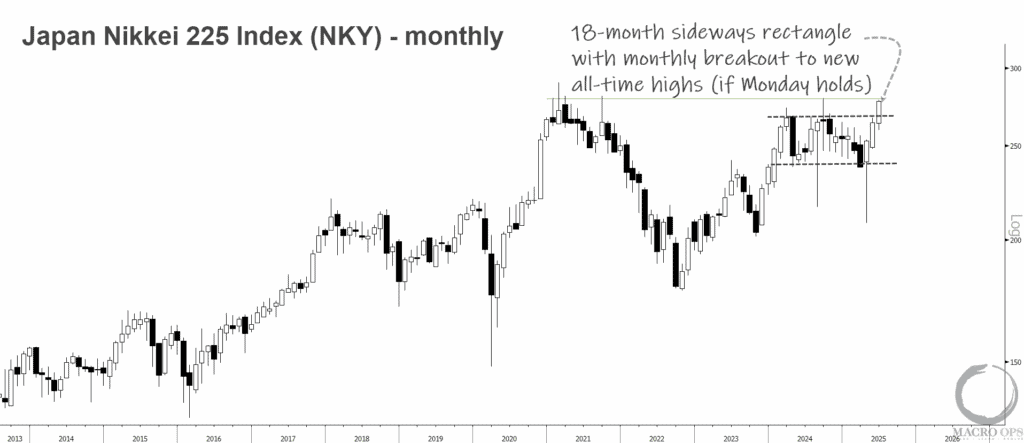
7. Japan’s Nikkei looks set to close at new all-time monthly closing highs. We’re watching this one for an entry.
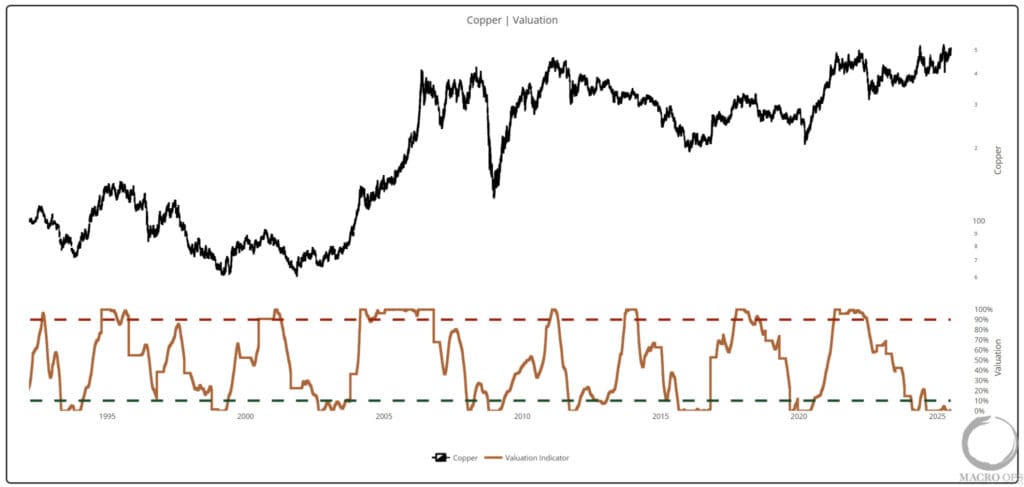
8. Copper looks like it might finally be gearing up for a move. If price holds up Monday then copper will see an all-time monthly closing high.
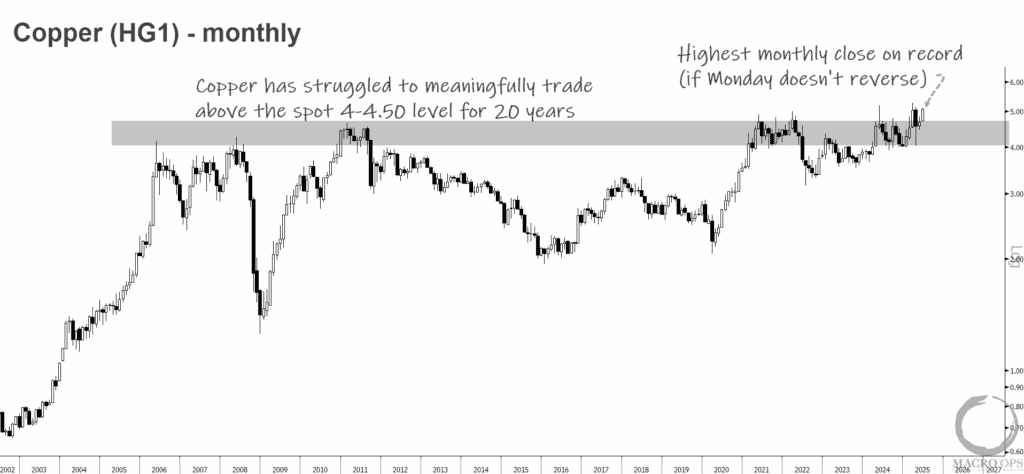
9. We at MO are fairly bulled up on copper. Its relative valuation is in the 0th percentile. We’re seeing bullish precursors with US inventories surging (due to tariff frontrunning) while LME and Shanghai inventories are drawing down rapidly (Chinese inventories are particularly tight). This has driven the LME curve into a steep and persistent backwardation, which often happens before a major demand shock, perhaps one driven by accelerating Chinese restocking due to a growing credit impulse there?
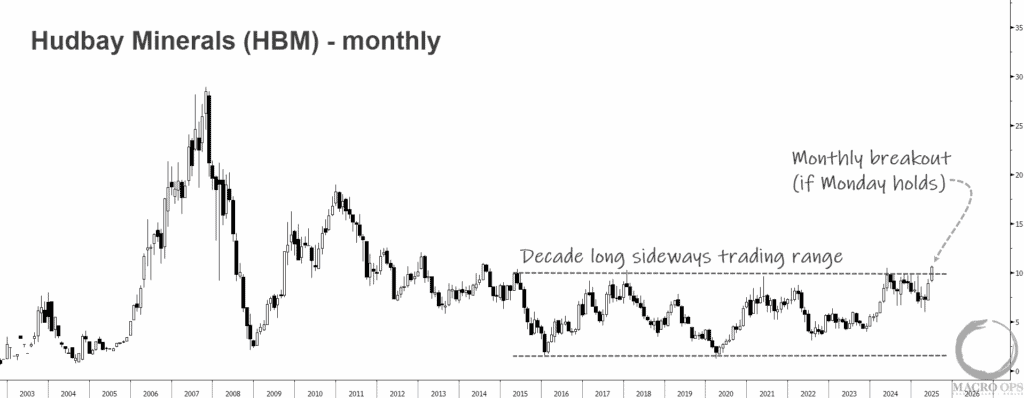
10. TGB, HBM, and SCCO are the three best-performing US-listed copper miners over the past year. Here’s HBM’s monthly chart. It’s a beaut… breaking out on the monthly from a decades-long sideways trading range.
Join The Collective
Thanks for reading.