There are two competing truths in this market right now:
- Trend Fragility: Retail and fund managers are at or near multi-year highs in levels of risk-taking. Breadth vs price divergences is at historical extremes.
- Growth Expectations Rerating: Consensus growth expectations remain too bearish. This low hurdle creates a constant upward revising of expectations (positive surprises), and a strong bullish tailwind.
We’ve been talking about the first for the last couple of weeks so I’ll only update a few of the charts here.
Short-term market breadth remains at its widest diversion from the tape since the weeks preceding the Feb 20’ top. It looks as though it may be starting to turn up and converge with price. But every day it doesn’t, the odds rise that we’re nearing a more significant market top — SPX is currently in its 10th percentile of trend durations without a 10%+ correction.

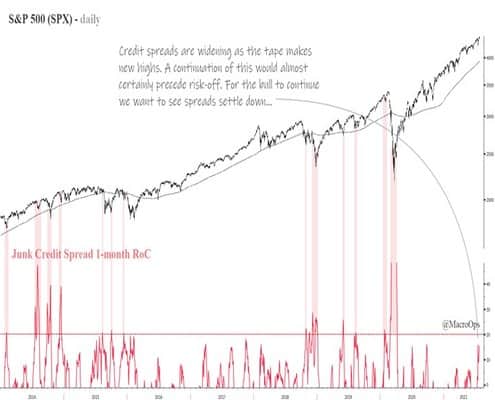
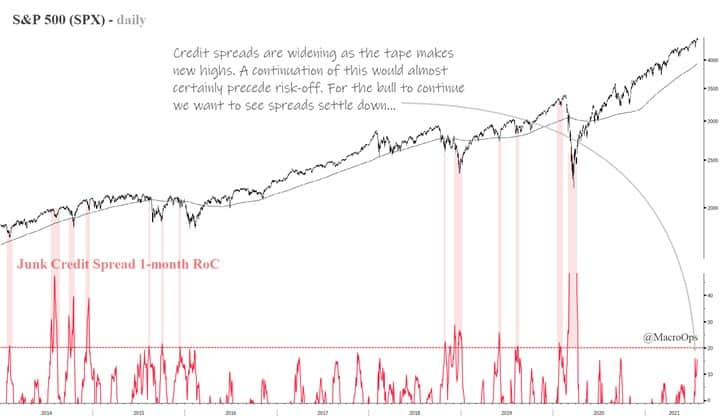
Credit spreads are beginning to widen. Its 1-month rate of change is nearing levels that either coincides with (1) bottoms of corrections or (2) tops that precede larger corrections. A rise above the 20 mark (red dotted line) without a corresponding drop in the market, would be reason for caution.
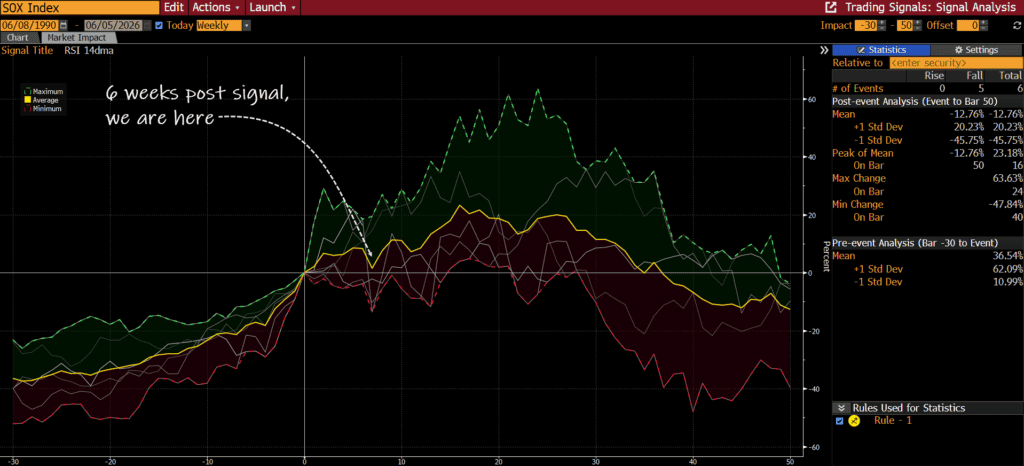
And while the semi index is on the cusp of breaking out from its extended trading range. Its breadth is still not confirming a bullish impulse. An upwards breakout combined with a decline in breadth below the 70% level (red dotted line), would suggest the market is putting in a large bull trap.

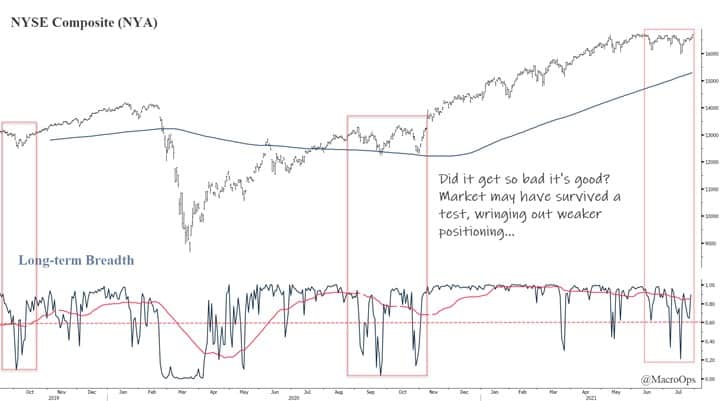
It’s the same picture with the NYA. But here it looks like breadth might be strengthening again, albeit from weak levels.
The way I think about market breadth is like an advancing military force. Strong breadth is similar to an army with a deep and disciplined line (this is old school battle where the fighters stood shoulder to shoulder). That line has strength and weight behind it. It can move and push through barriers.
On the other hand, when the line is thin and begins to fracture. It doesn’t take much from the opposing force to break it completely. This is how major trend changes happen. Each issue in an index is equivalent to a soldier standing on that line.
The bull case here is that breadth is so bad, it’s good. The idea is that despite the weak breadth, the indexes have held their own. And the hope is that the oversold weaklings will revert to their stronger peers — join them back in the front lines…
The study I shared in this week’s dozen shows this a possibility. The backtest looks at past instances where the RTY was both above its 200-day moving average and breadth was this poor.
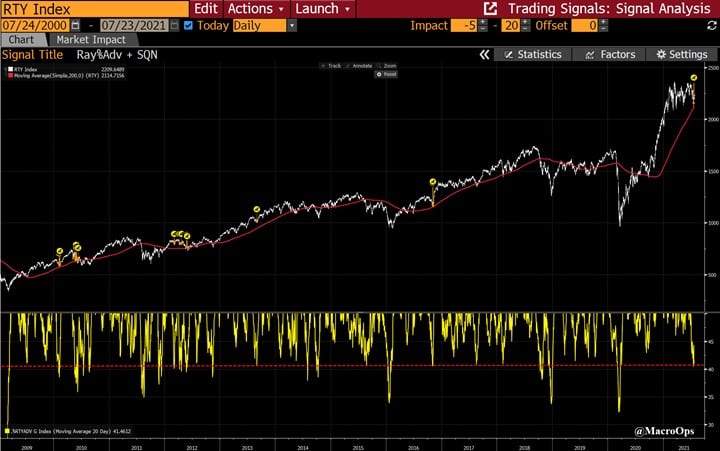
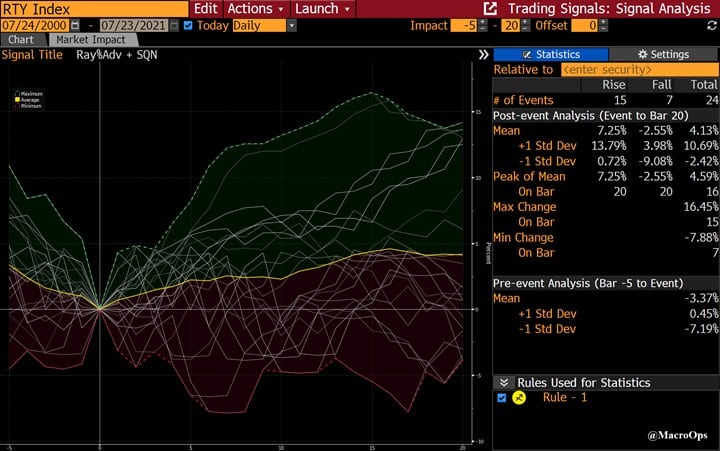
The results show that this tends to be a positive signal. Out of 22 instances, 68% saw positive returns over the following 20 trading days with an average return of 7.25%, which is quite significant.
A key difference though is that in past instances, the weak breadth tended to be isolated to just the Russell, while the other major indices showed greater strength than they do now.
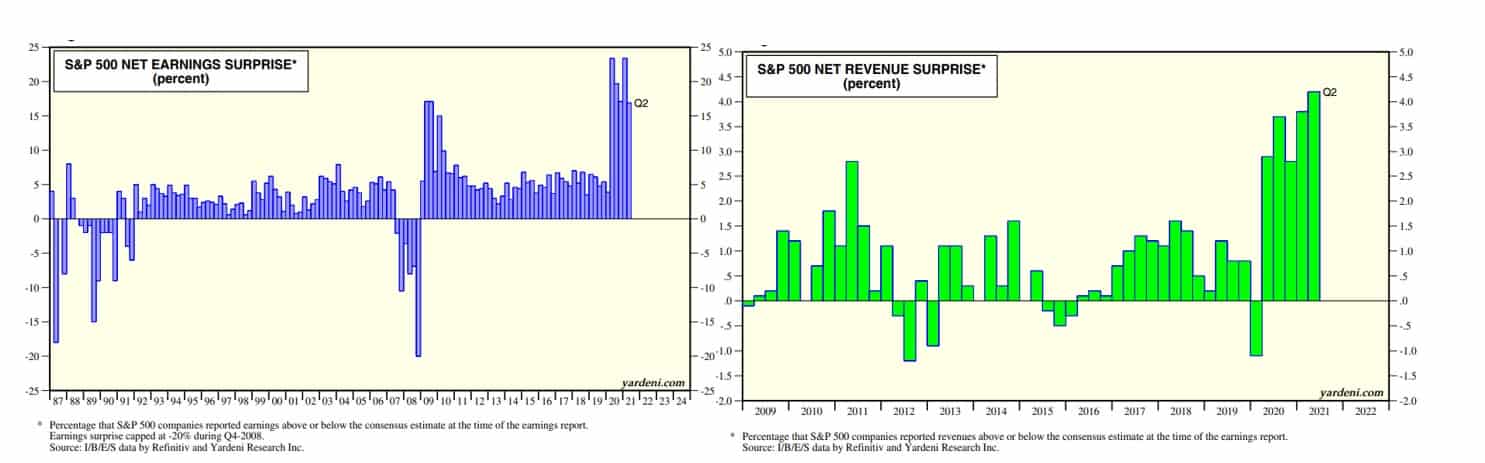
A tailwind of surprises…
The size and consistency of the revenue and earnings beats we’ve seen over the last five quarters are examples of the too bearish — or not bullish enough — anchoring by analysts and investors. This low hurdle creates a positive tailwind for risk assets (charts via Yardeni.com).
Considering the global economy has yet to fully normalize due to the Delta variant, the slow vaccination roll out globally, and the many supply bottlenecks crimping demand, etc… We have still yet to see the full impact of the historic levels of global stimulus that’s been juiced into the system — not to mention the credit multiplier from repaired balance sheets, higher home prices (greater equity), and 12m+ of pent up demand…
With CAPEX intentions at record levels and corporate buybacks regaining pace, we are set to see well above-trend growth for the next 1-3 years, barring another catastrophic external shock.
Our Growth Composite model, which you can find here on the HUD (for Collective members only), is coming off its highest reading in over 40-years. And while the delta of growth will be lower, the absolute number will remain well above average.
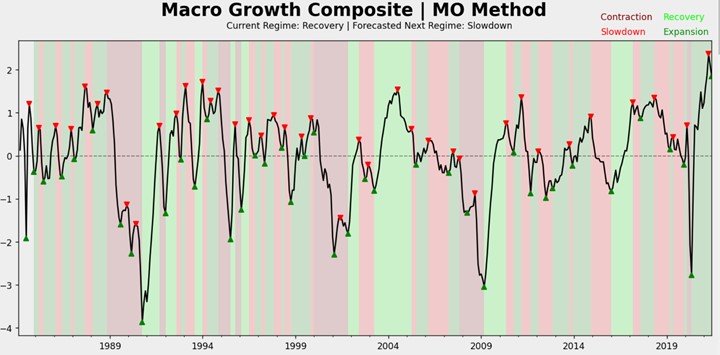
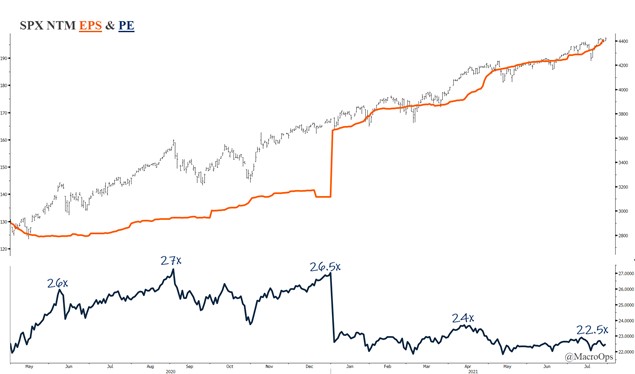
This higher growth is helping to repair US valuations and should continue to do so as long as the market underweight incoming growth.
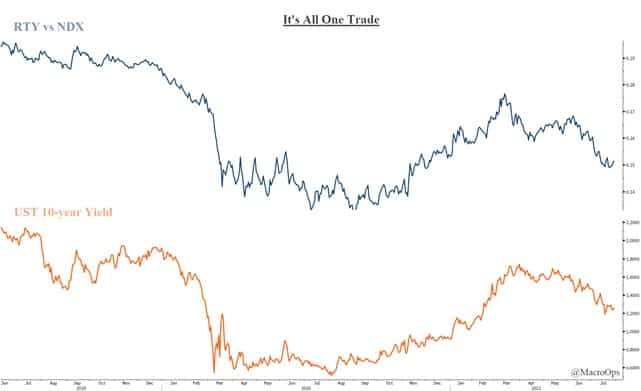
Eventually, higher growth will lead to a steeper yield curve. The big question is does that start now or do yields have one more leg lower, driven by a correction in risk-assets and a reset of current trend fragility?
We don’t know the answer to that but luckily we don’t need to. We have good preconditions for acting, with price action being the final arbiter of course.
First, we have credit spreads. If they continue to widen from here then we’ll know any broader bull action in the market will be short-lived. Second, if semiconductor breadth doesn’t soon turn up and confirm the price, we’ll want to start to get more defensive. Third, if the Rusell (RTY) dips below its 200dma, that’ll be a sign that the bear trap pictured below wasn’t a trap at all.
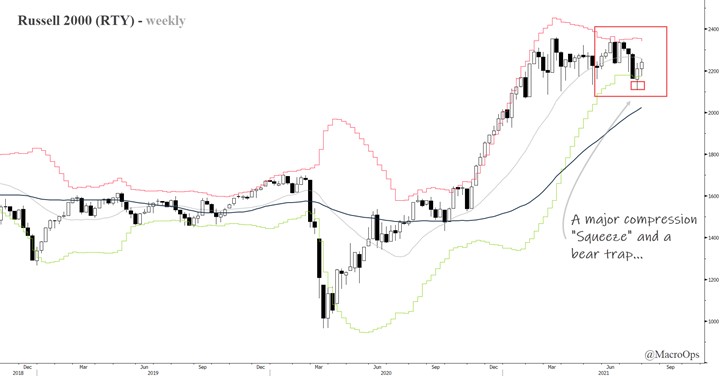
As of now, we have to just respect the price, which continues to set up nicely. Small-caps have begun to outperform over the last few days. And the weekly chart of the Russell suggests a major bear trap may have been sprung.
It’s also in a tight compression regime which suggests a big move is coming, giving weight to the aforementioned study. We’ll look to get long should we see upside follow-through.
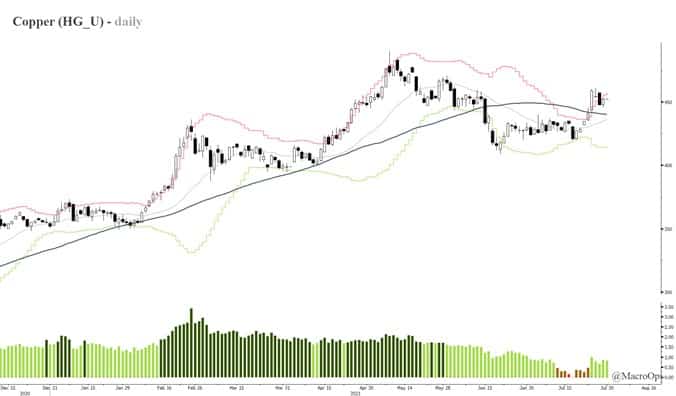
Copper continues to trade well. And since the fundamentals are so incredibly strong behind this trend we’re going to aggressively pyramid our position at technical entry points.
The tape has formed a nice bull flag following its breakout.
We’re putting in a Buy Stop order a tick above yesterday’s high at 4.5520. That way we let the market pull us into the trade.
We’ll size the risk at 50bps with a stop a tick below yesterday’s low at 4.4570.
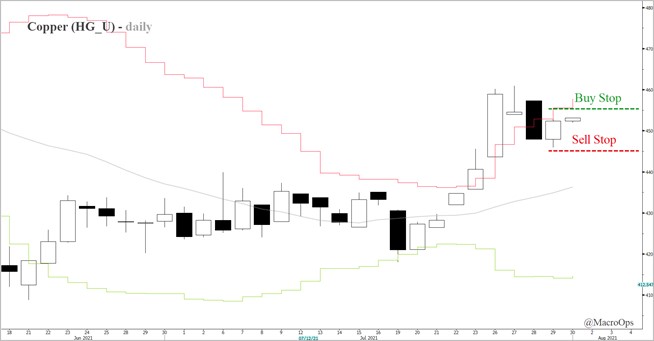
We’ll send out a trade alert if/when it triggers.
To summarize, we remain in a period of high dissonance but this looks to be resolving. We should have greater clarity within the next week or two on where things are headed next. We have our conditional markers and know what to look for. No need to guess or have strong opinions… We can just wait for the data to tip its hand.
Until then, stay safe and keep your head on a swivel!
Hit me up in the CC if you have any questions or comments.