“I discovered that the British stock market bottomed for all time in the summer of 1940 just before the Battle of Britain; that the U.S. market turned forever in late May 1942 around the epic Battle of Midway; and that the German market peaked at the high-water mark of the German attack on Russia just before the advance German patrols actually saw the spires of Moscow in early December of 1941. Those were the three great momentum changes of World War II — although at the time, no one except the stock markets recognized them as such. This, to me, confirmed the extraordinary (and unrecognized) wisdom of market crowds.”
~ Barton Biggs in Wealth, War, and Wisdom
Good morning!
In this week’s Dirty Dozen [CHART PACK] we look at the latest BofA FMS, we try to do some triangulation amongst all the contradictory sentiment and positioning data. We look at cyclicals and big overweights, and then discuss oil cycles and sailboats, plus more…
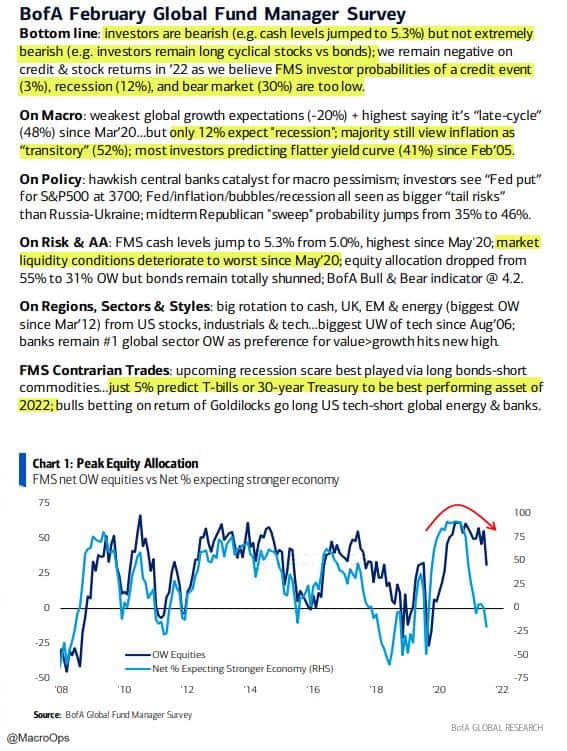
- Here are the summary highlights from the most recent BofA Global Fund Manager Survey.
Key takeaways: investors are bearish but not very bearish; they’re very long cyclicals vs bonds; low expectations of recession and bear market; believe inflation transitory; while liquidity conditions are tightest since May 20’.
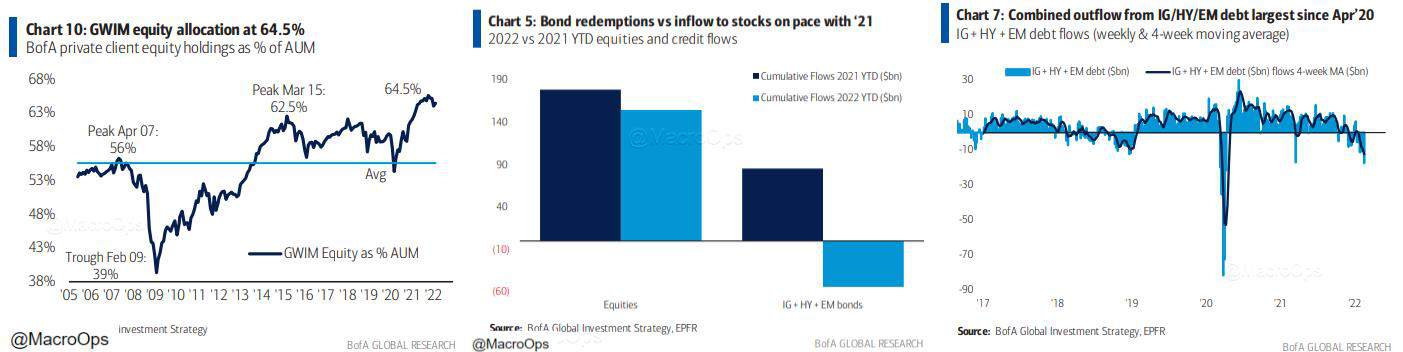
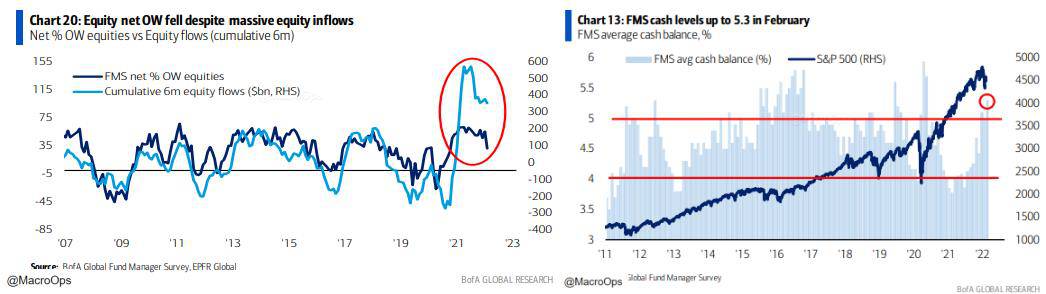
- Triangulating sentiment/positioning has been more difficult than usual as there’s a number of contradictory data and competing narratives. Here’s a few examples: GWIM client positioning in equities still near all-time highs, while flows into equities are nearly tracking the records seen last year in 21’, though there are the largest outflows from HY since Apr 20’.
- BofA’s Bull & Bear INdicator is still in neutral territory, primarily due to the very strong equity inflows.
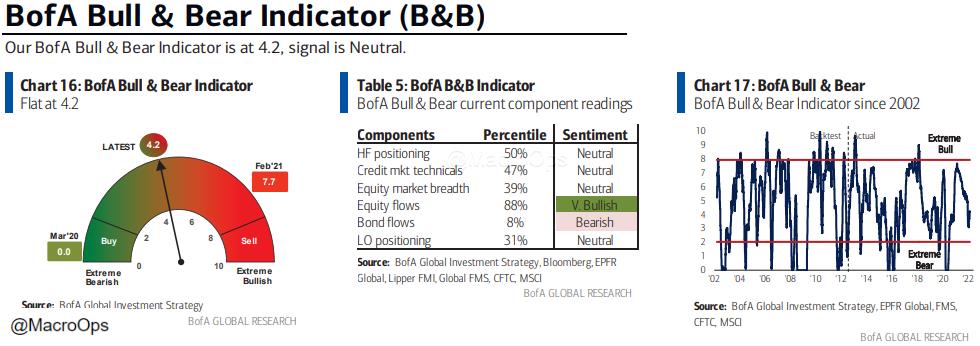
- More head scratchers…Large cumulative equity inflows, Equity overweights just barely off the record highs, while cash levels jumping up significantly and triggering a BofA Buy Signal.
- All of the above is clear as mud… I get it. This one is a bit more straightforward and the most interesting data point from the survey.
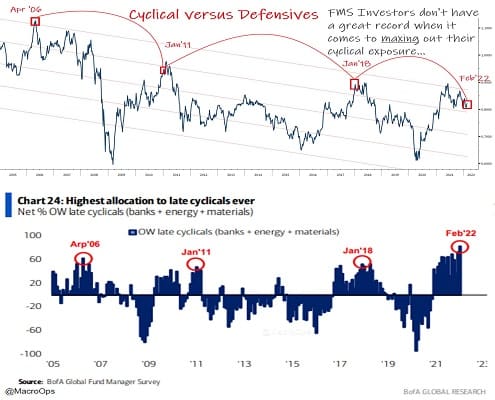
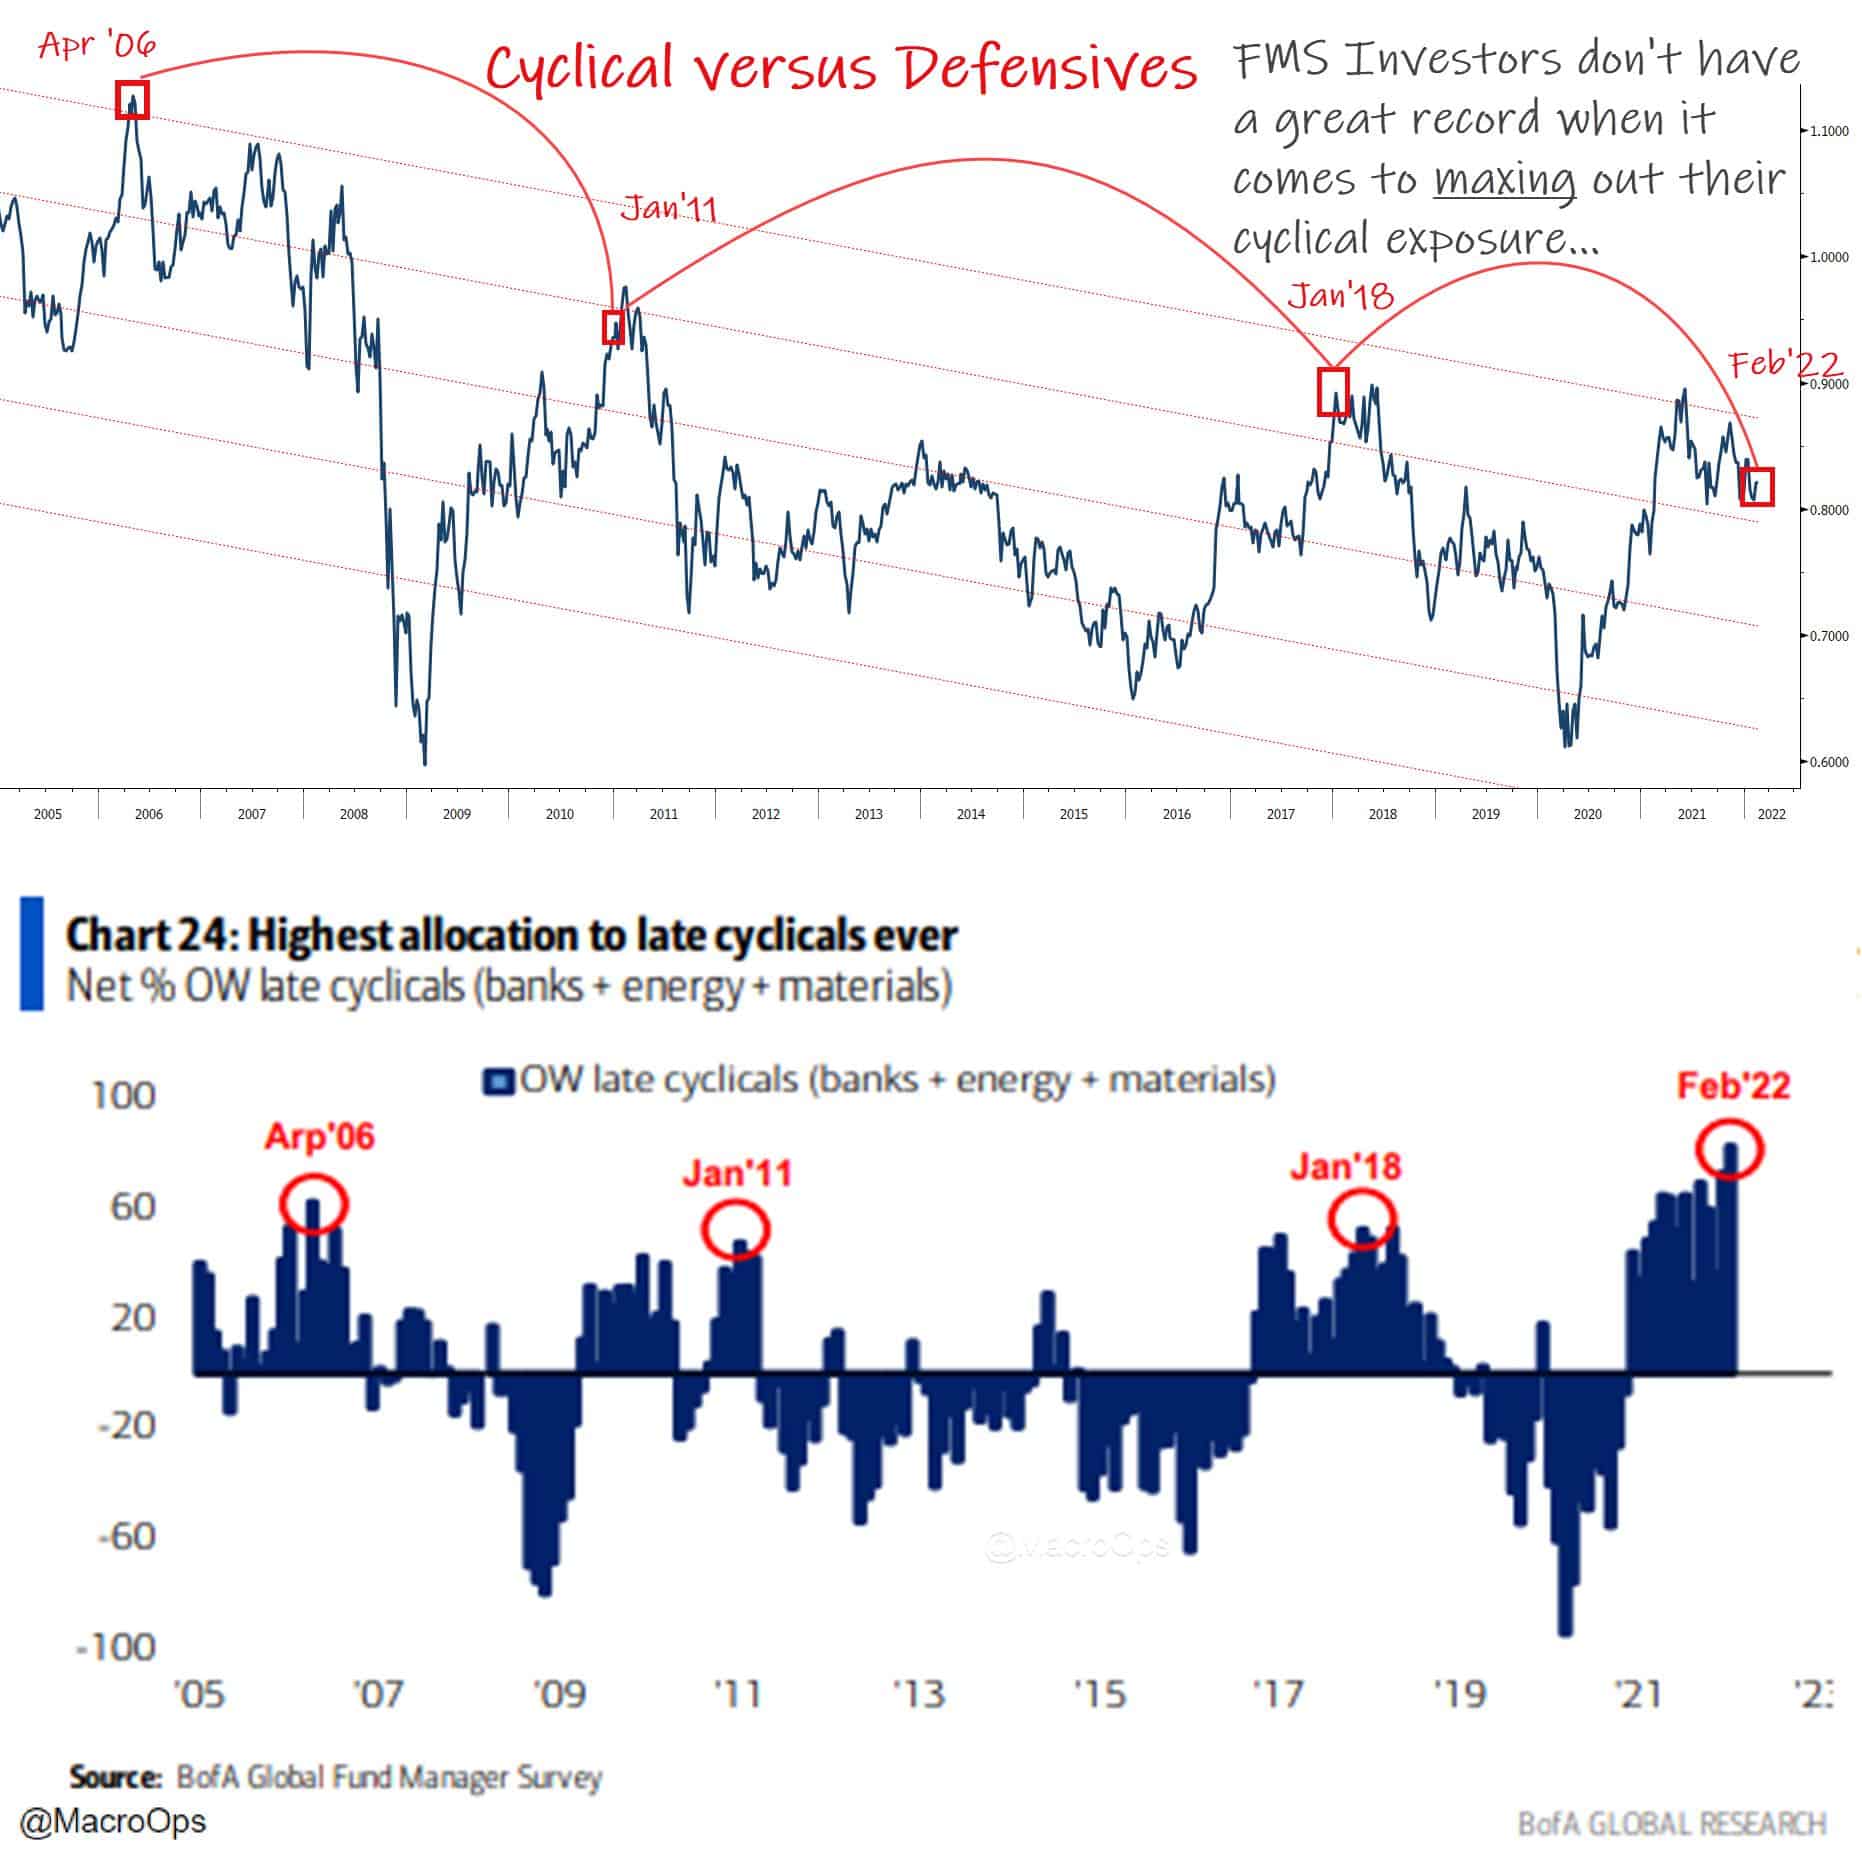
FMS Investors have their largest overweight to Cyclicals on record. Record positioning like this is always worth digging into. So I threw up a chart of Cyclicals v. Defensives on top. It’s only an n of 3 but FMS investors don’t have a great track record in the cyclical trade, so look for a fade.
- I shared this one recently but I think it’s a helpful to understand the potential for a further unwind here.
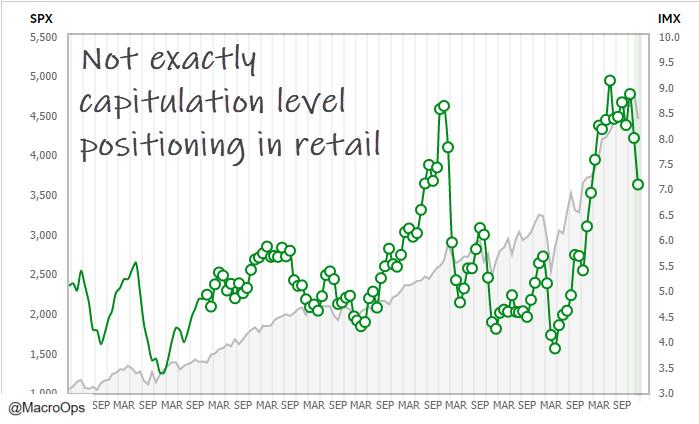
I like the TD Ameritrade IMX because it’s hard positioning data of retail accounts. It tracks the “holdings, positions, trading activity, and other data from a sample of 11 million funded client accounts.” The most recent data point is Jan, so I’m interested to see where Feb shows up (I assume lower). But according to TD, retailers were “were net buyers of equities in January, the sector mix showed a preference for Information Technology, Communication Services, and Consumer Discretionary.”
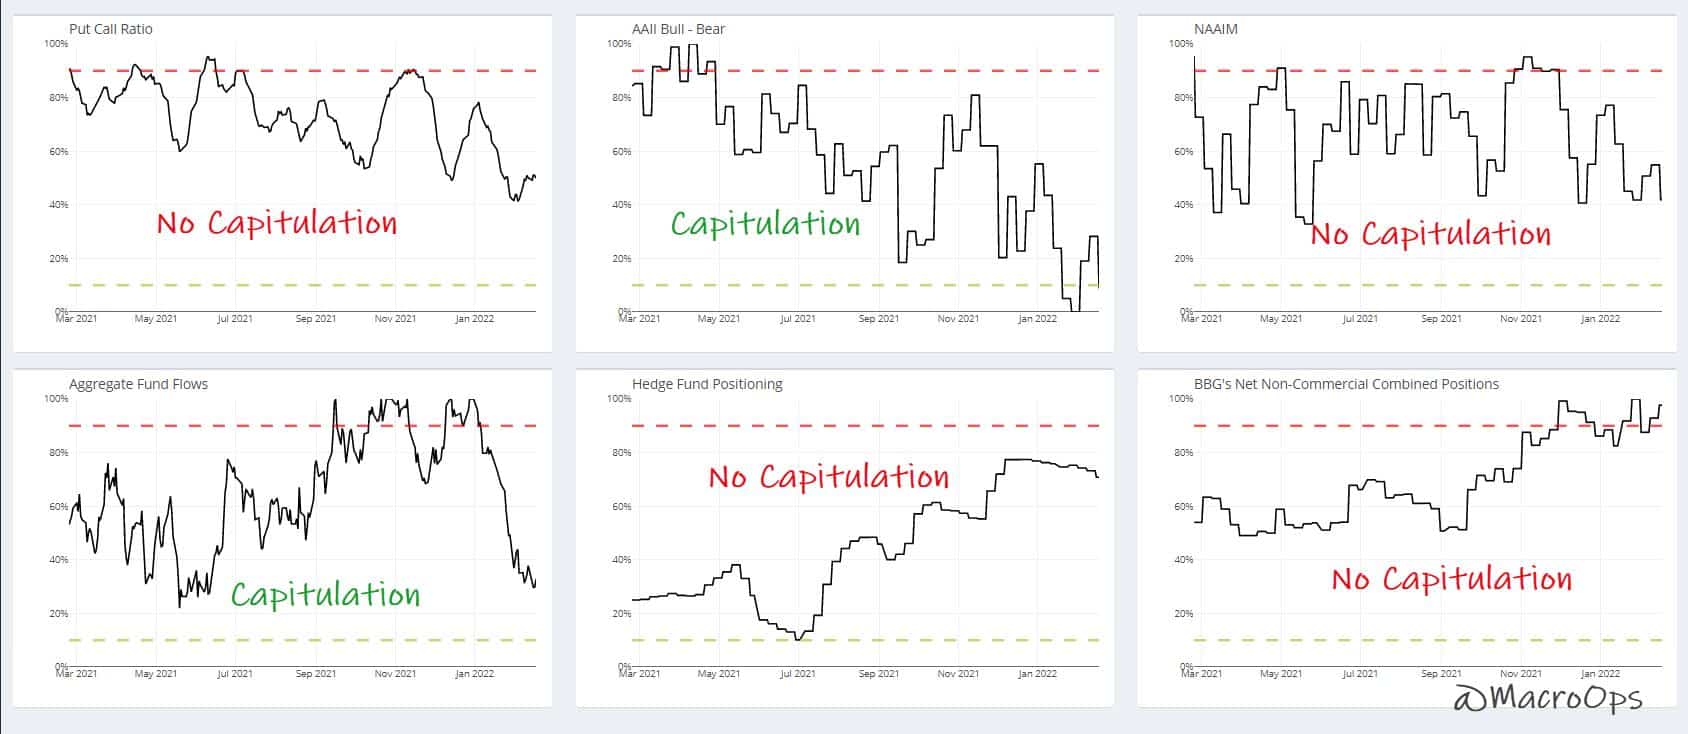
- And some of the inputs from our Trend Fragility dashboard. Yeah, we have capitulation in AAII. Our measure of aggregate fund flows has come down to neutral but not quite oh sh*t the world is ending levels. But Put/Calls, NAAIM, and HF Positioning are still nowhere near capitulation levels. And aggregate Index CoT Spec positioning continues to show a strong bid for risk.
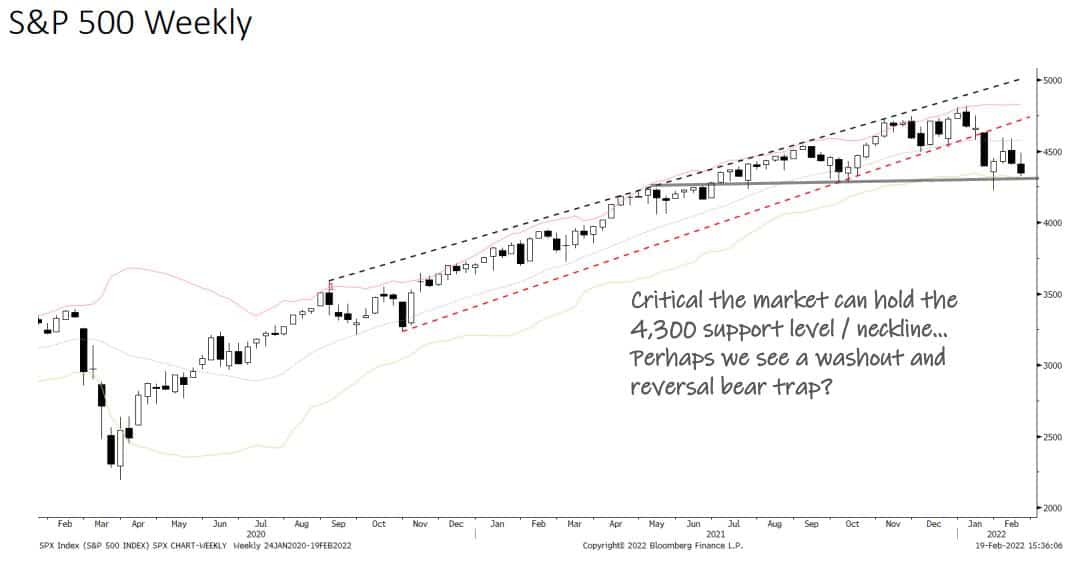
8. We’re still leaning bearish but the index is coming up against major support. So be on the lookout for a potential flush out bear trap double bottom this week. But a weekly close below would complete a MAJOR H&S top and give the SPX a measured move target of roughly 3,700.
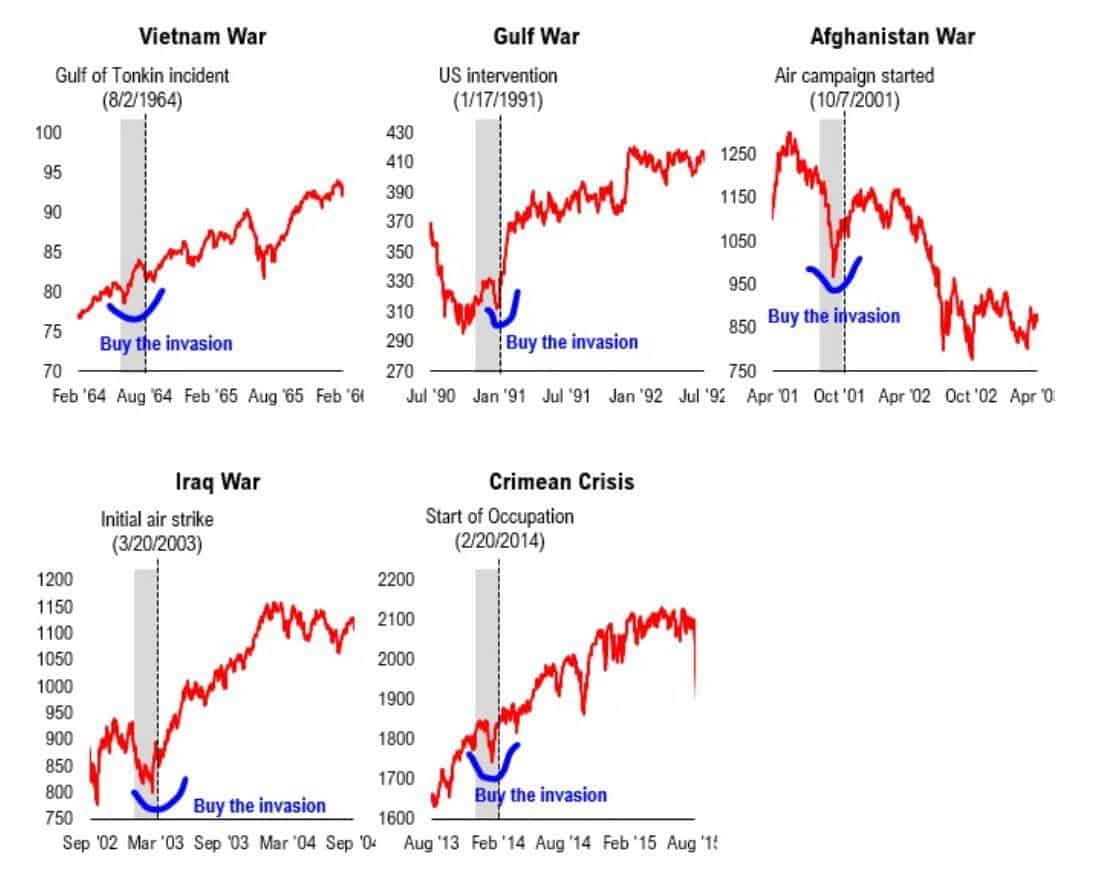
- This chart was making the rounds on twitters. Tried looking up who’s it is but was unable to find attribution so apologies to the creator.
It is true that you typically want to sell the rumor and buy the event when it comes to war. But, I take issue with applying this to the Russia-Ukraine conflict, because that’s not at all what is driving risk-off right now. It’s the Fed, it’s inflation, it’s rates, it’s tightening liquidity, etc…
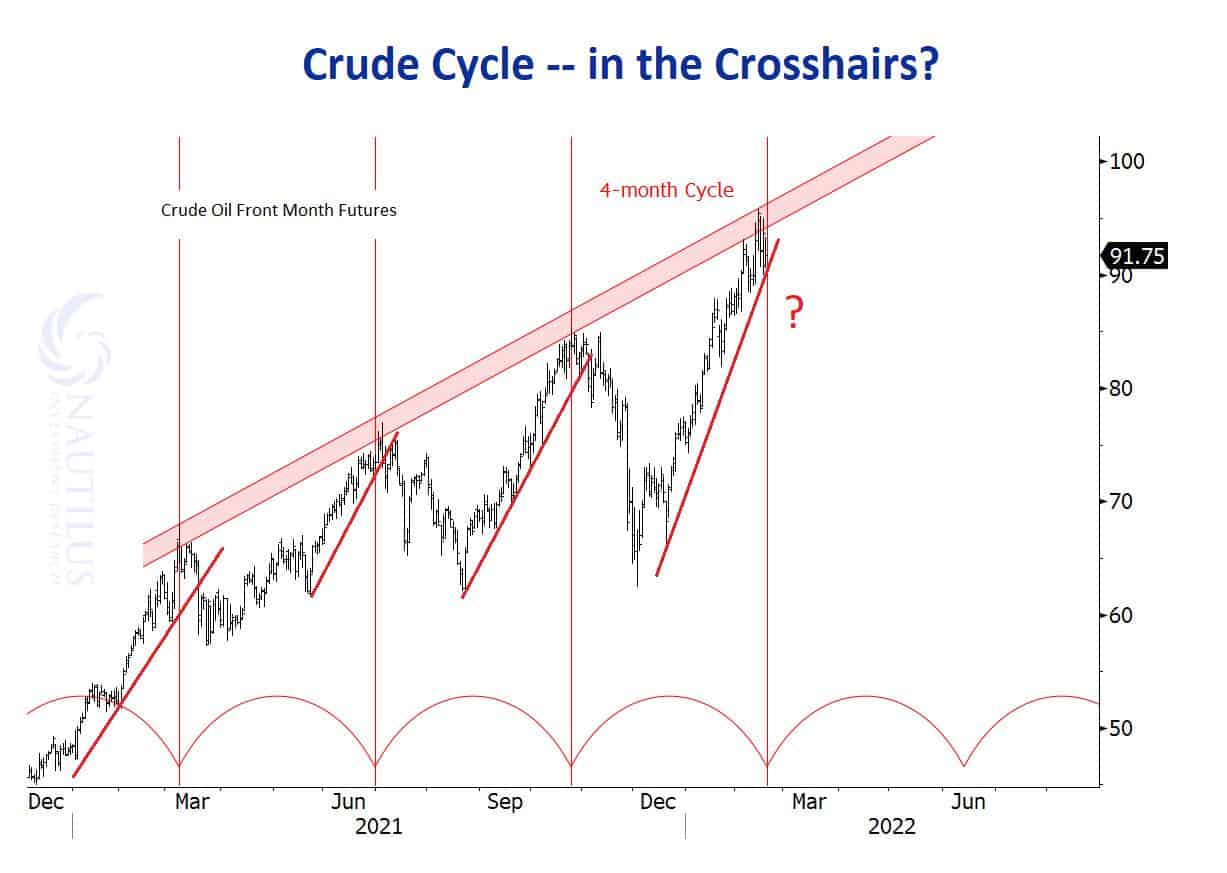
- Four month Crude Cycle at play? Interesting chart from @NautilusCap.
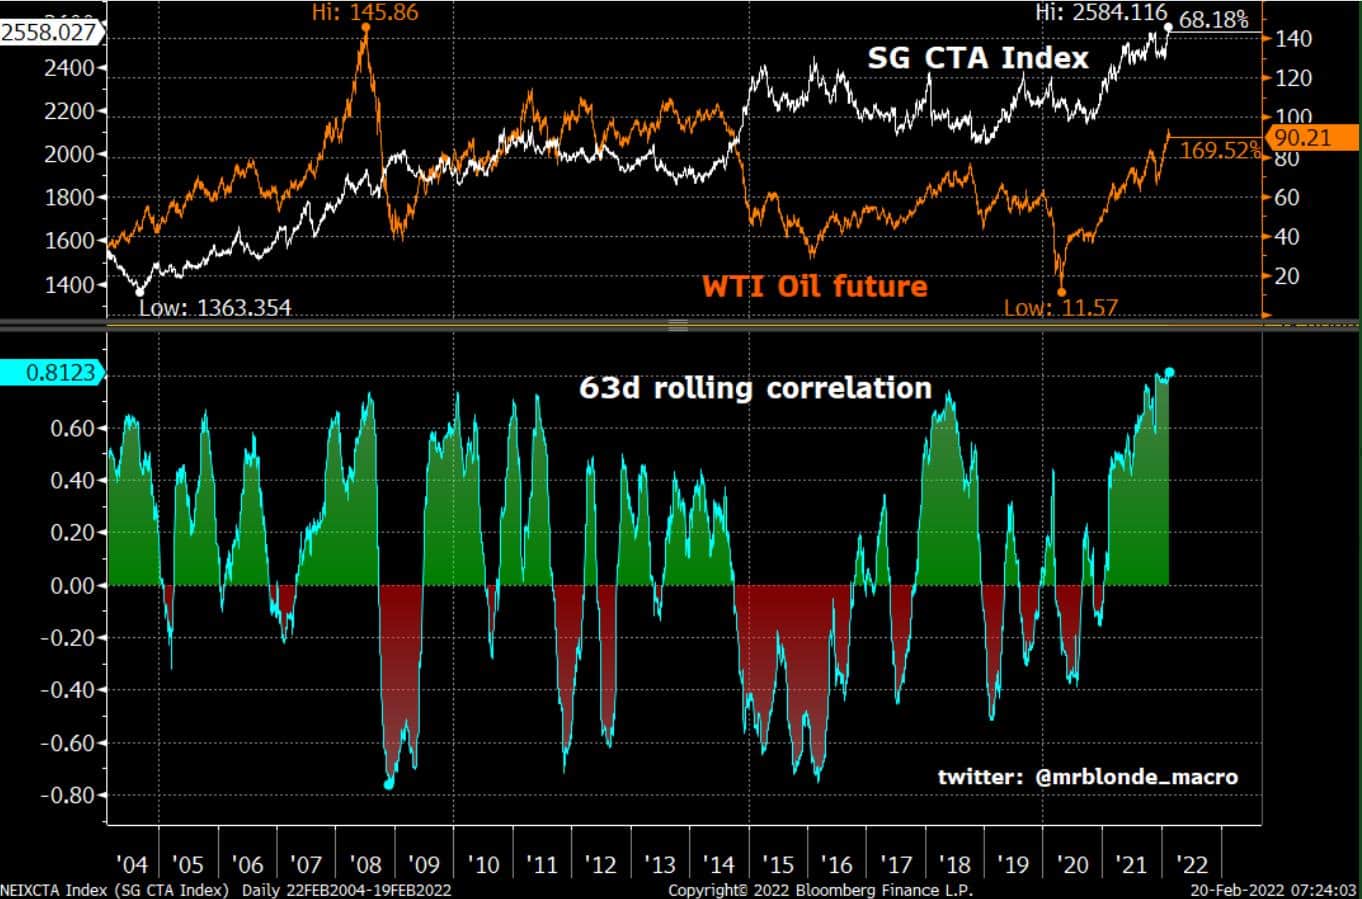
- Also, this from @MrBlonde_macro “CTA exposure to oil prices is very high, likely reflecting both long oil and short duration positions which have become highly correlated. any lost momentum in this space can result in pro-cyclical selling pressure.”
- Came across this the other day as it was pinned to a wall of a local bookstore I was perusing here in Homer, Alaska. Had to take a photo. I love everything this. The pic, the quotes, the message. Everything.

Join The Collective
Thanks for reading.
Stay frosty and keep your head on a swivel.


