“The mind can be a wonderful tool for self-delusion – it was not designed to deal with complexity and nonlinear uncertainties. Counter to the common discourse, more information means more delusions: our detection of false patterns is growing faster and faster as a side effect of modernity and the information age: there is this mismatch between the messy randomness of the information-rich current world with complex interactions and our intuitions of events, derived in a simpler ancestral habitat – our mental architecture is at an increased mismatch with the world in which we live. ” ~ Nassim Taleb
Good morning!
In this week’s Dirty Dozen [CHART PACK] we look at record fund flows, collapsed sentiment, bullish momentum with short-term concerns, positively diverging credit, bad economic misses equaling good equity market returns, exponentially growing compute needs, an E&P name, plus more…
***click charts to enlarge***
- One of the components of our Trend Fragility indicator is aggregate US fund flows. These flows climbed into the 99th percentile last week. The last time fund flows were anywhere near these levels was February 2020 and January 2018.

- Typically this type of piling into US stocks is accompanied by equally strong sentiment. But that is not the case, at least not when looking at AAII Bull-Bear sentiment which fell last week to its lowest level in 12 months.

- There’s a lot of noise in these markets… Between the internals, divergences, and funky economic data, there’s evidence to support whatever bias you’ve got. This is why it’s important to check in on the best indicator there is, price.
Pulling out a bit we can see that the SPX is in a strong uptrend and has put in 7 consecutive monthly bull bars.

- Seven consecutive monthly bull bars in the SPX is rare. It’s only happened six other times. Only once has it put in nine bull bars, and never ten. Our back tester shows a bullish long-term bias but with high odds of weakness over the next 0-3 months.
So a couple of things to take away from this. One, momentum is one of the most dependable market factors and 7 bull bars means there’s a lot of buying strength behind this trend, which suggests it likely has much further to go. Second, the forces of mean reversion and profit-taking will eventually, and likely soon (within the next 2-months), lead to a 1-3 month 10-20% correction. This would be a healthy pullback within a larger bull trend.

- The SPX put in two consecutive bear bars and with the backdrop of euphoric fund flows, we have to be ready for more potential downside over the short-term.
However, another interesting divergence is in credit. LQD/IEF has been trending up while the SPX has gone down. Positive divergences like these typically lead to strong upside follow-through in stocks. Maybe we get a washout reversal into this week’s FOMC?

- Our Trifecta Lens Score which measures various breadth, liquidity and sentiment indicators (you can read more about it here), is neutral as is our SQN market regime. Similar to the above, this is not typically what you see underlying a blow off top.

- Also, economic data has been coming in soft relative to expectations since the beginning of the year. The Citi US Economic Surprise Index (CESI) is turning up from the lower end of its historical range. I ran a backtest to look at SPX’s historical returns following a turn in CESI above a -50 reading (past instances marked in yellow).

- Improving data relative to expectations has typically been a good backdrop for risk assets. The SPX saw positive returns 15 of 18 times over a following 2-month period, with average gains of 4.7%.

- This should be helped further along by what looks like a peak in the Delta wave here in the US.

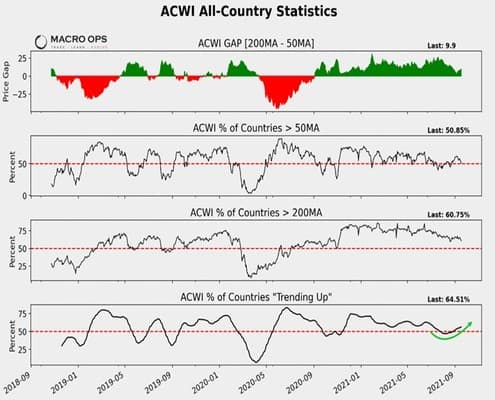
- Also, another positive long-term sign is that we’re seeing an increasing percentage of country indices turning back into uptrends.

- “We are creating 2.5 quintillion (million trillion) bytes of data, every day! (DOMO, WEF) and global data is doubling every 2-3 years (IDC)” ~ BofA.
This is why we continue to be bullish semis. And while we agree with Gavin Baker’s recent take, that eventually they’ll get hit with an inventory cycle (read the latest interview with him here). We’re in a longer-term demand super cycle while the capacity is more constrained. Read our long-term semi bull thesis here.

- We’re big energy sector bulls. Between the CAPEX cycle, ill-advised government policies, and ESG incentives starving the space of capital, oil is tee’d up for a big cyclical bull market. This has been years in the making and is just getting started (you can read our long-term bull thesis here). And the short-term technicals are very supportive as I’ve noted recently (here and here).
There’s a number of names we like in the space. FANG is not a pick of ours but is a good company, with a nice chart, and which recently announced a massive buyback and debt reduction program.

Thanks for reading.
Stay safe out there and keep your head on a swivel.


