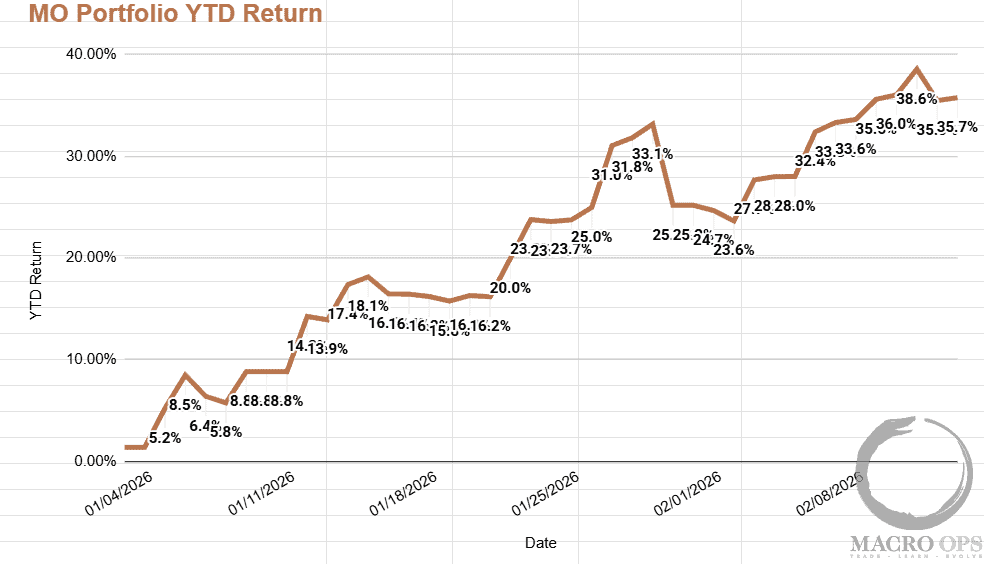
Summary: The MO portfolio currently sits 3% below its YTD peak of 38.6%. Over the past two weeks, we have significantly reduced net long exposure and will remain defensively positioned until our “trifecta” setup improves. While healthy aggregate breadth suggests any potential selloff should be limited to less than 7%, our internal indicators are diverging negatively, signaling increased market fragility. On the macro front, strong growth and a stable labor market suggest recent inflation data is misleading. Notably, railroad stocks are breaking out, and the Japanese Yen appears to have bottomed.
MO Portfolio & Trades
1. The MO portfolio is up +35.8% ytd. This is a strong start to the year, and historically, our worst drawdowns follow our biggest gains. To prevent this tendency and protect our profits, we’ve dramatically reduced net exposure in our book over the past two weeks, and we’ll continue to run light until we see either a reset in Trend Fragility, an improvement in the Trifecta setup, or ideally both. If you’d like to join our Collective, click here.
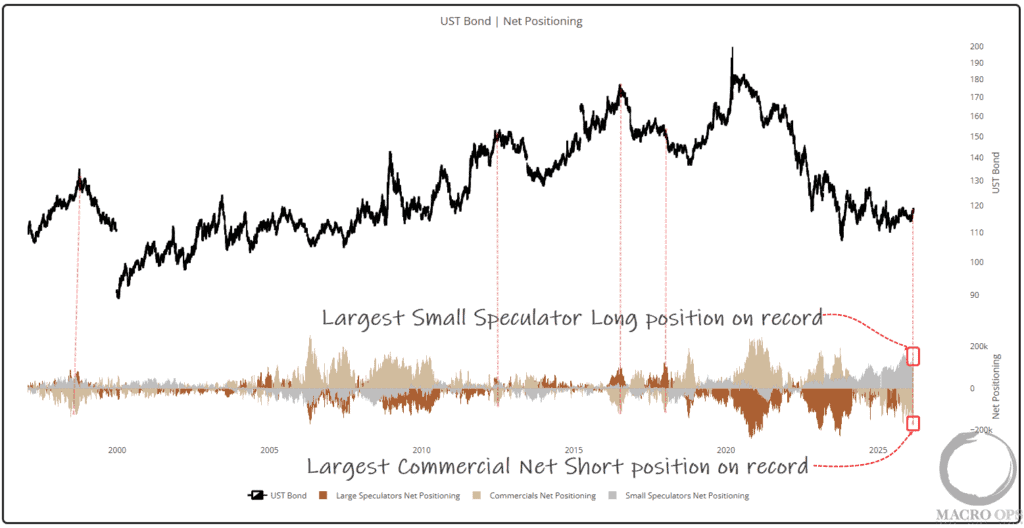
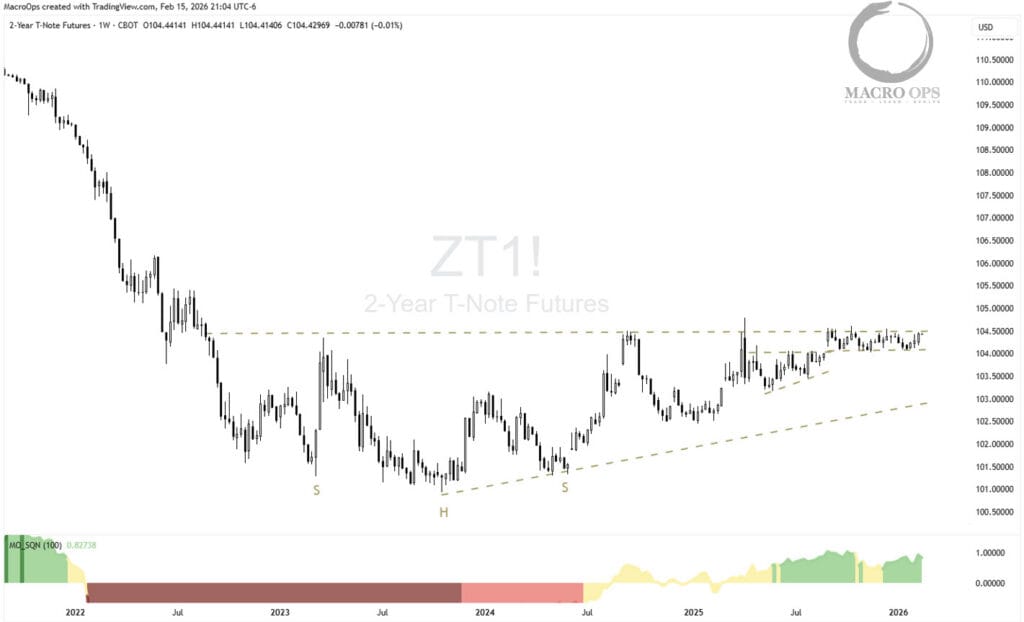
2. Our two most compelling positions are currently long Swiss Franc (CHF) and long 2-year US Treasuries. The Swissie is coiling above a seven-month rectangular base while large speculators remain heavily short; we intend to increase our position once it breaks out from this wedge.
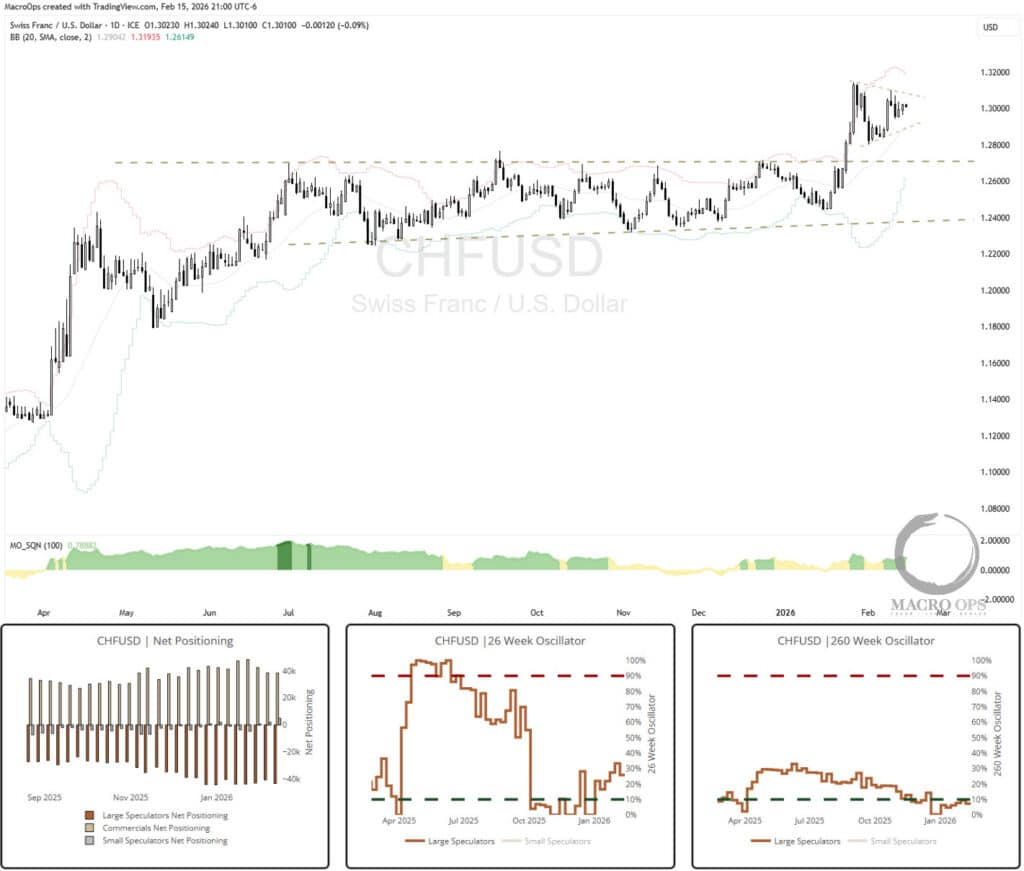
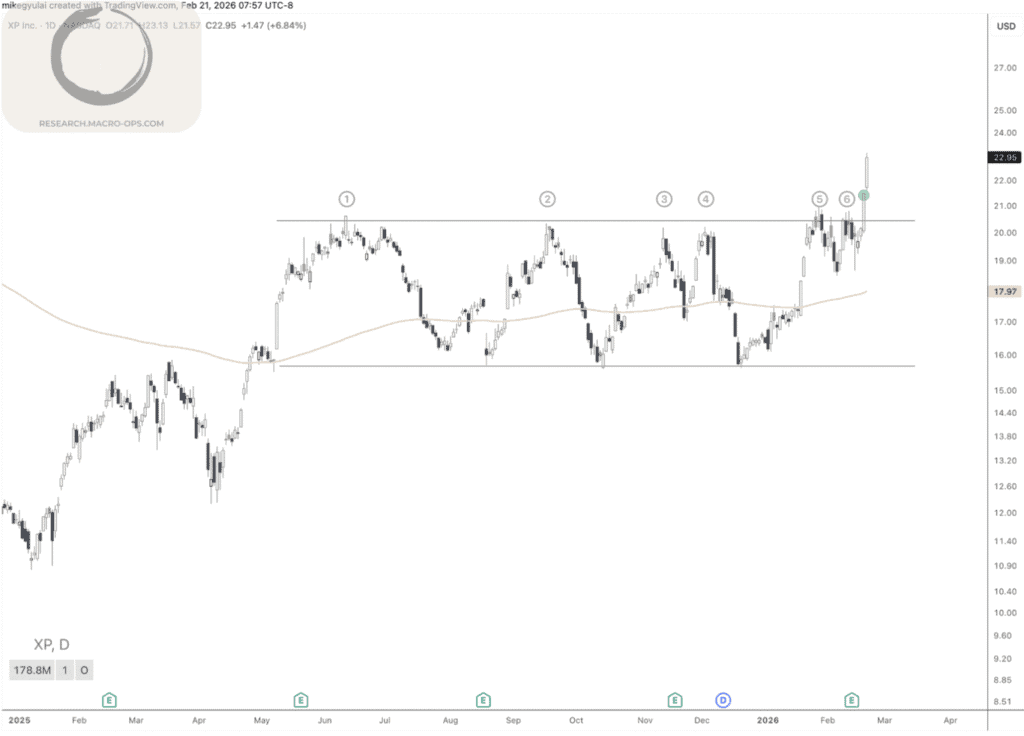
3. We’ve been writing about this setup for nearly a year now. The chart has nested compression regimes. This means a BIG move is coming. Our bias is long (perhaps on the narrative of an AI productivity boom = low inflation), and we hold a small starter long position. But we’re willing to play this in either direction. Pay close attention, a breakout is coming soon…
Trifecta Charts
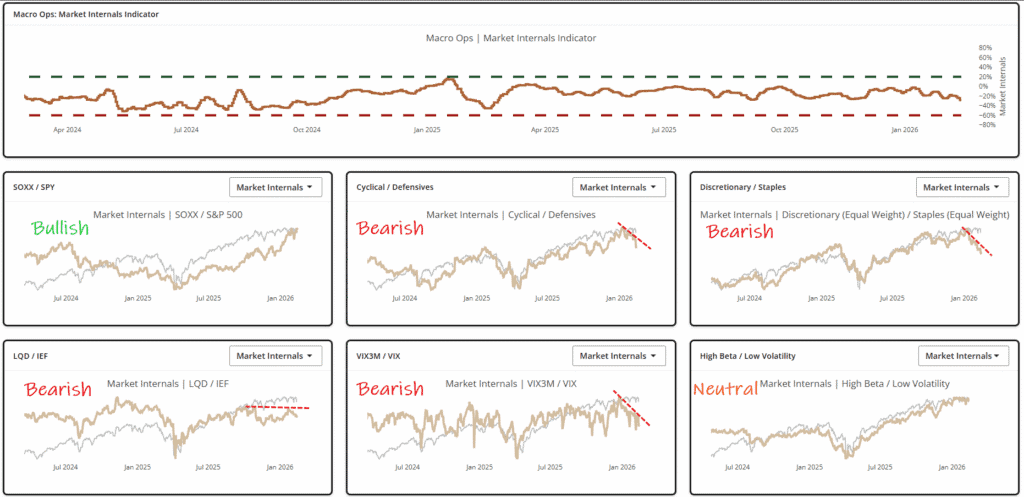
4. Our Aggregate Market Internals are trending lower, with most components showing an increasingly bearish divergence. To avoid a deeper correction, we need to see an immediate reversal in these indicators; the longer these negative divergences persist, the higher the probability—and potential severity—of a market selloff.
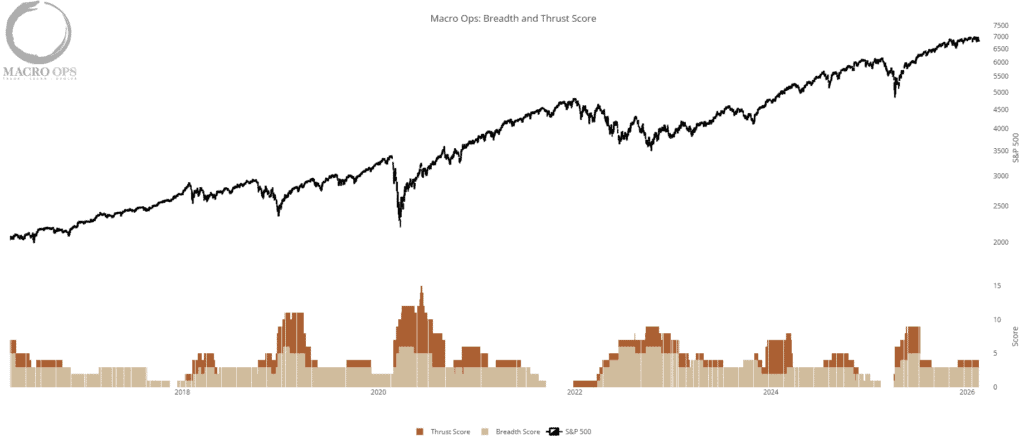
5. Our Aggregate Breadth + Thrusts chart remains strong at +4, indicating that weakness is concentrated rather than broad-based. Most of the selling is in tech and software, with the Mag7 in particular starting to weigh on the index.
Given this backdrop, any market selloff is likely to be contained to under 7%. For the market to regain its footing, we need to see tech and the Mag7 resume leadership. At the moment, energy is the leading sector, and historically, broad forward market returns tend to be weak when that’s the case.
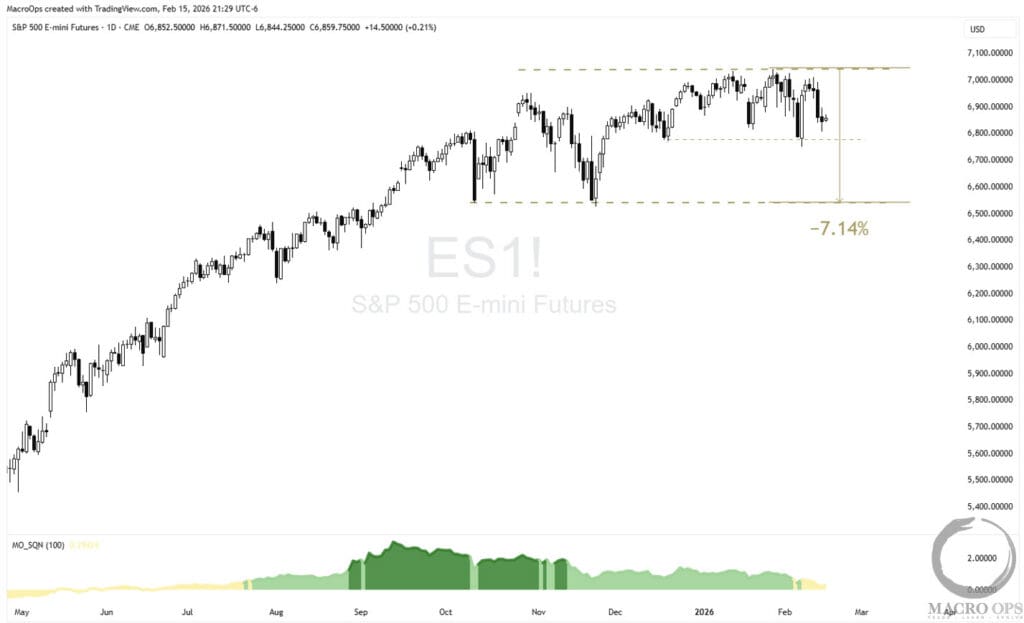
6. ES is stuck in a broad trading range that’s likely to frustrate both bulls and bears. Aside from maintaining small QQQ shorts as a portfolio hedge, I’m not interested in trading this range until we see a decisive shift in direction.
My base case—albeit a weakly held one—is that SPX trades down toward its November lows before it can mount a more sustainable move higher.
Macro
7. The other week, I shared our Market Implied Regime Indicator, which is pricing in an 80%+ chance of a Stagflation regime (high inflation, low growth) over the next 12 months.
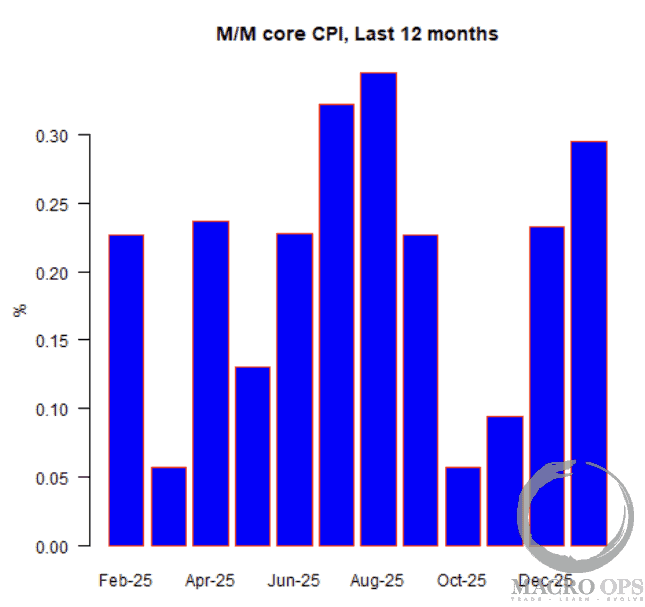
Michael Ashton, writing on his E-piphany blog, makes the reflationary side of the case in a recent post:
“The story in January 2026 is that the waters remain muddied by the government – shutdown – induced gap. The current y/y figures are all flattered by that event and exaggerate how good the inflation picture is. That’s how the Administration can trumpet victory while the reality on the ground is that inflation is not converging to trend…. So when you read that today’s figure resulted in the ‘smallest y/y change in core inflation since 2021, and consistent with the Fed reaching its target’ – that’s just wrong. The true core y/y number is roughly 0.25%–0.3% higher than what printed today.”
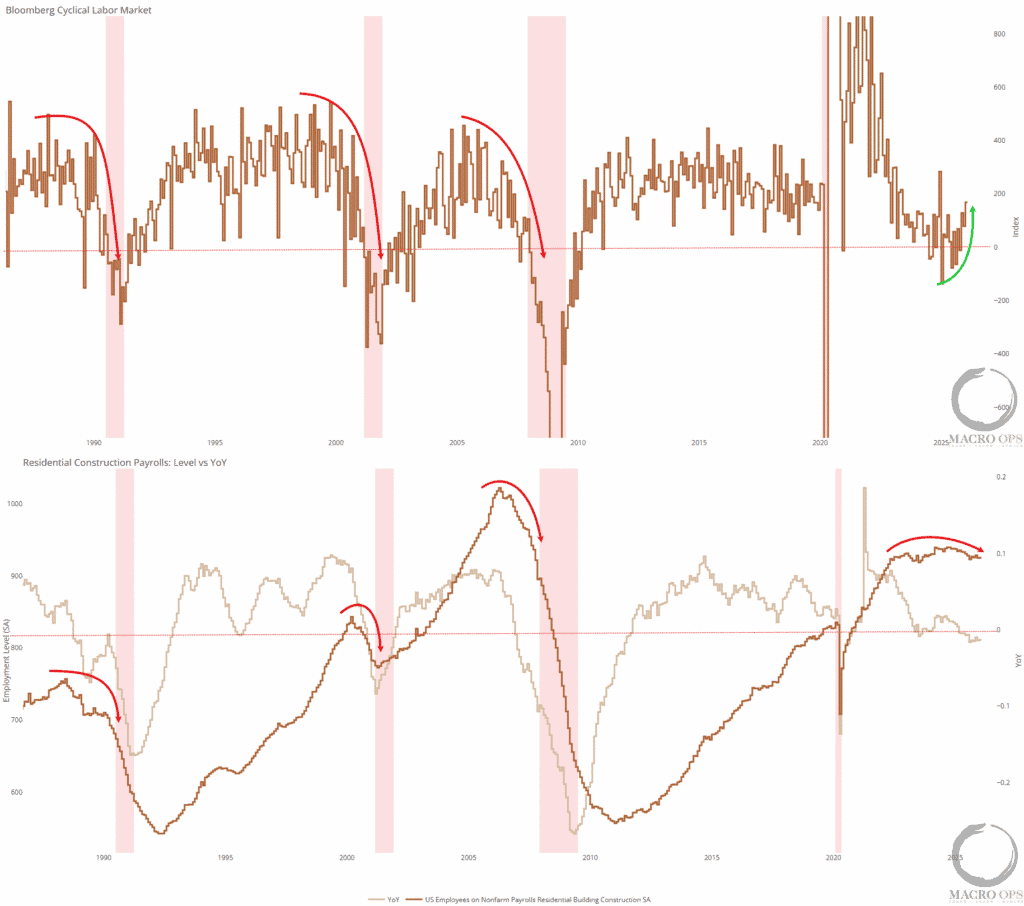
8. Recent labor data showed an upside surprise, though revisions to last year’s figures were weaker than expected. We view the labor market as neutral—neither exceptionally strong nor weak—a stance supported by our Cyclical Jobs Index and Residential Construction Payrolls. While year-over-year construction payrolls have turned negative following revisions, the nominal data is merely moving sideways.
These figures don’t reflect the sharp downward shifts that typically precede a recession; in fact, our Cyclical Jobs measure has actually ticked up after trailing off in late 2025. Ultimately, the labor market remains stable, and recession concerns should be dismissed.
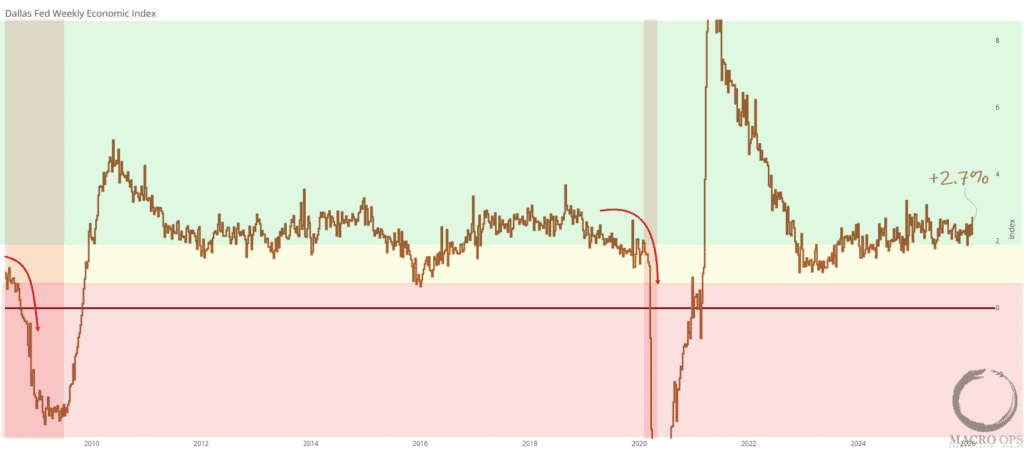
9. If Stagflation is in the cards for ’26, it likely won’t show up until the back half of the year, as many of our growth leads remain strong. Below is the Dallas Fed Weekly Economic Index, which printed at +2.7% last week.
Trade Setups / Topical Charts
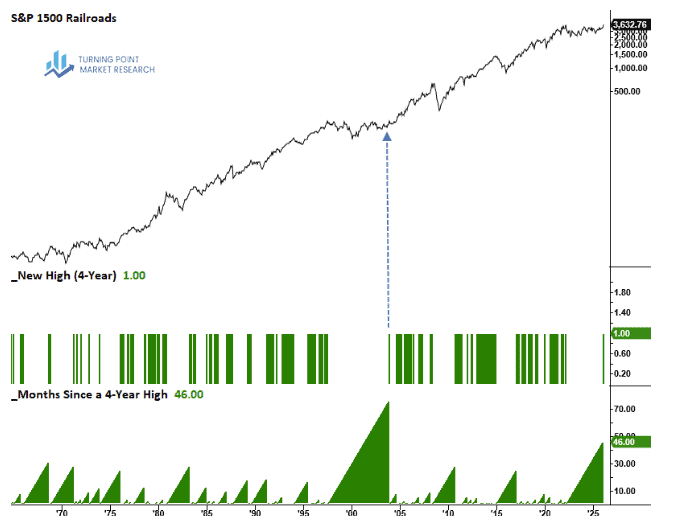
10. This is an interesting — and bullish — signal for the broader growth backdrop from Dean Christian, who notes that “a long-term chart (monthly data) shows the railroad sub-industry is currently experiencing the second-longest consolidation on record. Notably, its prior breakout from an extended base in 2003 marked the start of a value-led equity cycle.” You can read his full piece here.
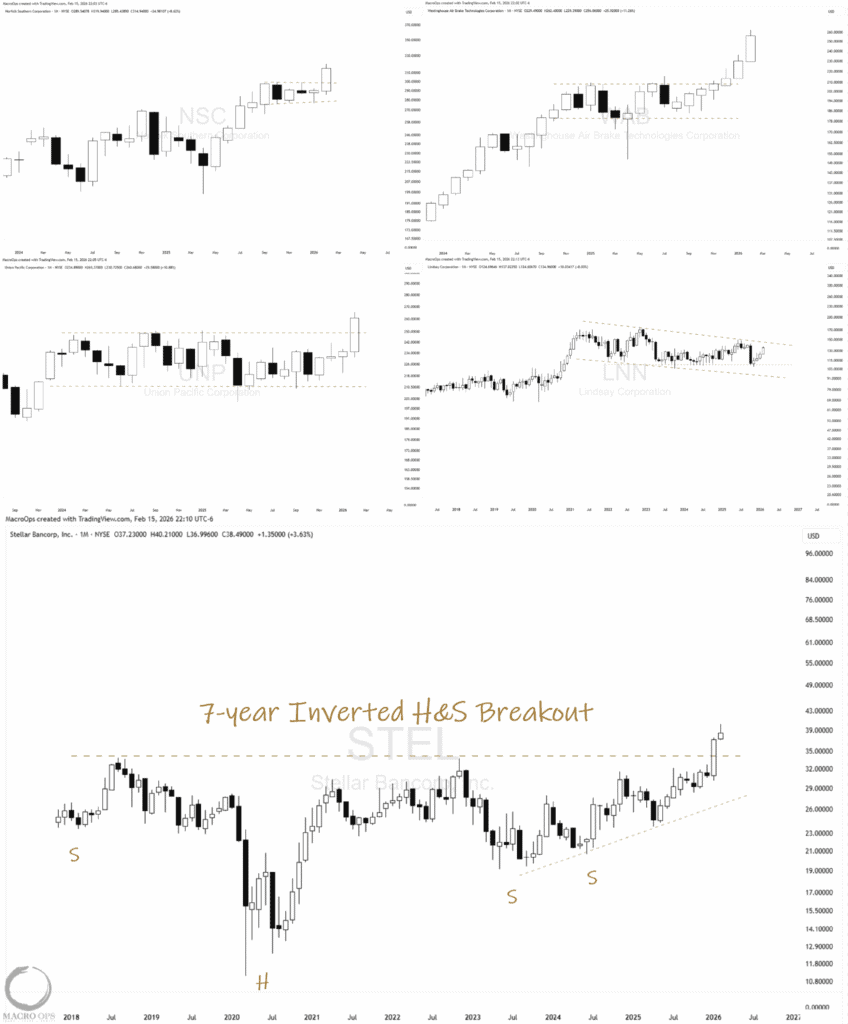
11. I pulled up a list of rail and rail-adjacent stocks and spent some time going through the charts. Below are my five favorites—NSC, UNP, LNN, WAB, and STEL—shown on monthly timeframes. There are some great-looking setups in this space.
For other classical chart patterns we’re tracking this week, give our Lead Technical Analyst Mike G’s latest a read here.
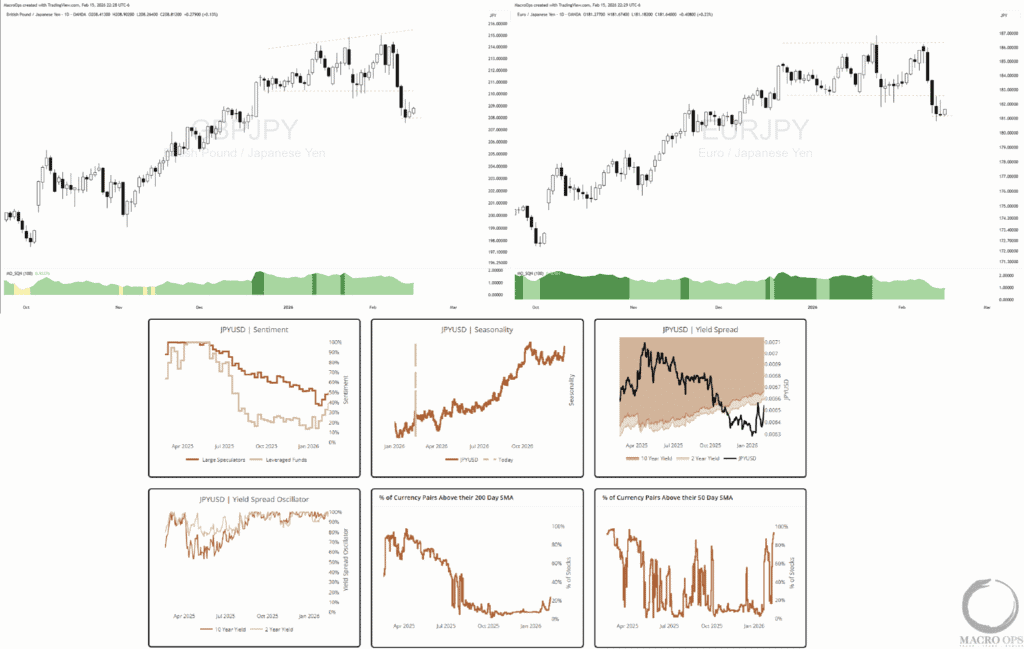
12. I believe the bottom is in for the Japanese Yen (JPY). Our multi-charts show JPY breadth (the percentage of pairs above the 200-day moving average) recovering after an extended period at the floor, while short-term breadth is signaling a bullish thrust.
Additionally, yield spread momentum is in the 90th percentile, and both the FRBNY and Japan’s Ministry of Finance are signaling an increased readiness to intervene. We are looking to short GBPJPY or EURJPY (effectively going long JPY), as both pairs have broken down from significant topping patterns.
Join The Collective
Thanks for reading.