Quality of earnings matters. As such, it’s critical to know what makes certain earnings “high” quality and others poor.
There’s arguably no better book on this topic than Thornton L. O’Glove’s Quality of Earnings book.
Penned in 1987, O’Glove offers evergreen principles on earnings quality through a combination of accounting, business analysis, and common sense.
I’ll examine the most critical aspects of my favorite chapters in this review. I’ll also highlight O’Glove’s company-specific examples and provide more current real-world applications.
I highly recommend reading the book and hope this review whets your palate some.
So raise a glass… To quality!
Quality of Earnings Chapter Summary & Review
Information is Power Review (Chapters 3 & 4)
Annual reports are valuable but highly malleable documents of information. They’re malleable because we hear what we want to hear when we read them.
If we’re bullish on a company, we’ll underline every positive and discard the negative. It’s our bias.
O’Glove knew this in 1984 when he wrote:
“A 1984 survey came up with the unsurprising findings that 73 percent of individual investors agreed that the [annual] reports either play down bad news or hide it in the back of the statement, 58% thought them too promotional … and 27% said it was sometimes difficult to tell from the reports what business the company was in.”
O’Glove begins his analysis of the annual report with the cover. He asks questions like:
- How does it look?
- What image is depicted on the cover?
After the cover, investors usually encounter the “Financial Highlights” section. O’Glove suggests skipping it, saying, “It’s as though your doctor tried to discover the state of your health by a quick glance and perhaps a chest thump or two.”
There are other quirks investors can glean when browsing Annual Reports. For instance, does a CEO use loads of charts and graphs when numbers are up? What about when figures are down? Do the charts remain?
These slight clues tell you how management wants you to perceive certain information and if they wish to hide things from you.
Reading 10Ks all day sounds like an investor’s dream (and time well spent). But it depends. O’Glove cautions investors whose desire is to sit in an office and read all day (emphasis mine):
“One should keep in mind that while many of us derive pleasure from reading annual reports, as investors we should look upon them as sources of information, and not as literary masterpieces or wellsprings for inspirational prose … Unless I come away from a reading with a much improved picture of the company’s true prospects and a feeling as to where its stock might be headed, the exercise must be put down to recreation, not research.”
10Ks are for Research, not Recreation. Kapeesh?
Show Me The (True) Money Review (Chapter 5)
Let’s circle back to quality earnings. Focused research allows an investor to discover a company’s “true” earnings. O’Glove explained “true” earnings through his example of Procter & Gamble’s 1984 Annual Report.
In 1984, P&G earned $5.35/share versus $5.22/share in 1983. However, when you peel back the onion, you notice a different picture.
P&G benefited from two non-fundamental changes to its earnings structure:
- Reduced corporate tax from 44.1% to 37% (~$0.56/share earnings bump)
- $0.18/share special item from swapping stock for debt
Removing the above non-business earnings bumps gets us $4.61/share in 1984 earnings.
In other words, P&G’s core business earnings declined YoY. Quite the difference!
Here’s how we find these one-time adjustments. Check out 3M’s (MMM) income statement below via TIKR.
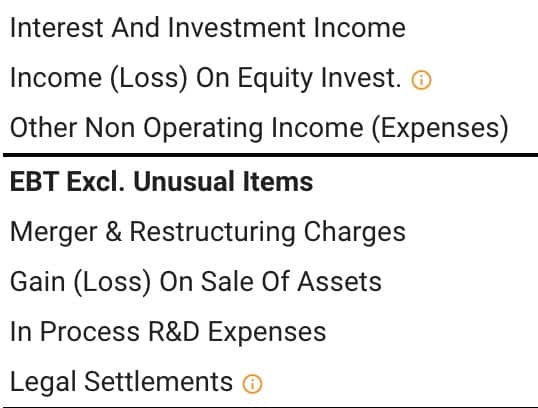
One-time/non-core earnings adjustments transpire below the Operating Income (or EBIT) line.
But remember, every company is different. A serial acquirer may routinely show “one-time” earnings bumps after buying a company, yet is perfectly explainable under their strategy.
Non-core/nonrecurring income is a lot like pornography. You can’t define it, but you know it when you see it.
Some examples of non-core/non-recurring income are:
- Interest income (from investment portfolios)
- Gain/Sale of Assets or Land
- Divestitures of ancillary business lines
- Corporate debt rate reductions
- Income tax credits
This phenomenon also happens on the expenses side of the income statement. Let’s find out how.
Flexing Expenses To Distort Earnings Review(Chapter 6)
O’Glove’s quality of earnings book lists a few ways companies can distort true earnings power through expenses:
- Introduction of a radically different production method that slashes labor costs
- A decline in interest rates enables the company to refinance its debt at a lower rate
- A drop in raw materials prices
- Restructuring at HQ to eliminate staff positions
- Lower distribution charges
- Lower tax rate
Let’s examine IBM’s 1983-1984 to see the power of non-core expense changes.
IBM grew earnings by 19% between 1983 and 1984 from $9.04/share to $10.77/share.
However, O’Glove noted five non-operational expense changes that positively impacted IBM’s earnings growth. In essence, these changes made IBM’s earnings appear better than reality.
During the year, IBM experienced a host of non-core changes, including:
- Reduced corporate income tax
- Higher assumed return rate on pension plan
- A more liberal depreciation method on rental equipment & other PPE.
- Strong dollar against foreign currencies
- Cost-cutting program
After adjusting for the five non-core expense changes, we’re left with IBM’s actual earnings of $10.08/share, only an 11% increase from the prior year.
Moreover, given IBM’s revenue growth, the adjusted earnings revealed a declining operating profit margin.
Let’s use another example from the book to see how one-time expenses can create negative earnings distortions.
Campbell’s Soup (CPB) advertised like crazy between 1980 and 1983, with SG&A increasing as a percentage of sales from 8.19% to 11.23%.
In fact, the company doubled advertising expenses YoY during the 9M 1983 ($112M versus $61.3M).
Why does this matter? CPB reported lower-than-normal earnings during those three years. However, normalizing advertising spending revealed a different reality. Here’s O’Glove (emphasis mine):
“Using the same methods as with IBM, I calculated that the higher marketing and sales expenses were equal to $0.62/share net of taxes. In other words, without the increase in marketing expenses CPB’s earnings for the 9M period in 1983 would have been $4.60, or a 24.3% advance, more than three times as great [as originally reported].”
We use these tools to study early-stage growth companies that plow nearly every dollar earned to grow their competitive advantage. Moreover, these tools allow you to underwrite a “normalized” business model and infer what true earnings could become in the future.
It’s All About The Ratios Review (Chapter 8)
Chapter 8 is one of my favorite chapters of the quality of earnings book. O’Glove pens a crash course on two of the most vital ratios in business:
- Accounts Receivables
- Inventories
O’Glove doesn’t mince words on his affinity for the above ratios (emphasis mine):
“The best method I have ever discovered to predict future downwards earnings revisions by analysts is a careful analysis of accounts receivable and inventories.”
Let’s start with Accounts Receivable.
Accounts Receivables
Accounts Receivable (A/R) is money owed to a company for goods or services provided to customers without receipt of payment.
In short, you delivered the goods to the customer, and they haven’t paid you yet. This is normal in business.
However, the goal is to turn those receivables into cold hard cash. Because this is money we’re owed, accounts receivables appear on the asset side of the balance sheet.
As O’Glove notes, “major increase in A/R is a danger sign.” There are a couple reasons for concern. Customers take longer to pay the company for goods/services. This strains the company’s cash flow as it must finance operations with cash on hand instead of collected revenues.
There are a couple ways to gauge whether a company’s efficient in collecting receivables from their customers:
- Receivables Turnover (RT): Sales divided by average A/R
- Average Days Sales Outstanding (DSO): Average days sales remain outstanding
You want a high receivables turnover ratio and a low average DSO. High RT means the company spends little time collecting outstanding receivables. Concurrently, a low DSO means customers quickly settle their credit and pay cash.
Then there are Inventories.
Inventories
We can break inventories into three categories:
- Raw materials
- Semi Finished goods
- Finished goods
The most obvious warning sign is increasing finished goods. This means the company can’t sell what is already made and must discount or write off whatever inventory is left.
We can glean two things from increased raw materials. For a company like Toyota (who introduced the world to just-in-time production), rising raw materials is probably a sign of increased customer demand.
However, increased raw materials might also attempt to “time” customer demand for specific products (think furniture/clothing, etc.).
There are a handful of industries particularly vulnerable to inventory risks, including:
- Retail (online and offline)
- Manufacturing
- Technology hardware
- Commodity-based businesses
Let’s review a couple of examples.
A/R Example: Commodore International (CBU)
O’Glove illustrates these ratios through the saga of Commodore International (CBU), a microcomputer manufacturer. It’s a tale of two quarters.
CBU increased sales by 102.6% YoY in Q1 1983 while simultaneously growing its A/R by only 5.5%. In other words, CBU only collected 5.5% less in revenue than the prior year despite increasing by over 100%. That’s some intense consumer demand.
Next year wasn’t as promising.
In Q1 1984, CBU’s revenues increased by 17%, while its A/R increased by 34.1%. That’s the opposite of last year. Here are O’Glove’s thoughts (emphasis mine):
“This is a clear sign that CBU’s retailers were moving out its products at a slower than usual pace, while the company was shoveling out its old products in what looked like an attempt to dump them on the market in advance of new introductions.”
In layman’s speak, while CBU had no trouble selling its products to its middle-men (retailers), retailers couldn’t sell them to the end customers. Ouch!
Inventories Example: TIE/Communications
TIE/Communications is a great example of how sales don’t show everything. Consider the following three-year sales growth period:
- 1982: +31%
- 1983: +88.9%
- 1984: +54.6%
Not bad, right?
Now here’s inventory growth for the same periods:
- +13.3%
- +157.2%
- +91.9%
Inventories grew faster than sales, a major red flag in O’Glove’s book. Why? Inventories act as a headwind for profitability when they outpace sales growth. TIE/Communications would have trouble meeting/exceeding profitability expectations.
Saving The Best For Last: Debt & Cash Flow Analysis Review (Chapter 9)
The last chapter in our book review covers debt and cash flow analysis. As O’Glove mentions, “Debt and cash flow analysis are useful tools in assessing the ability of a company to not only service debt, but also to grow and flourish.”
There are three ratios investors should know when analyzing debt:
- Long-Term Debt To Equity Ratio: (LT Debt/Equity)
- Total Debt to Equity Ratio: (Debt/Equity)
- Times Interest Earned Ratio: (EBIT/Annual Interest Payments)
While most investors focus on LT Debt/Equity Ratios, O’Glove suggests starting with the income statement and interest payments (EBIT/Annual Interest Payments).
Here’s his rationale (emphasis added):
“If you do this [start with an income statement view], you will obtain a clearer view of the financial strength of the company.”
If interest payments are a high percentage of EBIT, you have a highly leveraged company. If interest payments are a low percentage of EBIT, the company possesses a strong (yet potentially conservative) balance sheet.
Another way to think about it is, “how many times can I pay my annual interest with EBIT?” The higher the number, the better.
Let’s use CVS as a real-world example of debt analysis. Check out CVS’s Total Debt/Equity, Net Debt/Equity, and EBIT/Interest Expense ratios below.
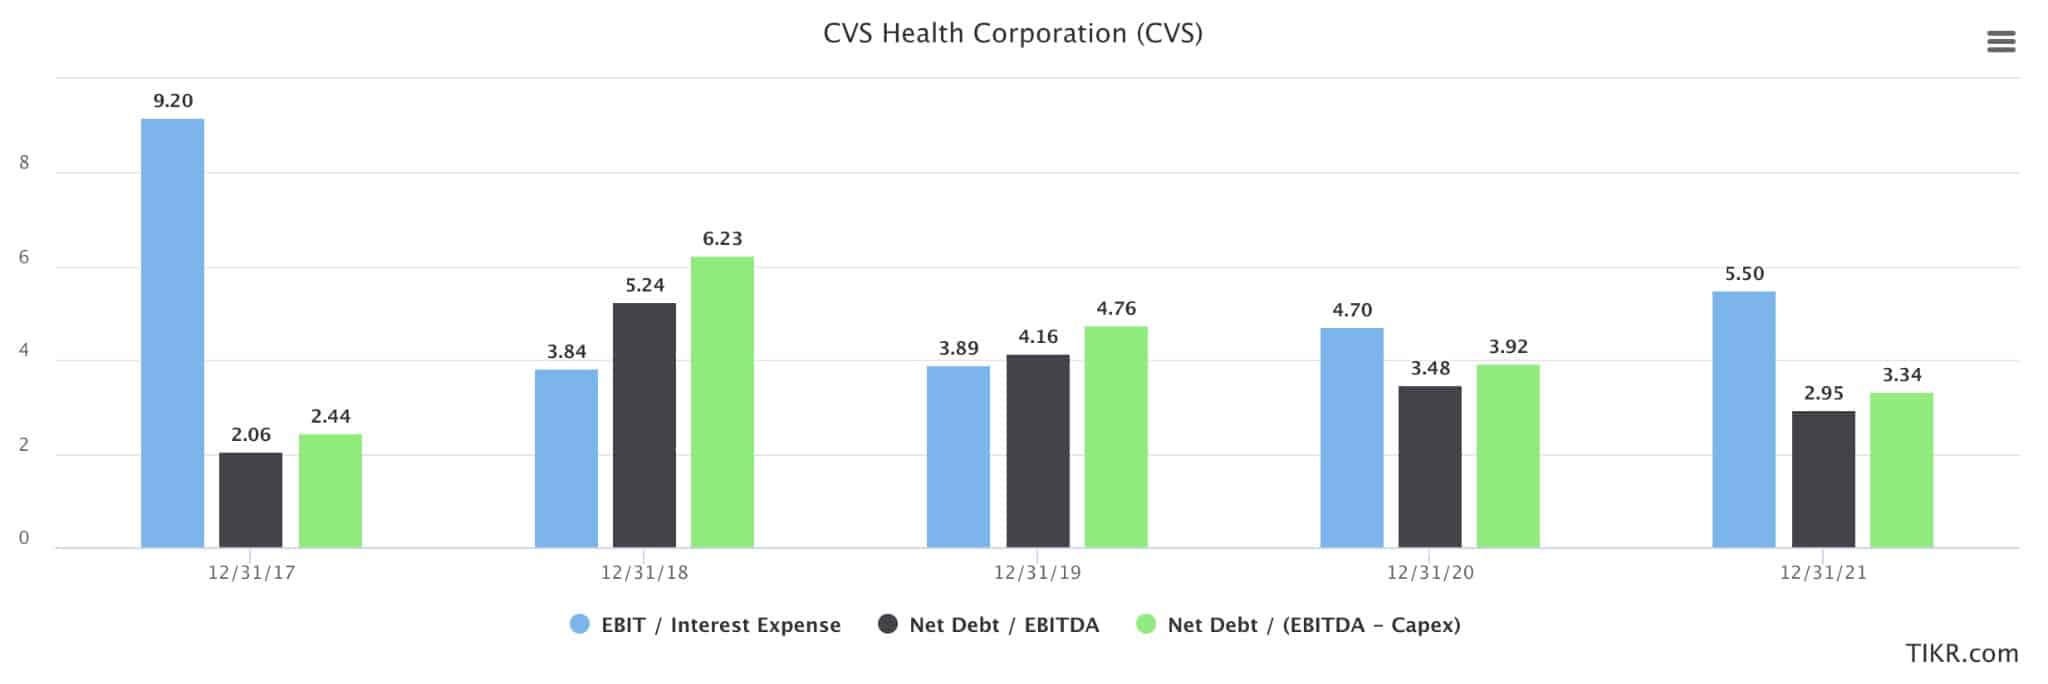
CVS has reduced its debt burden over the last five years. Interest expense as a % of EBIT has declined from ~26% to 18% of EBIT.
We can use this information to identify distressed companies (or ones entering distress). A significant red flag is when interest expense increases as a percentage of EBIT.
Eventually, companies with increasing interest expenses must either issue new (and cheaper) debt or new shares to finance the higher interest payments.
Quality of Earnings Book Summary
O’Glove would’ve killed to have a tool like TIKR instead of performing all those calculations and ratios by hand.
That’s the exciting thing about investing today. It’s never been easier to become a fantastic earnings analyst.
There are zero excuses to miss the difference between “true” and “fake” earnings. I hope this book review got you closer to your understanding of how to analyze a company’s earnings.
If you’re still reading this, you should know the following:
- A proper definition of true earnings
- How to normalize non-core/non-recurring income items
- How to normalize non-recurring expense items
- How to analyze a company’s cash flow and debt levels
Got a book you think I should read and review? Drop it in the comments below, or shoot me an email/DM!