Key points:
- Stocks struggle in the first four months of a hiking cycle
- Energy and technology were the strongest sectors during tightening regimes
- Treasury yields rose, the dollar weakened, and commodities rallied
Federal Reserve policy matters for asset classes
The Federal Reserve looks poised to raise its target rate today, at least according to implied 30-Day Fed Funds futures prices. If it does, this would be the first hike since July 2023, which marked the final increase in an 11-hike cycle. A rate-hiking cycle is defined as three consecutive rate increases without an intervening cut. The number of hikes and the pace of a cycle—fast or slow—are only known in hindsight.
Today’s report provides a historical guide to what typically happens during these cycles.
On average, a hiking cycle has included six target-rate increases. Interestingly, YoY CPI has averaged 3.3% at the outset of these cycles, versus 3.4% today, and has strongly tended to rise over the course of a cycle. Meanwhile, the S&P 500’s three-year rate of change is currently above 70%, well above the historical average at the start of rate-hiking cycles and the third-highest level on record, trailing only 1999 and 1987.
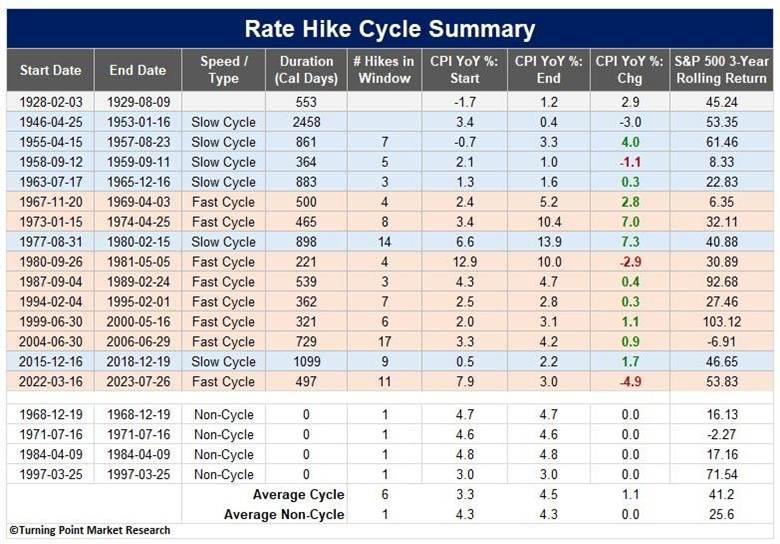
For this analysis, I use the Ned Davis Research definition: fast hiking cycles feature rate increases more frequently than every other Fed meeting, on average. In contrast, slow cycles feature less frequent increases.
A medium-term downward bias in stocks
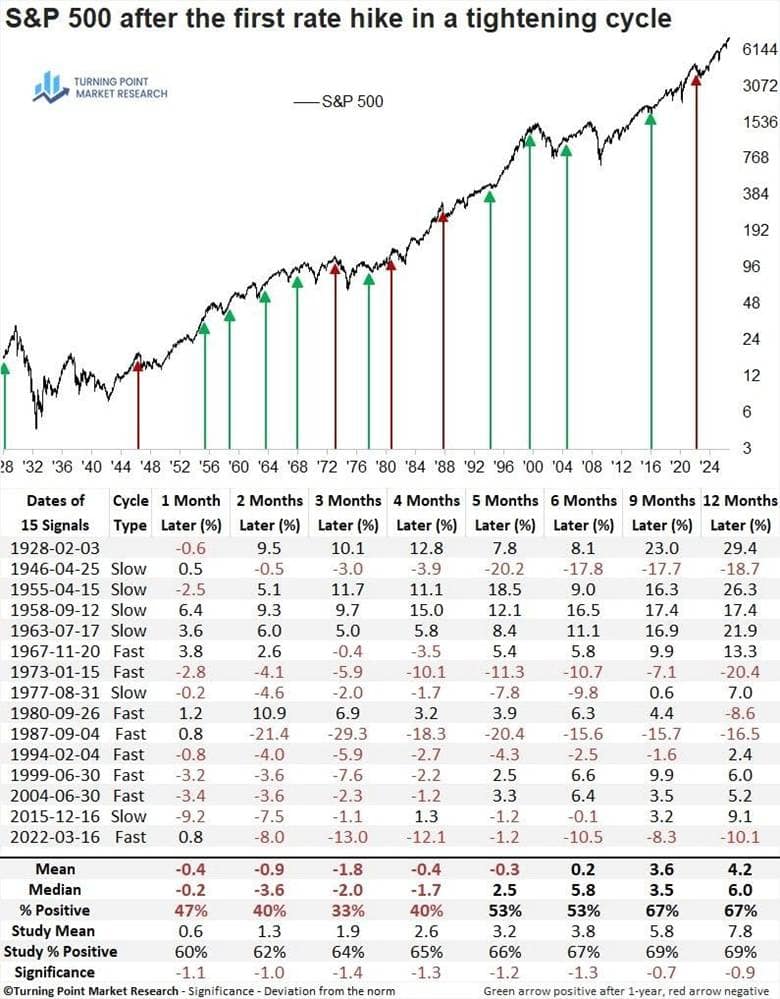
Over the ensuing four months of a rate-hiking cycle, the S&P 500 has tended to pull back. That behavior has become even more pronounced since 1967, with losses in 9 of 10 instances. Rate-hiking cycles have also shifted increasingly toward faster rather than slower cycles since 1967.
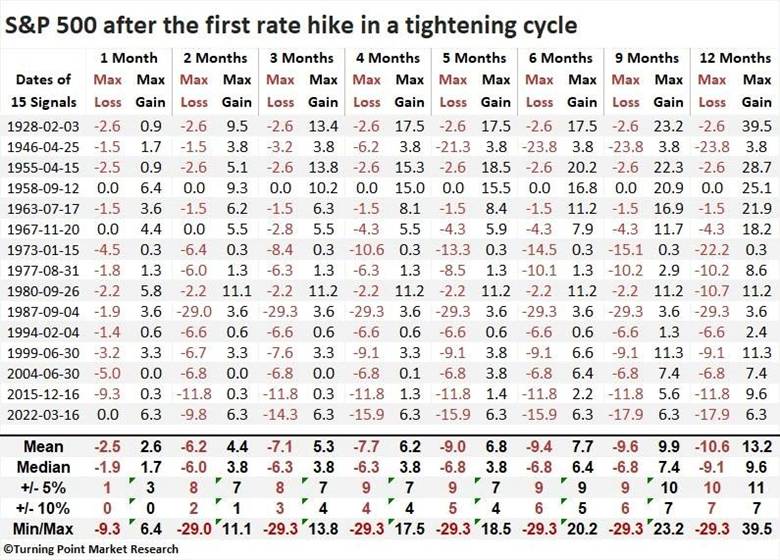
During the first four months of a hiking cycle, losses of at least 5% were more common than gains of 5%, while 10% gains and losses occurred with equal frequency.
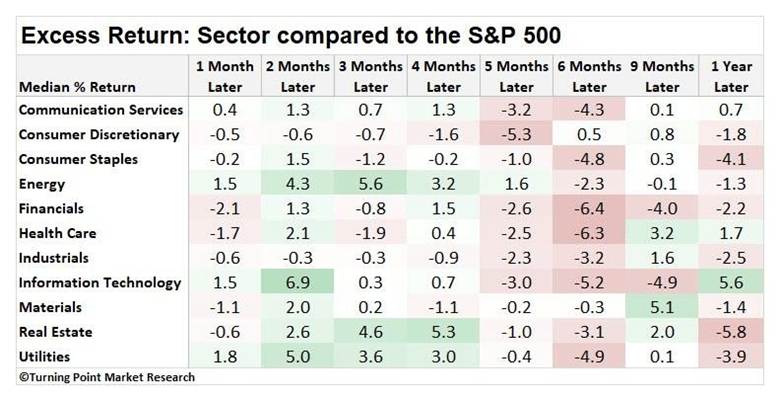
Energy and Utilities were the only two sectors to post gains in each of the four intervals during the first four months. A year later, Technology was the strongest-performing sector.
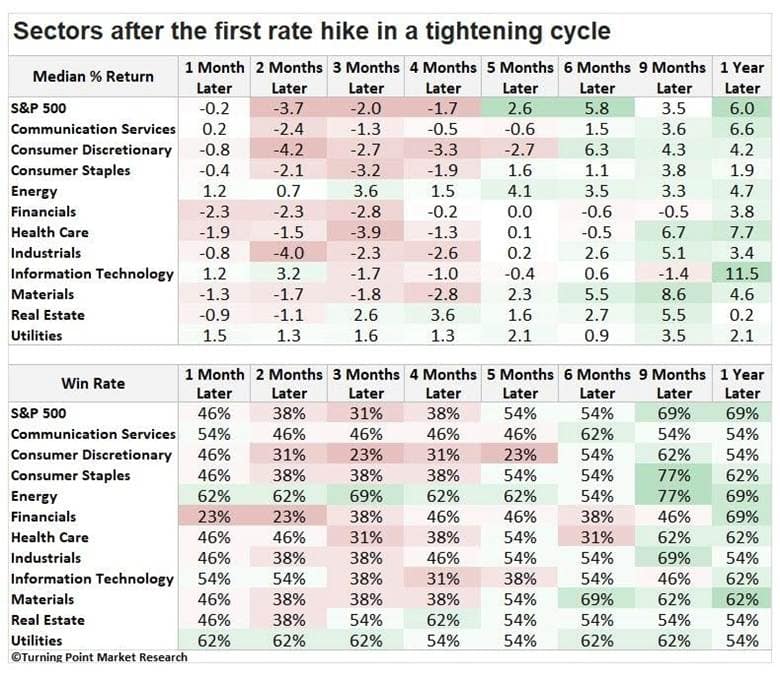
Energy, utilities, and real estate consistently outperformed the broader market, posting positive excess returns across the one- to four-month period. Consumer discretionary and industrials, by contrast, generated negative excess returns.
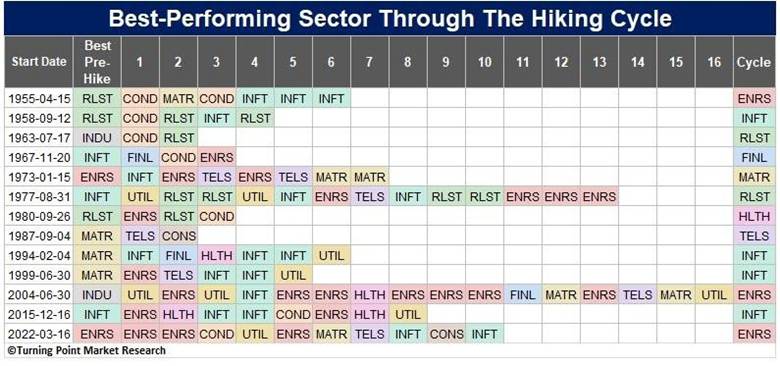
The table below shows which sector led during the 63 days preceding the first rate hike, each stage of the hiking cycle, and the full cycle. Across 98 rate hikes since 1955, energy led in 26 stages, followed by technology with 24. Industrials ranked last, leading in just two phases.
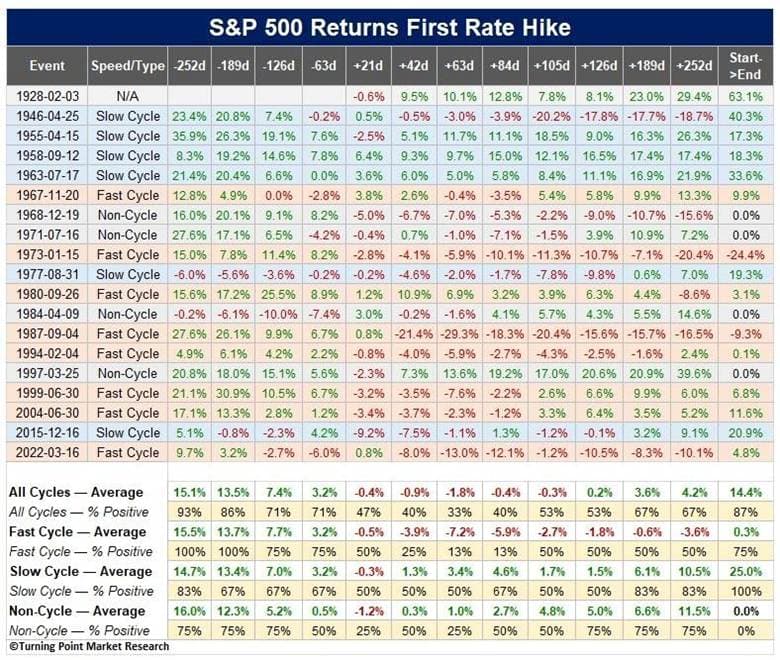
The pace of tightening has mattered historically: fast rate hiking cycles were followed by negative returns over one to 12 months, while slow cycles were positive in all but one period.
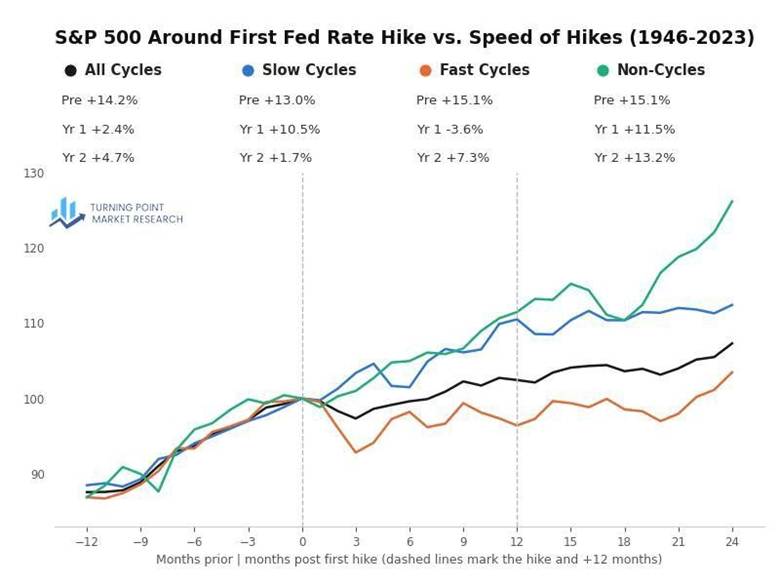
The following chart offers a visual overview of performance across the various cycles.
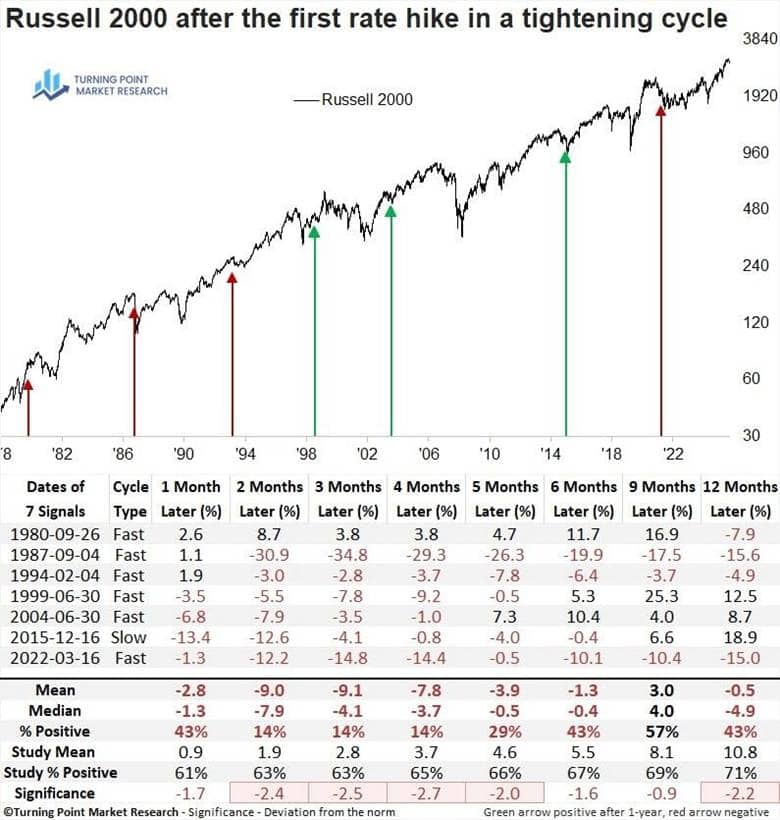
While the sample size is smaller due to data limitations, small-cap stocks showed a pronounced tendency to decline in the first four months.
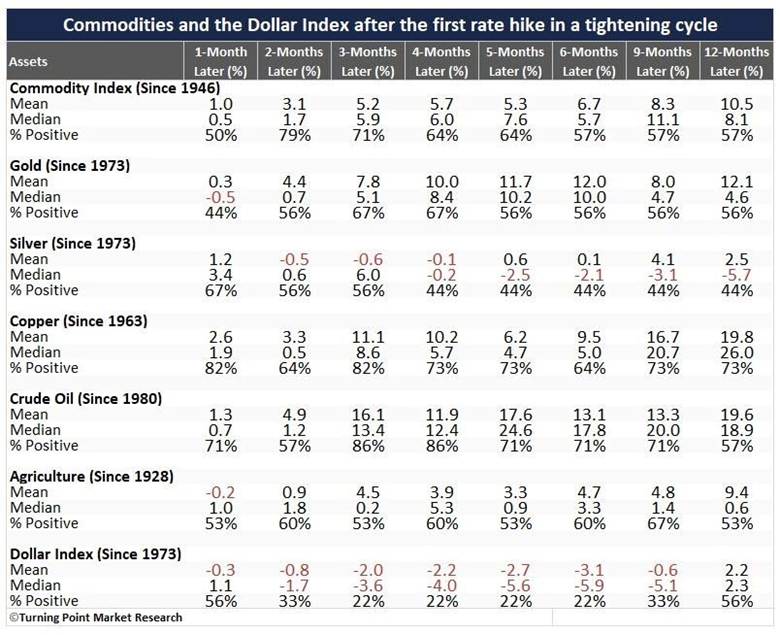
Commodities tended to rally
A broad commodity index, copper, and crude oil exhibited a fairly strong upward bias. Gold also advanced, while silver was weak, potentially reflecting its higher-risk characteristics that investors chose to avoid. Agriculture posted modest gains. Interestingly, the dollar was weak, likely providing a tailwind for the commodity complex.
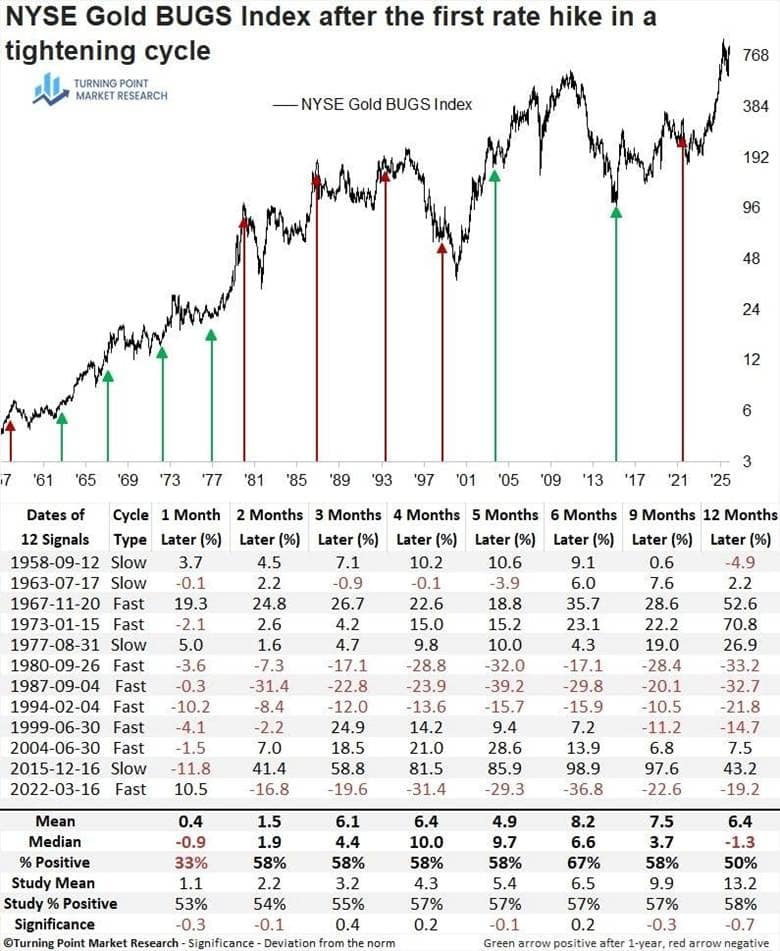
Given gold’s tendency to advance, I thought it was worth looking at gold miners. While miners rallied during the first four months, diverging from the S&P 500’s negative returns, their consistency largely tracked the baseline period. A year later, the results were essentially a coin toss.
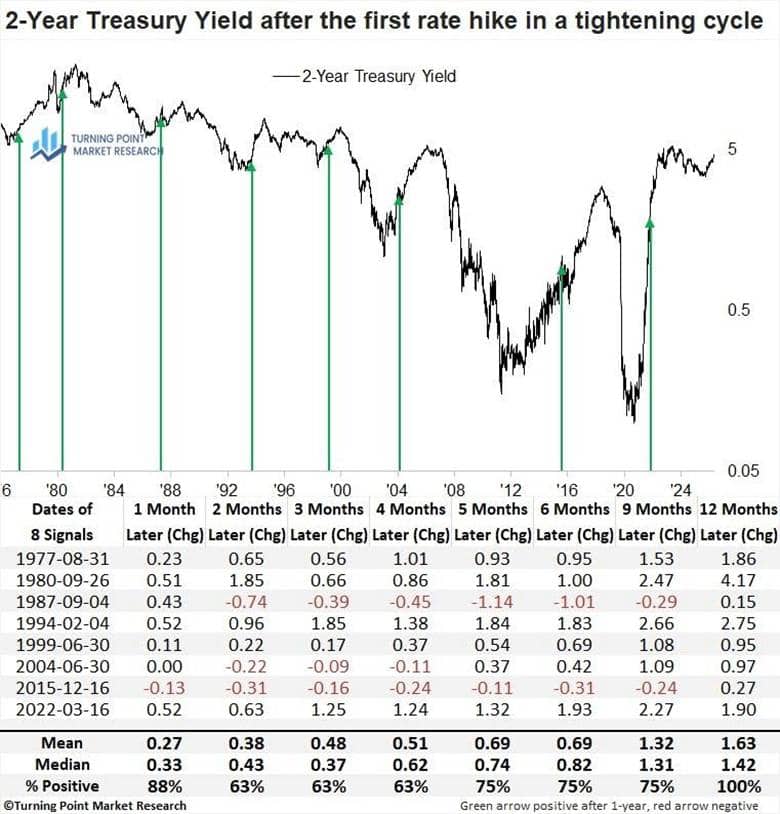
Bond yields tended to rise
Historically, the 2-year Treasury yield has risen 100% of the time over the subsequent year. That is notable today, as the yield—which typically tracks the Fed funds rate—is currently out of alignment, suggesting Fed tightening is warranted.
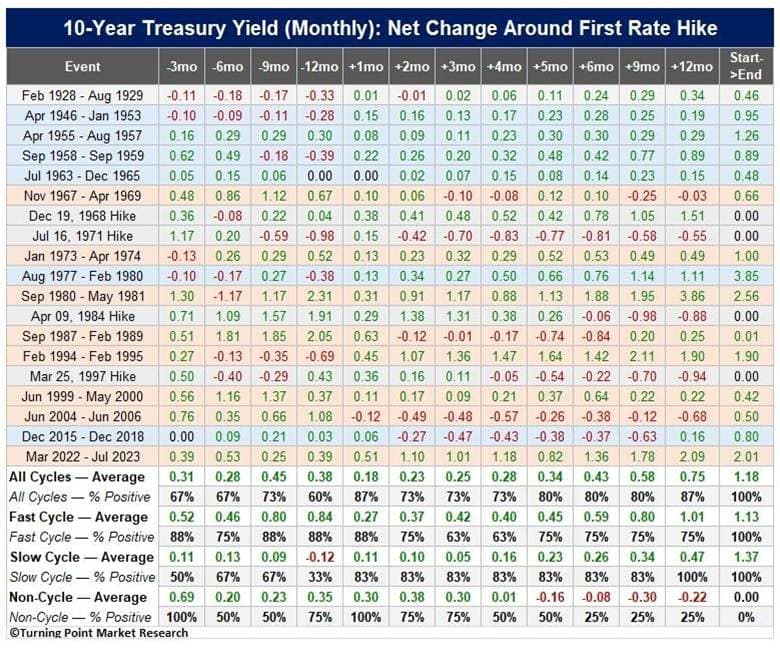
The 10-year Treasury yield rose 82% of the time over the following year.

The use of monthly 10-Year Treasury yield data adds four more cycles to the analysis. Regardless of cycle type, the benchmark yield tended to rise strongly.
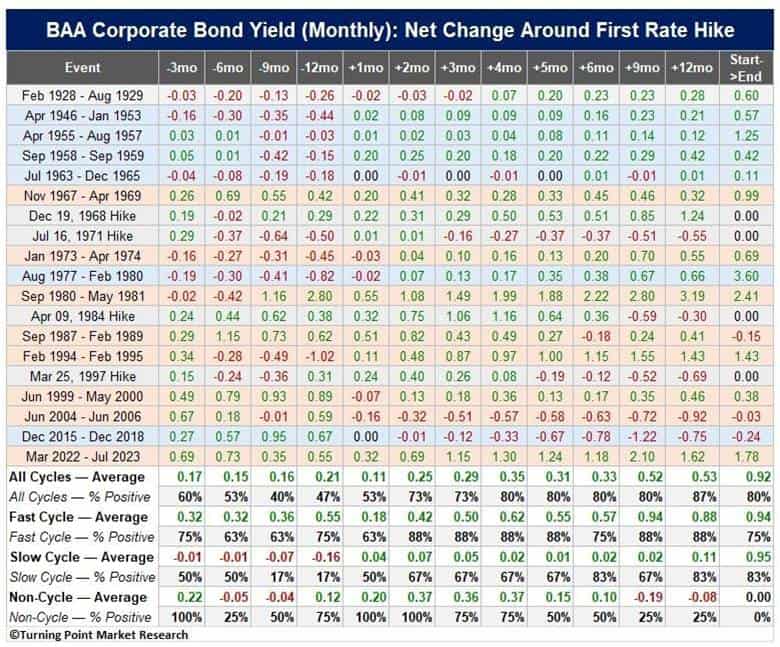
This was also true for BAA corporate bond yields, which rose at least 80% of the time over the following year, regardless of cycle type.
What the research tells us…
The historical behavior following the first rate hike of a tightening cycle is fairly consistent: stocks tended to struggle over the first four months, while energy and technology were among the stronger sectors. Industrials and consumer discretionary, by contrast, tended to lag. Commodities generally moved higher, with copper and crude oil leading. Gold also gained, while silver lagged, and the weaker dollar may have helped support the broader commodity complex. Bond yields tended to rise across maturities. Obviously, we won’t know how many times the Fed ultimately hikes or how quickly it gets there until we look back on the cycle. If I had to make an educated guess today, I would put the current cycle in the slow camp. The economy and inflation aren’t showing signs of overheating, and a resolution to the Iran conflict, along with lower oil prices, could give the Fed some flexibility.