Broad Market Thoughts
Beneath the relatively calm surface of the S&P 500, a stealth correction has been unfolding. The cap-weighted index is down only about 1%, but the equal-weighted S&P 500 has declined more than 5%, revealing a much deeper pullback in the average stock. Small caps are under even greater pressure, with the Russell 2000 ETF down roughly 8%, while interest-rate-sensitive utilities have plunged more than 17%.
Yields are the obvious culprit, with the 10-year Treasury jumping a staggering 15 basis points on Wednesday. What started as a selloff concentrated in rate-sensitive groups is now spreading into more areas of the market, and that deterioration is showing up in an expanding number of 52-week lows.
In fact, it was enough to trigger a 52-week low spike signal for S&P 500 stocks, a component of the TCTM Risk-Off Composite.
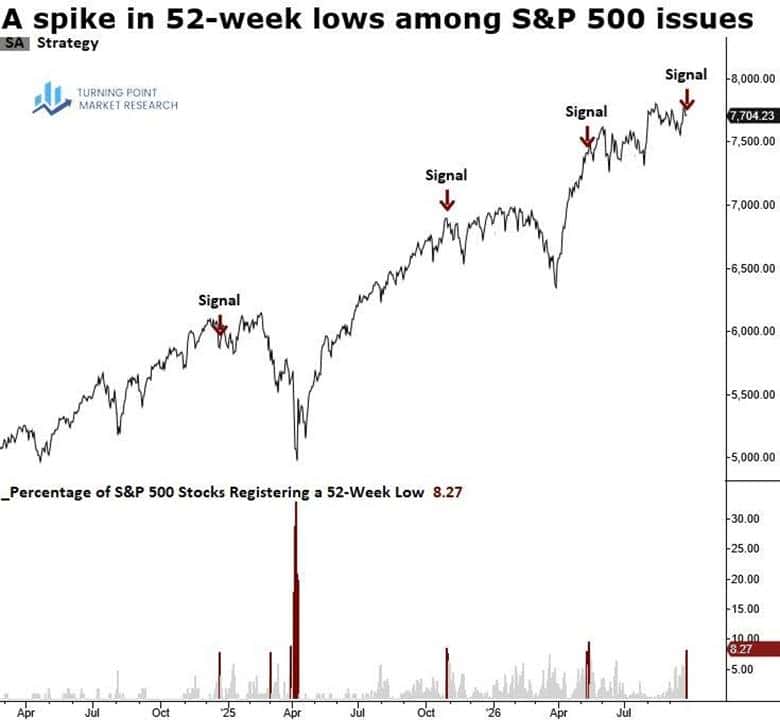
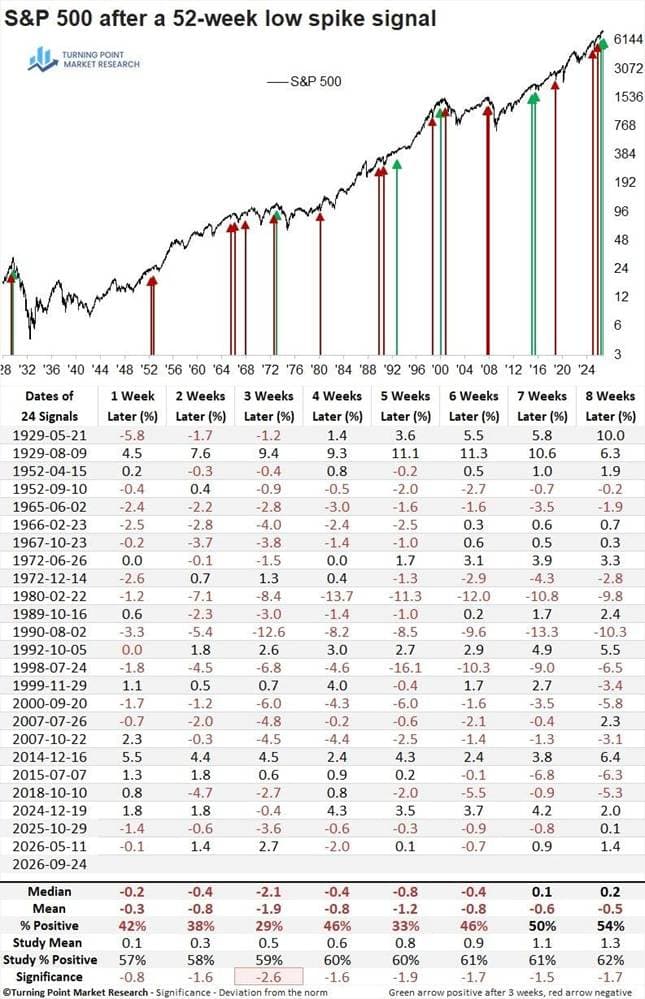
When 52-week lows for S&P 500 constituents exceed 8% as the index hovers near a multi-year high, the world’s most benchmarked index has struggled over the subsequent eight weeks. The two previous signals, October 2025 and May 2026, preceded shallow pullbacks marked by selling in growth groups and rotation into value and defensive stocks.
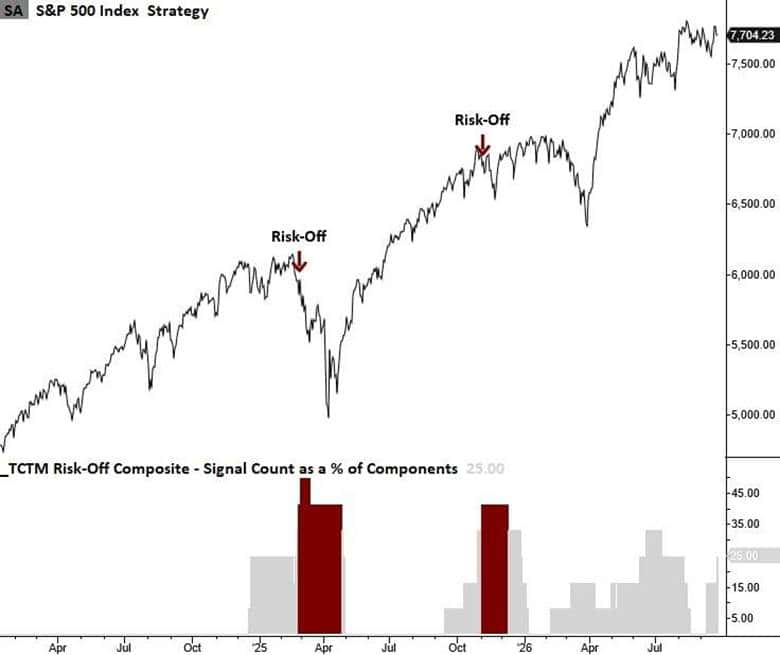
With the new component signal, the TCTM Risk-Off Composite increased to 25%, leaving it two alerts short of a broad model warning.
Across indexes, sectors, and exchanges, 52-week lows have been ticking higher. The NYSE, which triggered a warning a few weeks ago, has continued to deteriorate, with new lows expanding to 15% on Thursday. This is also true for high-yield bonds, which saw 52-week lows reach 24%, the highest level since the Liberation Day low.
The encouraging takeaway is that financials have yet to see a meaningful increase in new lows. This is notable because financials typically provide an early warning when major market tops are forming.

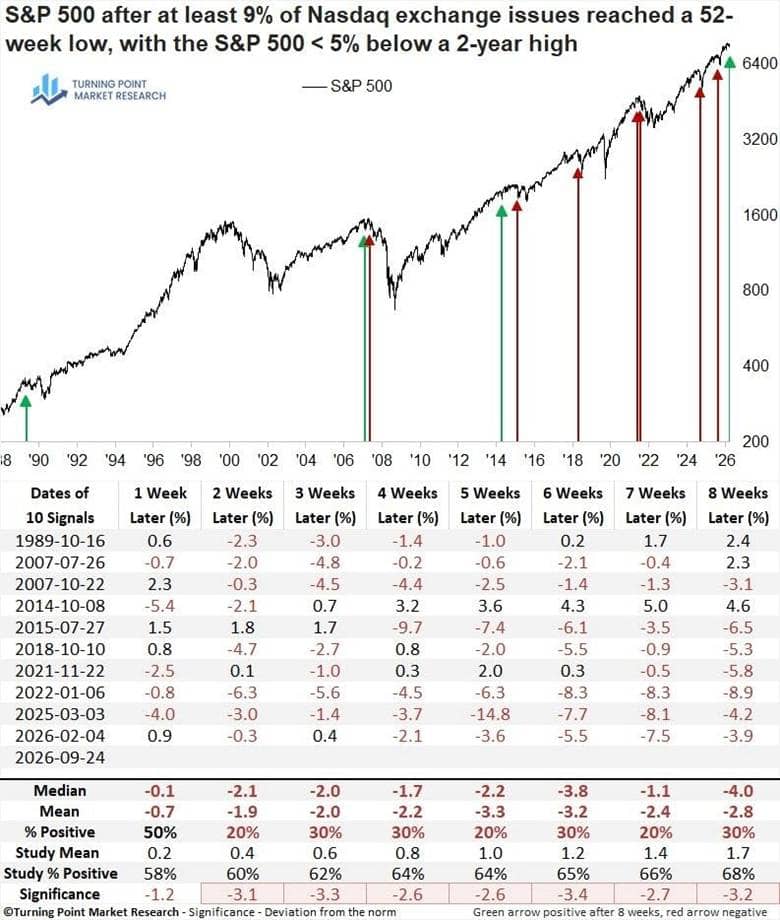
One of the more striking developments in the 52-week low table was the spike in Nasdaq issues, with more than 9% reaching 52-week lows. That is particularly notable given that I highlighted the Nasdaq Composite breaking out to a new record high in Wednesday’s report. The disconnect reminds us that the index is increasingly an imperfect representation of the average stock, as its heavy concentration in the largest companies can mask significant underlying deterioration.
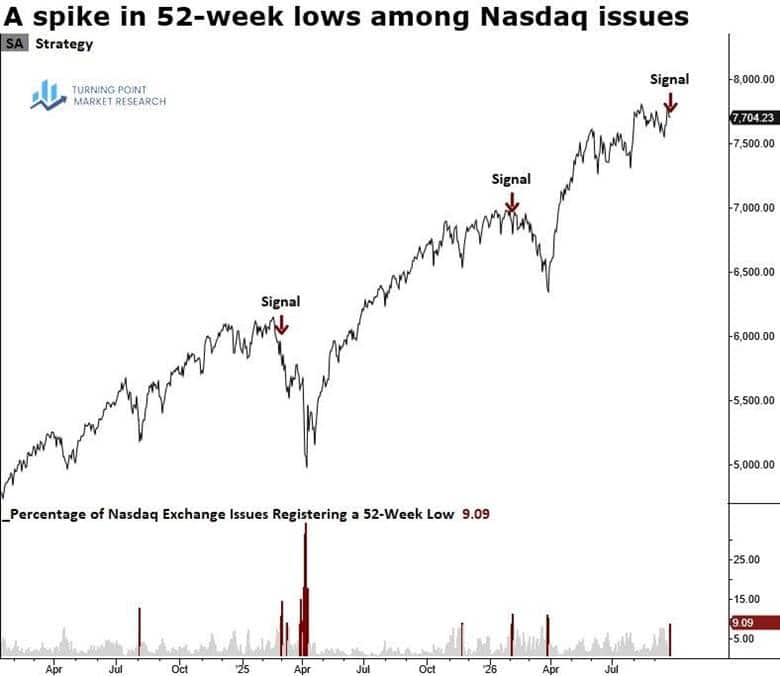
While the sample size is admittedly small, history suggests that when Nasdaq 52-week lows surge near a multi-year high in the S&P 500, the index has produced disappointing returns over the following eight weeks.
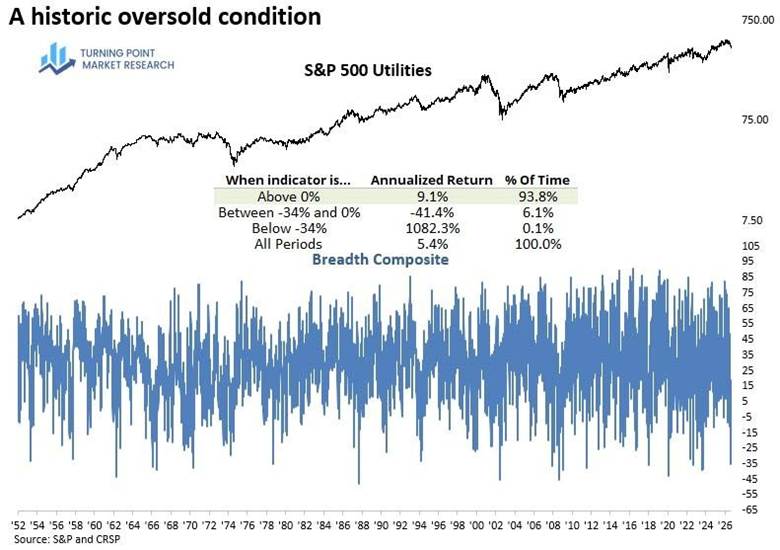
Selling pressure in the rate-sensitive utilities sector has been extraordinary. On Wednesday, the S&P 500 Utilities breadth composite fell below -34%, a reading reached in only 0.1% of cases since 1952. As the chart below illustrates, readings below this level have historically triggered sharp one-day rallies, producing annualized returns of more than 1,000%.
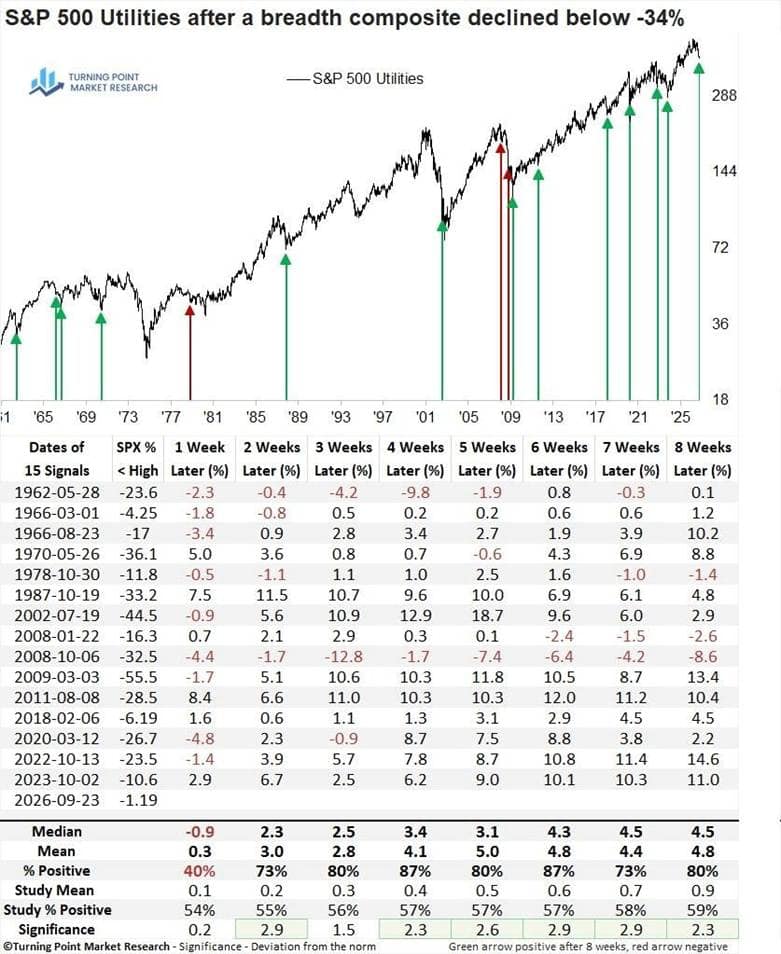
A reading below -34% in the Utilities breadth composite has historically been followed by additional weakness over the next week. Beyond that initial period, however, the picture improves considerably: Utilities were higher four and six weeks later 87% of the time, suggesting a meaningful mean-reversion setup.
Most of these signals occurred amid major S&P 500 drawdowns, so the current environment is clearly different. Still, I expect this extreme reading to eventually produce a mean-reversion opportunity, with a decline in the 10-year Treasury yield likely serving as the catalyst.
Research this week
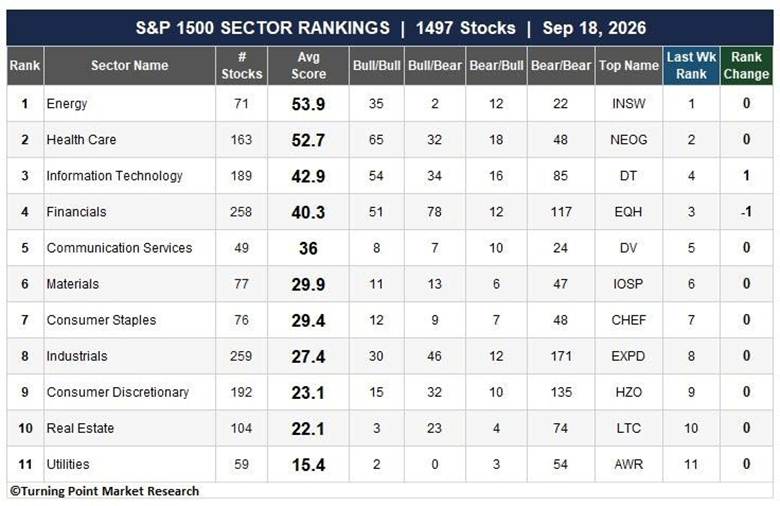
The weekly S&P 1500 rankings report highlighted continued improvement in technology, with the sector moving past financials to claim the No. 3 spot. Within tech, systems software and internet services and infrastructure posted notable gains in the sub-industry rankings.
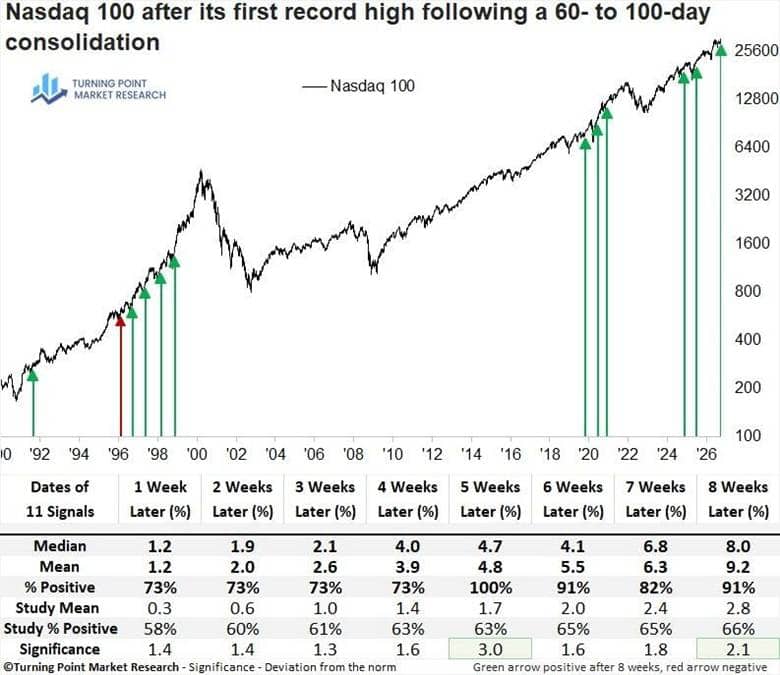
Wednesday’s report highlighted new record highs in both the Nasdaq 100 and Nasdaq Composite following medium-term consolidations. While these breakouts have historically been very bullish, previous instances occurred under dovish Federal Reserve policy regimes, whereas the latest breakout comes amid a tightening bias. Given this backdrop, tempered expectations seem prudent.
Dual-Trend analysis
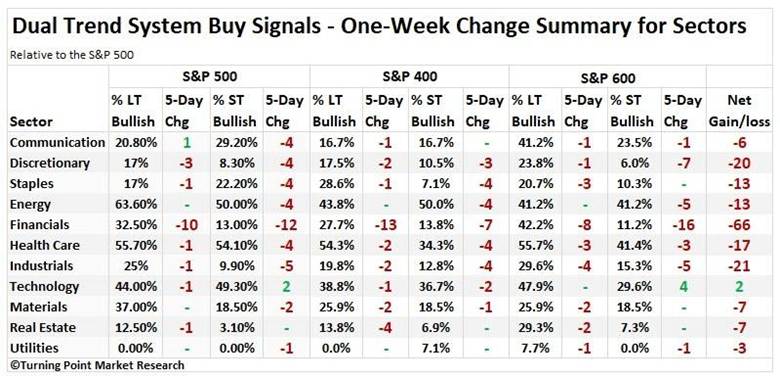
Dual Trend signals continue the trend of recent weeks, with most sectors experiencing net losses, while technology remains the notable exception this week.
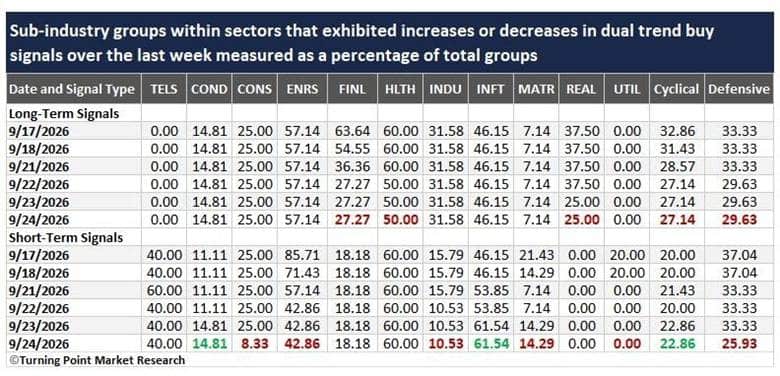
The deterioration in financials was also evident at the sub-industry level, where long-term bullish signals plunged from 63% to 27%. Technology stood out on the upside, with short-term bullish signals posting the largest weekly gain, increasing from 46% to 61%.
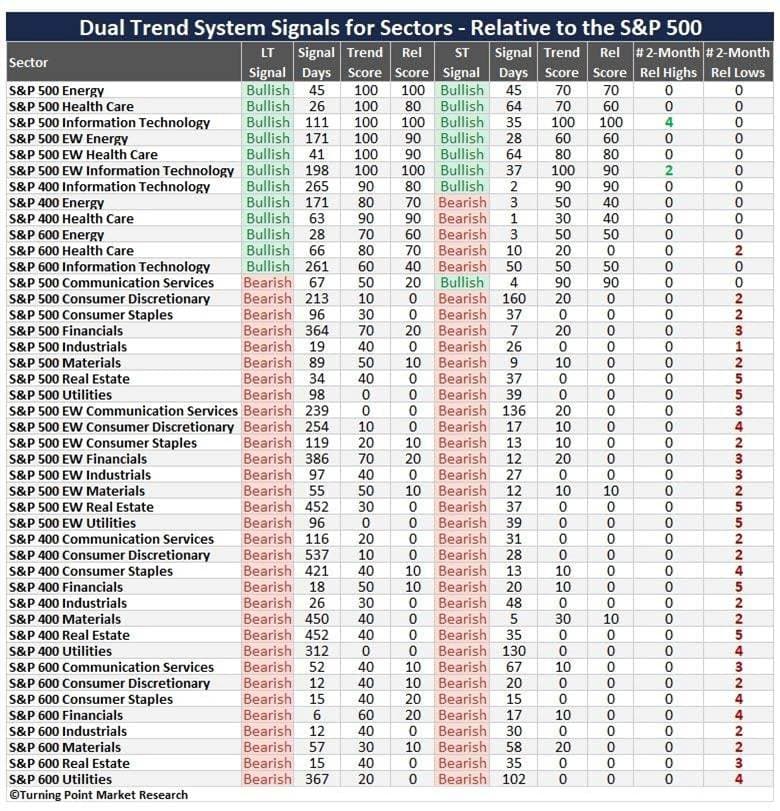
Technology was the only sector to register 2-month relative highs over the past week, standing in sharp contrast to the widespread 2-month relative lows across the other groups, particularly rate-sensitive sectors such as real estate and utilities. Notably, both the S&P 400 and S&P 600 energy sectors shifted to bearish short-term Dual Trend conditions.
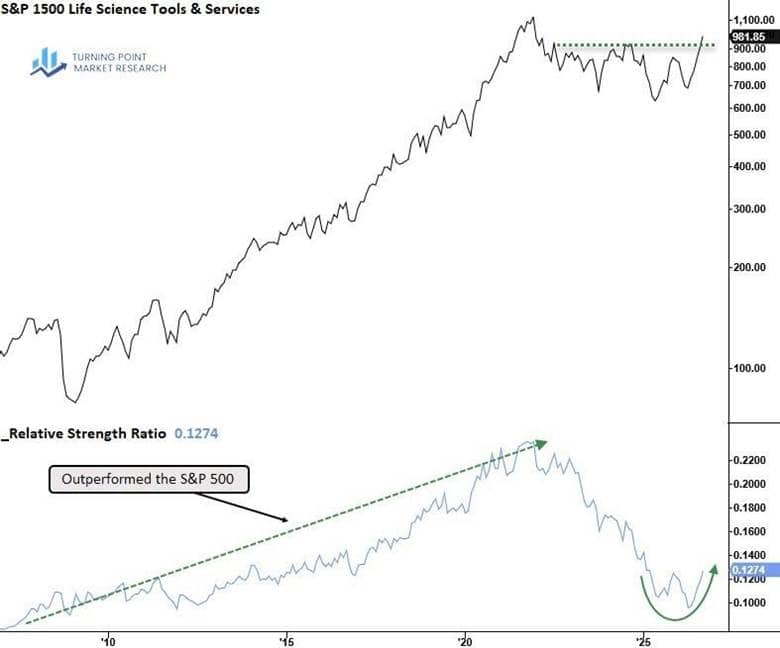
Life Sciences Tools & Services has been a consistent fixture near the top of the S&P 1500 rankings, and several names within the group made meaningful advances this week.
Zooming out to a long-term monthly chart, the group still looks relatively early in its recovery, suggesting the recent strength may be the beginning rather than the end of a larger move.
Portfolio update
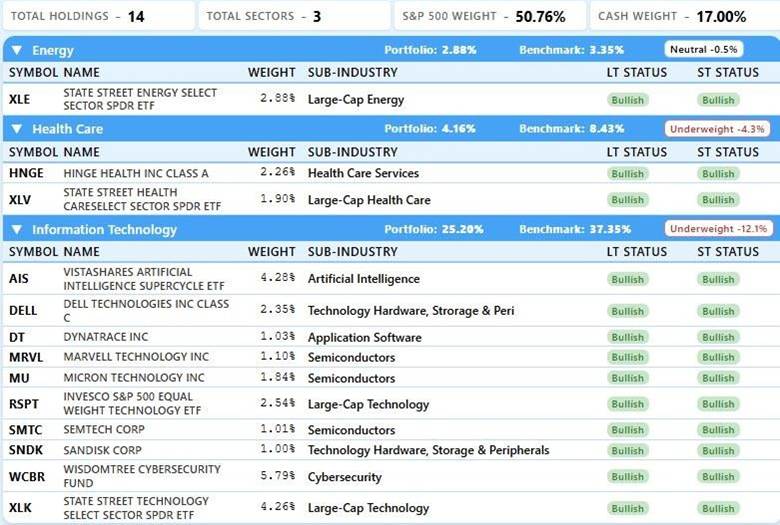
Technology exposure increased substantially in the Dual Trend Portfolio this week, with new positions in the Technology Select Sector SPDR Fund (XLK), Marvell Technology (MRVL), SanDisk (SNDK), VistaShares Artificial Intelligence Supercycle ETF (AIS), and Dynatrace (DT). I sold or trimmed positions in CVR Energy (CVI), Invesco S&P 500 Equal Weight Technology ETF (RSPT), and SPDR S&P Biotech ETF (XBI).
Cash declined from roughly 24% to 17% week over week. With the portfolio now fairly crowded in technology, future additions will likely focus on health care and, in particular, life science tools and services names.
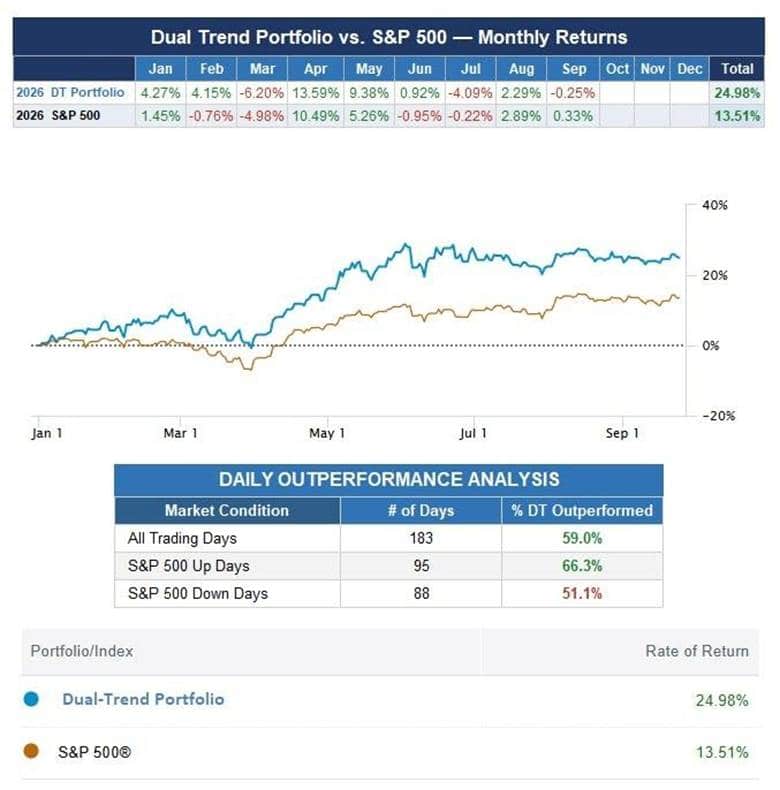
Through Thursday’s close, the Dual-Trend portfolio had gained 24.98%, outperforming the S&P 500’s 13.51% return.
Final thoughts
The overall market backdrop continues to deteriorate, with fewer stocks exhibiting bullish trends or outperforming the S&P 500. At this point, I see two paths forward: Treasury yields retreat, participation broadens, and the average stock helps propel the market into a year-end rally; or yields continue higher, participation narrows further, and eventually the stocks that have held up begin to catch down. For now, I maintain a bullish bias, but if additional TCTM warnings emerge and the short-term Risk-On/Off system turns negative—confirming bearish breadth and trend conditions—additional cash would be warranted to hedge existing portfolio exposure.