Broad Market Thoughts
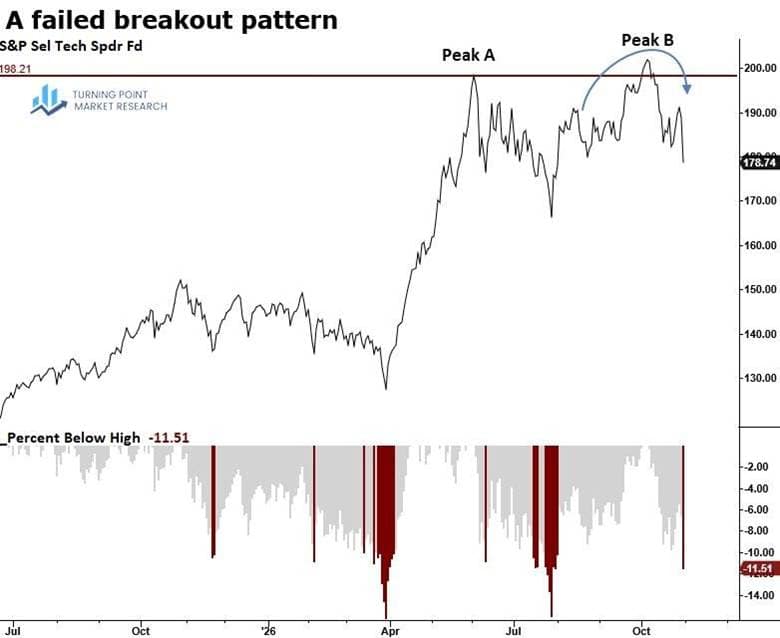
What initially looked like a rebound week for the AI trade has quickly unraveled. Several technology stocks suffered substantial gap-downs today following disappointing earnings, or at least disappointing investor reactions to the results. Selling pressure has pushed the S&P 500 Technology ETF (XLK) 10% below its October 6, 2026, closing high, creating what increasingly resembles a failed breakout or bull trap pattern, as illustrated in the chart below.
There is no universally accepted definition of a failed breakout, so I developed a set of criteria based on the XLK pattern:
- Peak A: An all-time closing high.
- Pause: The next all-time high occurs 60–130 trading sessions later, representing roughly 3–6 months of consolidation. For XLK, this interval was approximately 85 sessions.
- Breakout run: At least two new all-time closing highs occur, with the final high (Peak B) coming within 10 trading sessions of the first.
- Shallow breakout: Peak B closes no more than 3% above Peak A. In XLK’s case, the breakout extended just 1.9% above its June 2 high.
- Failure: The ETF closes at least 10% below Peak B within 30 trading sessions, without establishing another closing high in between.
The danger of bull traps extends beyond the initial decline. Investors who bought in anticipation of another leg higher are left holding losing positions. That creates a potential source of overhead selling pressure as those investors use future rallies to get out, potentially limiting the market’s ability to regain momentum.
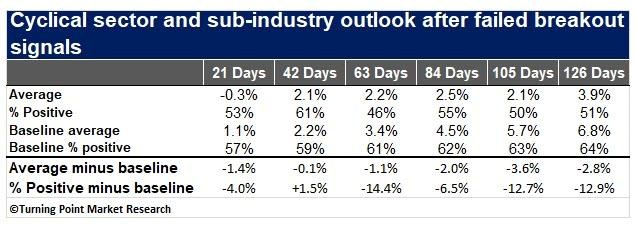
Using the pattern described above, I applied it across all sectors and sub-industry groups dating back to the 1950s, which identified 84 signals. While the results were not overwhelmingly negative, performance consistently lagged baseline returns across every interval. When viewed alongside the late-cycle characteristics highlighted over the past few months, including the TCTM Risk-Off signal, this adds another reason for caution.
Watching for cracks in private credit
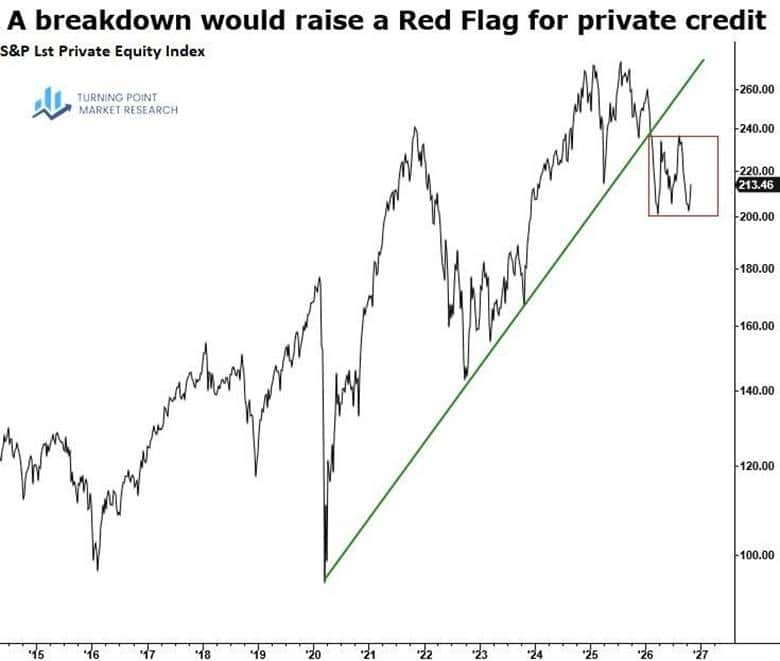
I’m keeping a close eye on the S&P Listed Private Equity Index, which includes publicly traded companies at the epicenter of private credit, an important source of funding for data center development. A decisive breakdown from its current consolidation could serve as an early warning that trouble is brewing beneath the surface.
Research this week
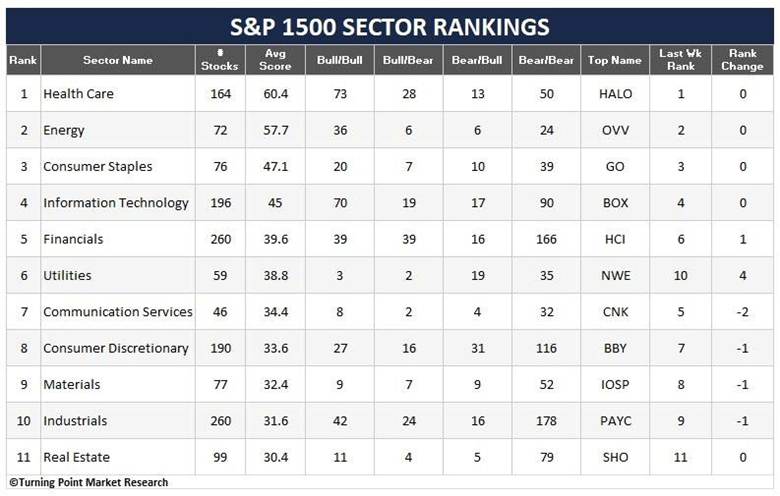
Monday’s S&P 1500 rankings reinforced the market’s defensive character. Health care, energy, and consumer staples held the top three positions for a second straight week, while utilities moved up four spots to sixth place.
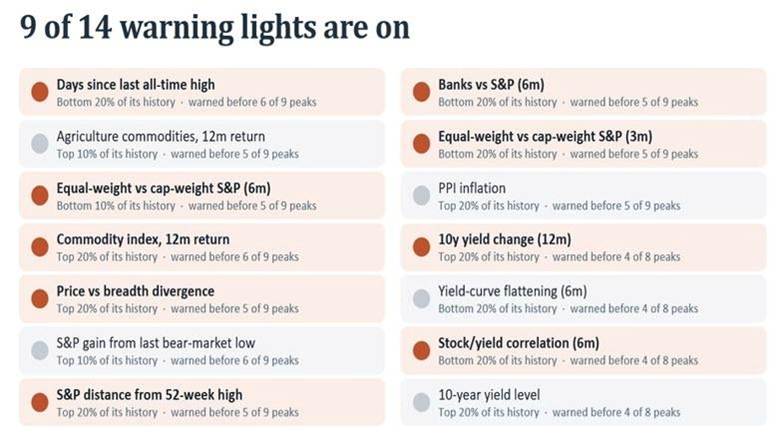
Tuesday’s webinar provided a broad overview of the key indicators and systems I’m watching. One is a late-cycle model that compares current conditions with historical periods to identify environments typically associated with the latter stages of bull market advances. While the model is not perfect and remains a work in progress, 9 of its 14 indicators are currently flashing warning signals.
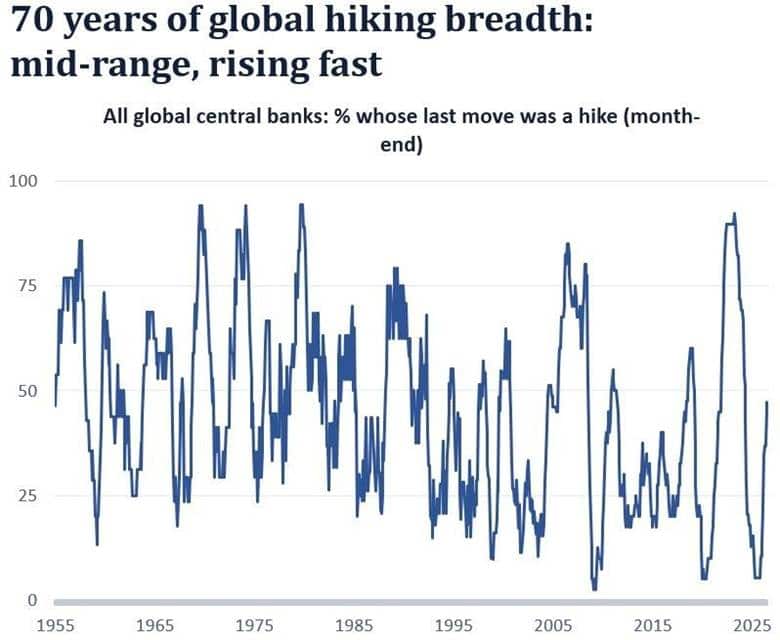
Thursday’s report examined the global tightening cycle, with 47% of central banks having a rate hike as their most recent policy move. History suggests this backdrop is unfavorable for equities, with S&P 500 returns falling below average and deteriorating further when the Federal Reserve also raised rates.
Dual trend analysis
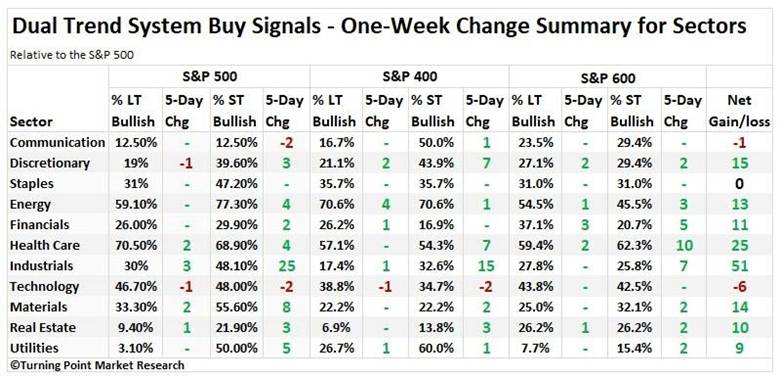
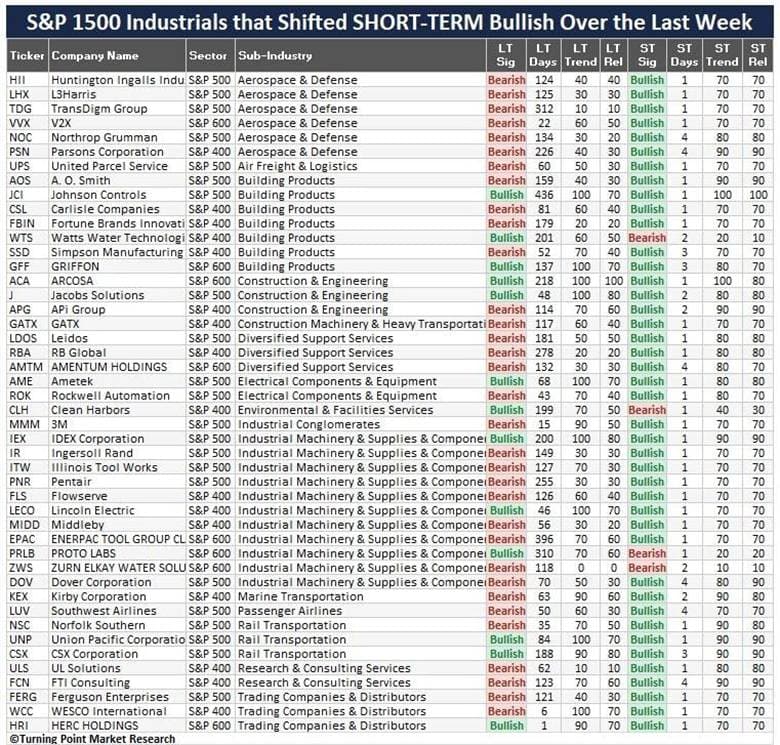
Net gains across Dual Trend signals were positive in every sector except technology and communication services. Industrials led by a wide margin, generating twice the gains of the next-best sector, health care.
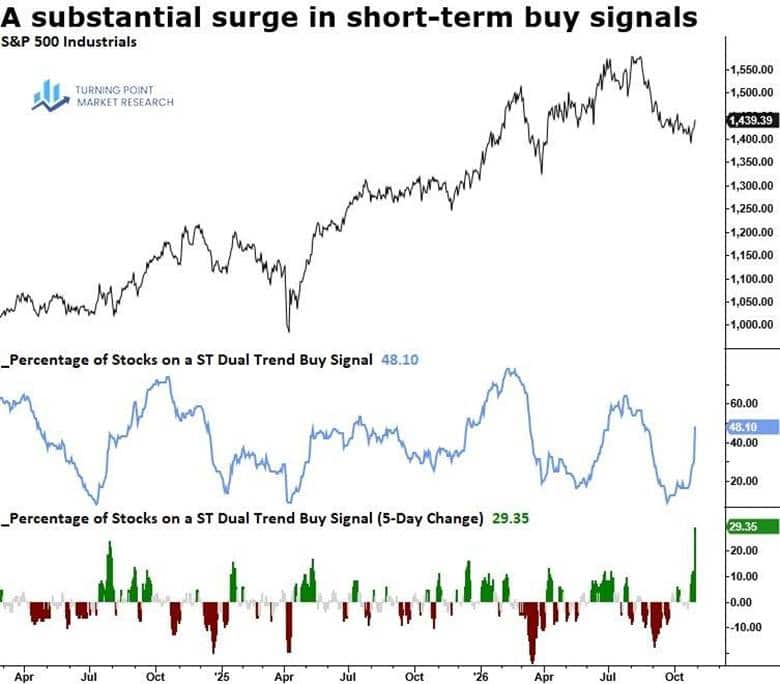
The five-day net change in the percentage of industrial stocks on short-term Dual Trend buy signals surged more than 29%, marking the largest increase since July 2022.
Within industrials, the largest increase in buy signals came from industrial machinery & supplies & components stocks. Notably, most companies on this list have little direct exposure to the data center investment theme. Aerospace and defense stocks are what caught my attention, as the group has given back significant ground since its Iran conflict highs and is beginning to establish a base.
Portfolio update
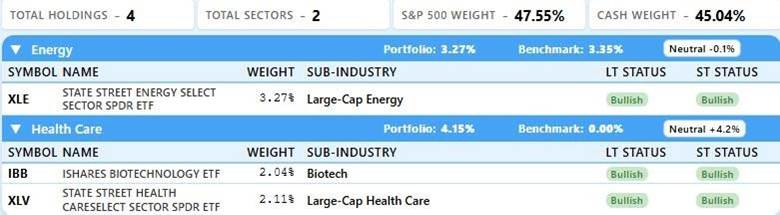
The Dual-Trend portfolio initiated a position in the biotech ETF (IBB) after its short-term Dual Trend signal turned bullish, aligning it with the long-term model. Hinge Health (HNGE), Charles River Laboratories (CRL), and Waters Corporation (WAT) were sold to reduce single-stock exposure and shift capital toward diversified ETFs, which carry less company-specific earnings risk.
Cash increased to 45%, with exposure concentrated in the only two sectors carrying bullish signals across both short- and long-term models.
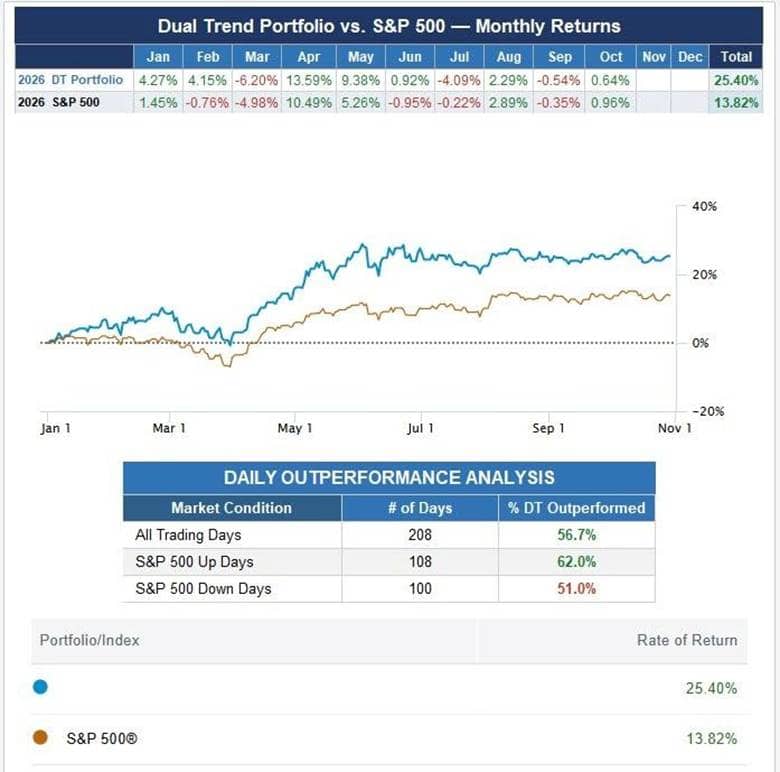
Through Thursday’s close, the Dual-Trend portfolio had gained 25.40%, outperforming the S&P 500’s 13.82% return.
Final thoughts
The weight of the evidence has been shifting from favorable to unfavorable for some time, as warning signs continue to accumulate. Deteriorating breadth came first, followed by concerns in credit markets. Now, earnings disappointments are adding another layer of uncertainty, with several stocks suffering massive gap-downs and potentially trapping investors who bought in anticipation of another rally in the technology sector. After an extraordinary four-year run, and with more late-cycle indicators flashing warnings, it’s becoming increasingly difficult to be excited about stocks at this juncture. Still, a deteriorating market can eventually create attractive opportunities. Should selling pressure produce an oversold condition, investors should be ready to take advantage. Until the evidence improves, however, caution is warranted.