Broad Market Thoughts
It’s been seven trading sessions since the TCTM Risk-Off composite signal triggered. Measured from the October 15, 2026, close, the S&P 500 is down 1.04%, technology has declined 3.12%, and several AI beneficiary sub-industries have fallen 10% to 14%.
It’s difficult to predict the magnitude or duration of any corrective phase, but there’s an important point worth emphasizing about the Risk-Off composite. One reason I developed this model was to add an extra layer of risk control for a momentum-oriented portfolio, beyond simply monitoring the price action of individual holdings. Growth stocks can drop 20% to 30% quickly without necessarily damaging their longer-term trends or relative-strength profiles. The Risk-Off model is designed to help manage that scenario before losses compound across a high-beta portfolio.
For perspective, the Dual Trend (DT) Portfolio is down just 0.5% since the warning. Had the technology exposure remained in place, the damage would almost certainly have been considerably greater.
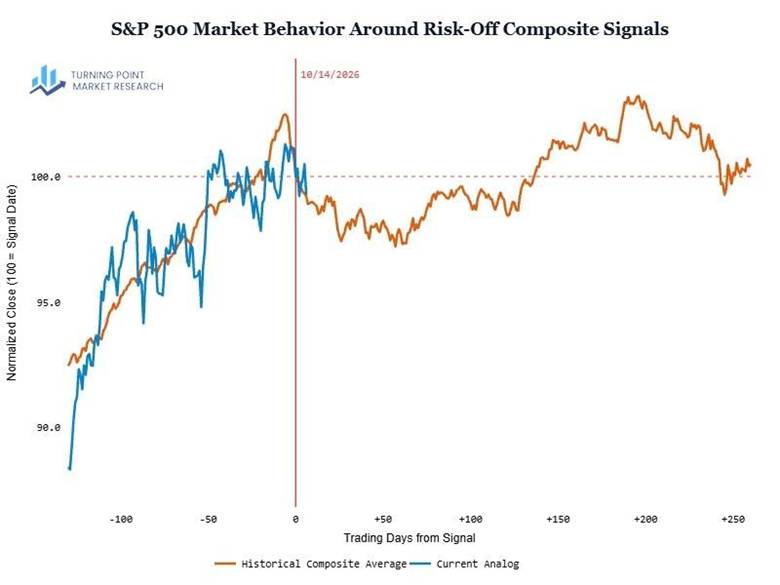
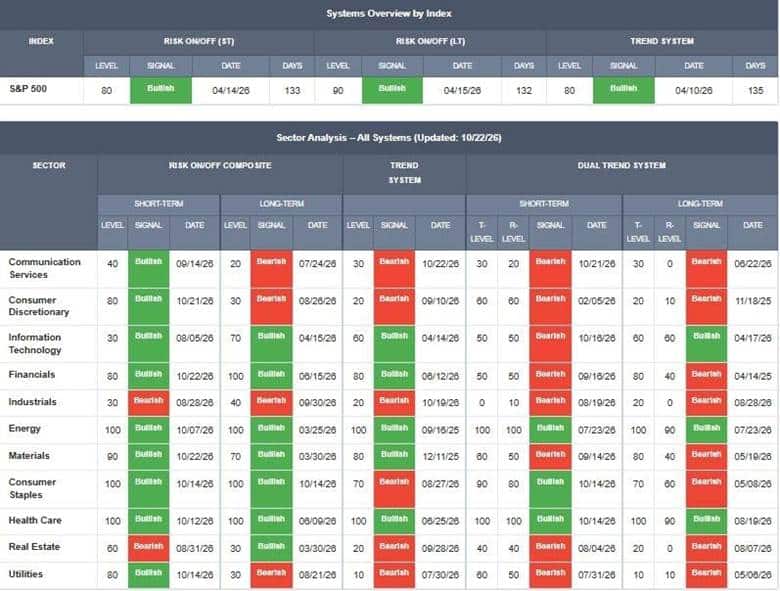
While the TCTM Risk-Off signal remains in effect, short-term price trends and breadth have not deteriorated. Quite the opposite: three sectors saw their short-term Risk-On/Off systems flip bullish this week, bringing the total to nine of 11 sectors, alongside the S&P 500 model. This is unusual behavior. For example, on the seventh trading day following the March 3, 2025, Risk-Off signal, only four sectors remained bullish, and that number fell to two on the eighth day.
The current divergence between the broader Risk-Off warning and improving short-term conditions underscores this market’s rotational nature. This dynamic has persisted for some time and is unlikely to disappear anytime soon.
This is precisely the type of environment that demands flexibility and an open mind. The long-term Risk-Off composite calls for caution, but short-term conditions remain constructive across most sectors. As a result, there is no immediate need to raise additional cash in the DT Portfolio, though that assessment could change as the evidence evolves.
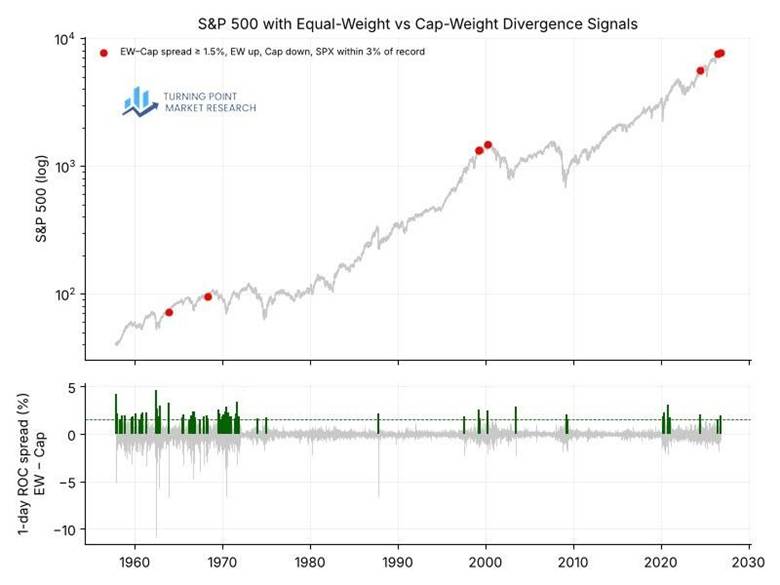
Speaking of the market’s unusual behavior, the two-sided action was on full display again this week. The AI-versus-everything-else trade continues to create distortions not seen since the late 1990s, when technology stocks last accounted for a similar degree of market concentration.
On Thursday, the one-day rate-of-change spread between the equal-weighted S&P 500 and the cap-weighted index reached 1.98%, even as the S&P 500 sat less than 2% below its record high. That combination has occurred only three other times in history. Relaxing the parameters to a 1.5% spread and a market less than 3% below its high adds a few more instances, highlighted by the red dots in the chart below.
Even with the looser criteria, this remains an exceptionally rare occurrence.
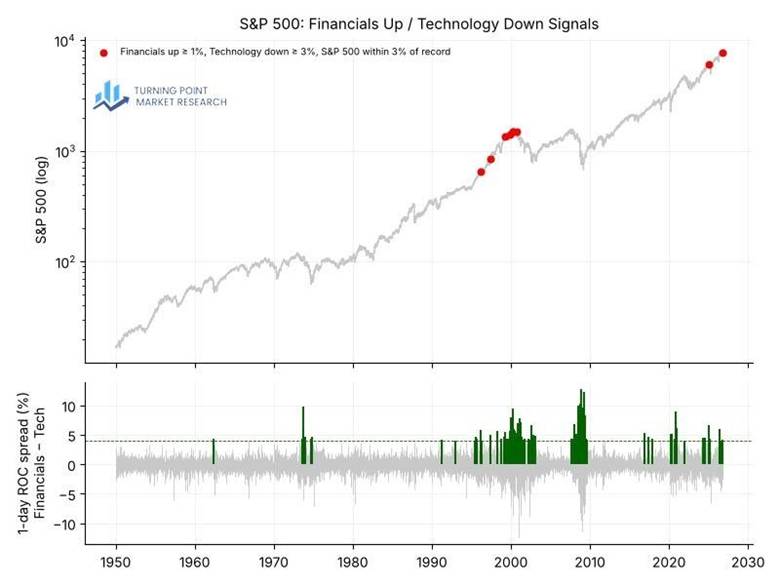
The divergence between financials and technology was also extremely rare on Thursday, with financials gaining 1% while technology fell 3%. Marked by the red dots in the chart below, these instances once again highlight the 1990s, when extreme concentration in technology stocks became a defining feature of the market.
While these charts offer an interesting historical perspective, they offer little actionable insight.
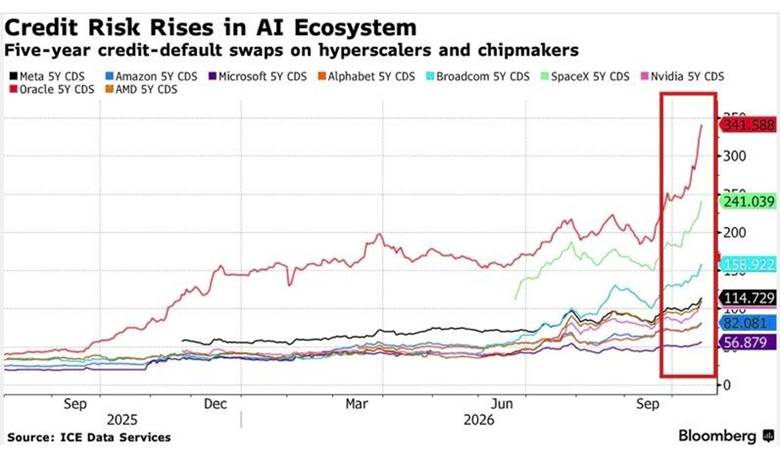
Credit market stress likely contributed to the latest pullback in technology stocks, as shown by the surge in credit default swaps in the Bloomberg chart below. Last week’s brief also highlighted CCC-rated and lower high-yield bond yields, which reached 17.61%. Yields moved above 18% this week before easing, in line with Thursday’s sharp decline in the 10-year Treasury yield.
Credit markets warrant close monitoring from here.
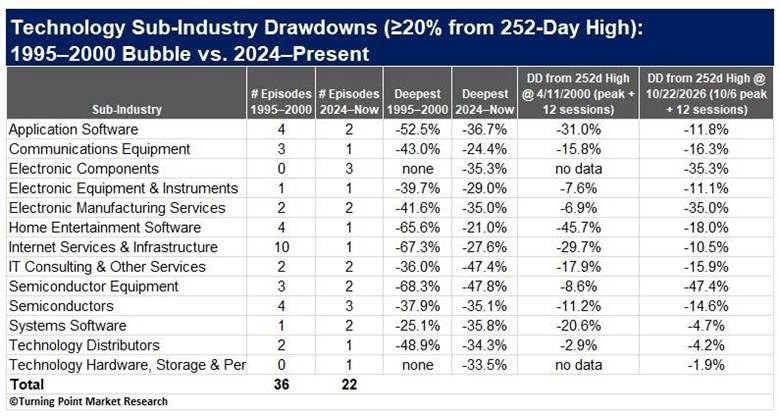
Given the parallels between the AI boom and the dot-com era, the following table compares 20% drawdowns across the two periods. From 1995 to 2000, technology sub-industries experienced 36 independent drawdowns of 20% or more, compared with 22 since 2024. The dot-com era spanned five years, while the current AI cycle is only three years in. With that in mind, don’t rule out further, potentially more painful drawdowns—a common feature of major innovation cycles.
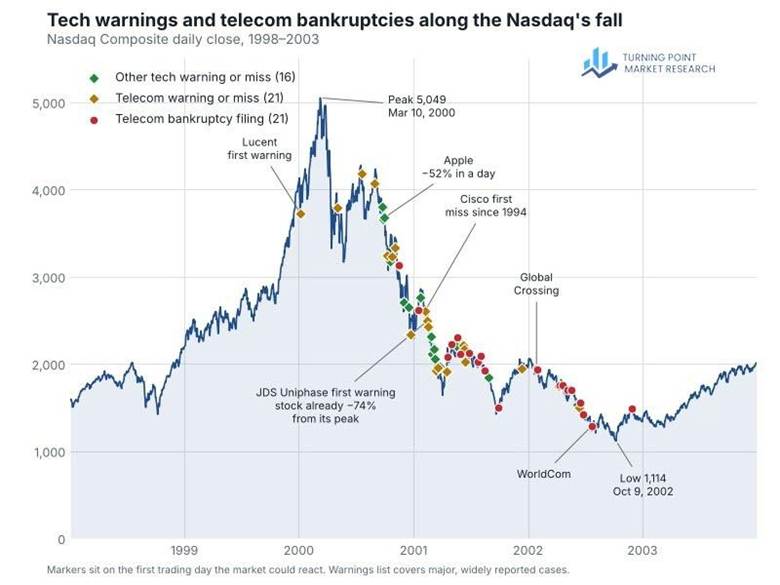
This may be the most important chart in today’s report. Let me be clear: this is not a call for a top. The prevailing narrative across financial media is that AI earnings are robust and the stocks are cheap. Those arguments are valid, but they don’t address the relationship between price and fundamentals.
Historically, prices often turn well before corporate fundamentals deteriorate. The dot-com period provides a clear example. Except for Lucent’s January 2000 warning, about two months before the peak, most earnings misses, profit warnings, and bankruptcies occurred after the March 2000 high, primarily in 2001. JDS Uniphase, one of the era’s most celebrated technology companies, had declined 74% from its peak before issuing its first warning. Telecommunications bankruptcies followed largely in 2001–2002.
The takeaway is straightforward: fundamentals can remain strong, or appear strong, even as the market begins discounting a very different future.
As stated previously, it’s important to remain open to all possible scenarios. If 90% of semiconductor stocks decline at least 10% over 10 sessions, the resulting oversold conditions could offer an opportunity to trade a mean-reversion bounce. Any such position would be a trade to rent.
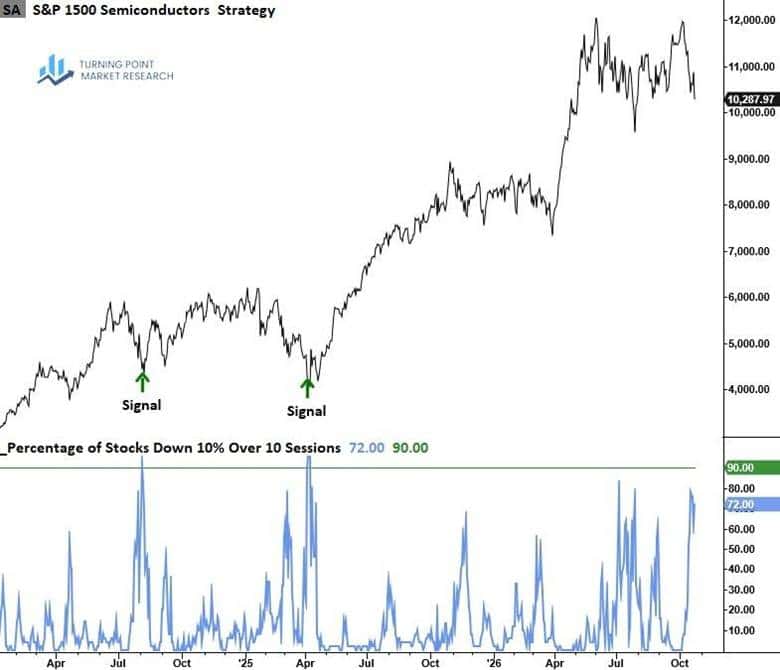
The same approach would apply if this breadth composite triggers an oversold reversal signal. Markets rarely move in a straight line, and the TCTM Risk-Off signal doesn’t preclude tactical opportunities as conditions evolve.
Research this week
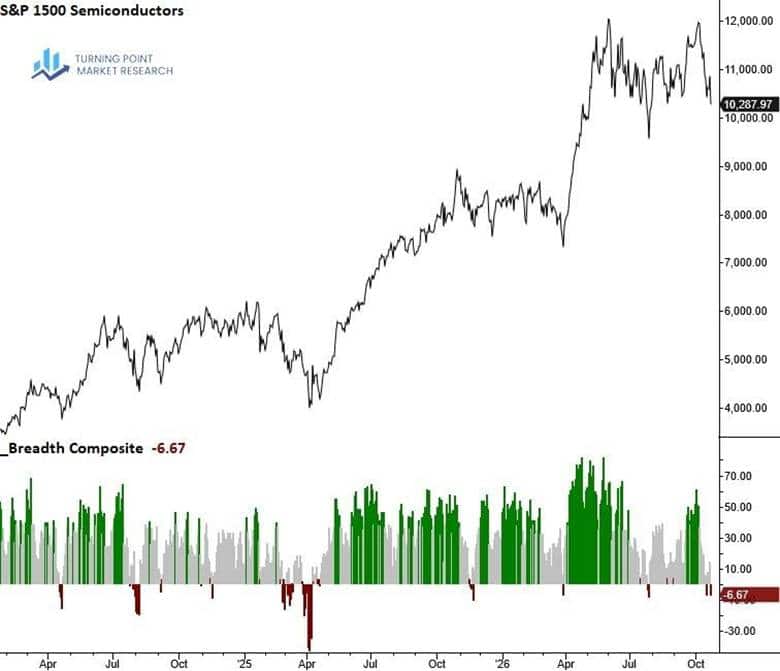
Monday’s S&P 1500 rankings report showed health care reclaiming the top spot, with energy moving into second place. Meanwhile, technology and industrials tumbled as AI beneficiaries came under renewed pressure. Given this week’s price action, technology is likely to slide further in the rankings.
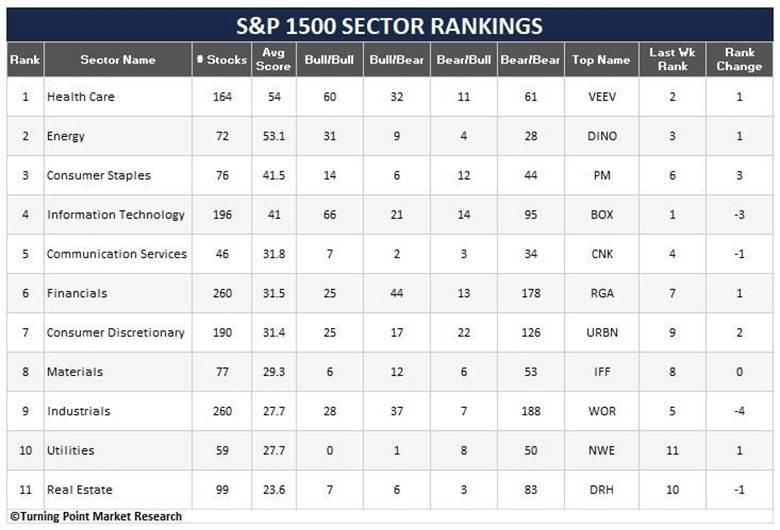
Thursday’s report revisited asset-class performance one month after the Federal Reserve’s first rate hike. Stocks, particularly interest-rate-sensitive groups, have staged a meaningful recovery as the 10-year Treasury yield has pulled back from its initial surge. The dollar, however, is sending a different message. Rather than weakening as it typically does following the first rate hike, it has continued to advance. That strength has created a headwind for the metals complex, which remains unattractive.
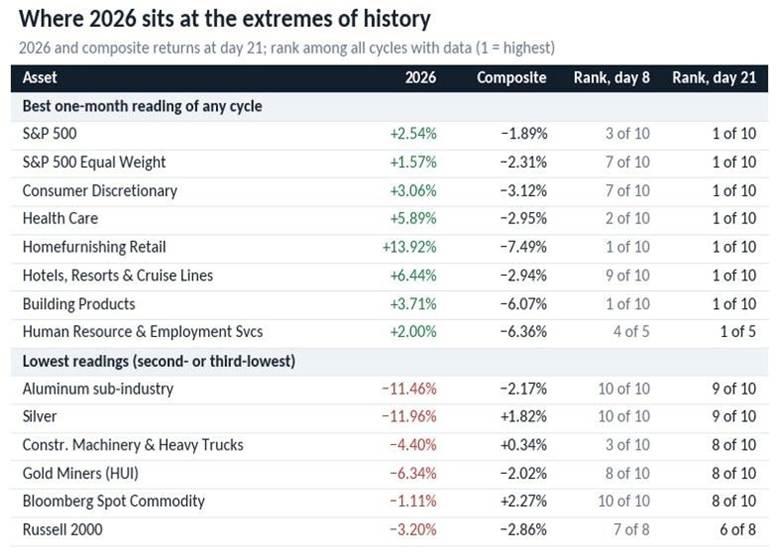
Dual trend analysis
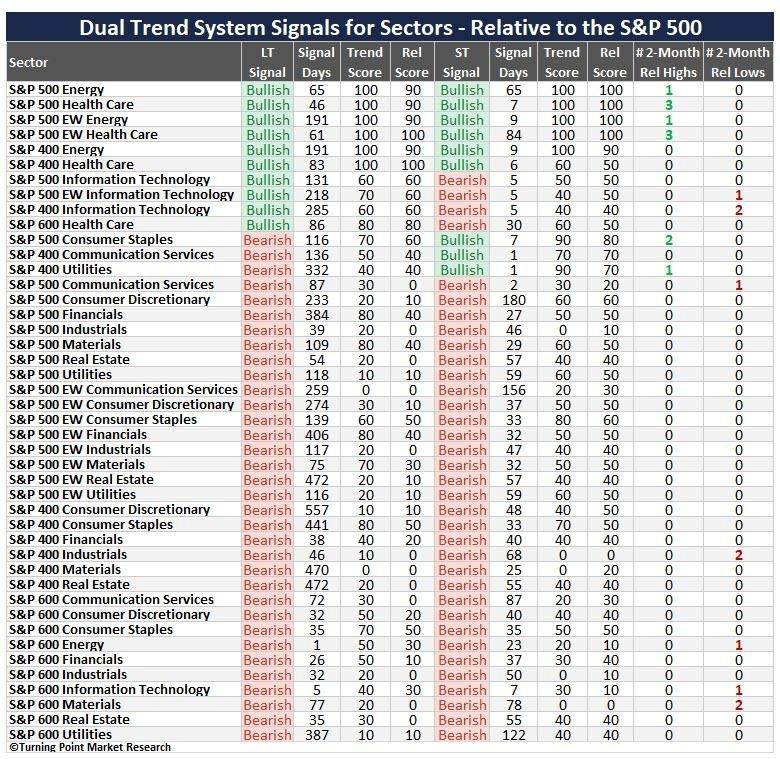
For the first time in quite a while, net gains across Dual Trend signals were positive in every sector. Technology was a surprise. A closer look revealed that software stocks drove the gains.
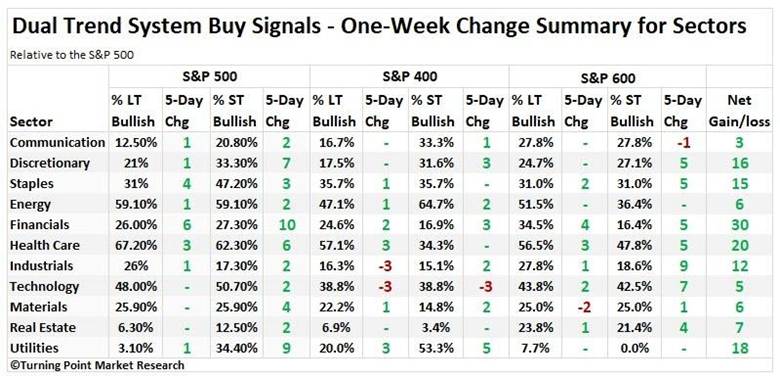
Sector-level dual trend signals were largely unchanged over the last week. Relative lows remained scarce outside technology, while health care and energy continued to lead in relative highs, consistent with their top rankings.
Portfolio update
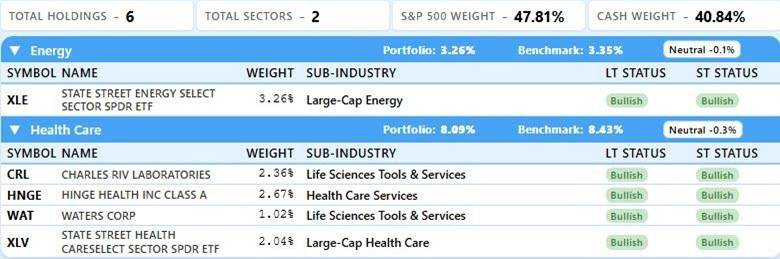
Portfolio activity was light this week. I further reduced technology exposure by selling the cybersecurity ETF and Dynatrace (DT), although cybersecurity remains a theme worth revisiting. Meanwhile, I increased the position in Charles River Laboratories (CRL) as relative strength in both the stock and its sub-industry group remains robust.
Overall, the portfolio remains underweight stocks and ETFs and overweight cash, reflecting the challenges of the current environment.
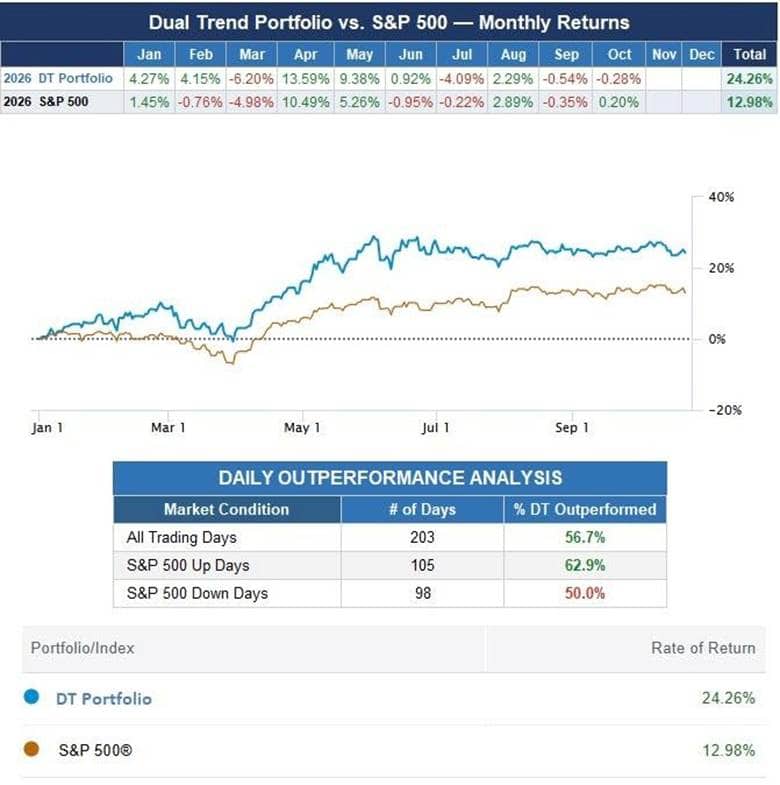
Through Thursday’s close, the Dual-Trend portfolio had gained 24.26%, outperforming the S&P 500’s 12.98% return.
Final thoughts
The TCTM Risk-Off signal remains in effect, pointing to elevated risks. However, outside of technology and lower-quality stocks, the broader tape doesn’t feel particularly heavy or vulnerable to a swift downturn. Instead, the market looks more like it’s undergoing another rotation beneath the surface.
That said, several potential catalysts are approaching, most notably next week’s Fed meeting. Another rate hike could set the stage for increased downside turbulence, while a pause could cut either way. A pause might signal a slower hiking cycle, which is typically more bullish than an aggressive one. Alternatively, the market could interpret it as a sign that the Fed isn’t serious about bringing inflation back to target, potentially damaging Kevin Warsh’s credibility.
Regardless of the outcome, flexibility is essential. Stay alert, keep an open mind, and be prepared to act if market conditions warrant it.