Broad Market Thoughts
If you study historical market peaks, one thing becomes apparent: the same market behaviors tend to repeat over time. While no two peaks are exactly alike, underlying business-cycle factors such as interest rates, inflation, excessive innovation-driven capital spending, and Federal Reserve policy eventually filter into stock prices, creating an increasingly fragile market foundation.
The TCTM Risk-Off Composite is designed to identify this through deteriorating market breadth, which reflects the market’s underlying stability. When that foundation becomes unhealthy, the market becomes more vulnerable to a countertrend pullback. Historically, those declines are often triggered by some catalyst that causes investors to question previously held assumptions.
That catalyst may have arrived this week in the form of the election, which triggered significant selling pressure across equities. While other forces likely exacerbated the decline, Thursday’s selloff drove the current TCTM Risk-Off signal’s return well below the historical average for previous signals, making this an unusually weak start relative to historical precedent.
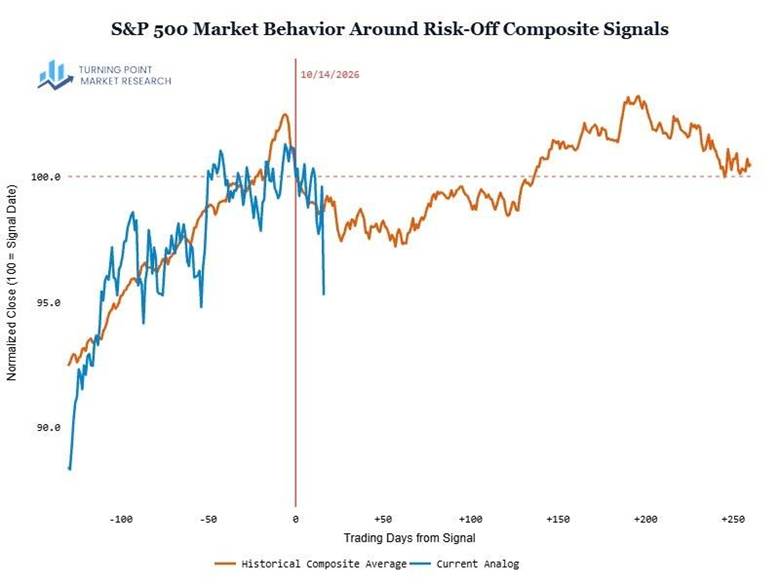
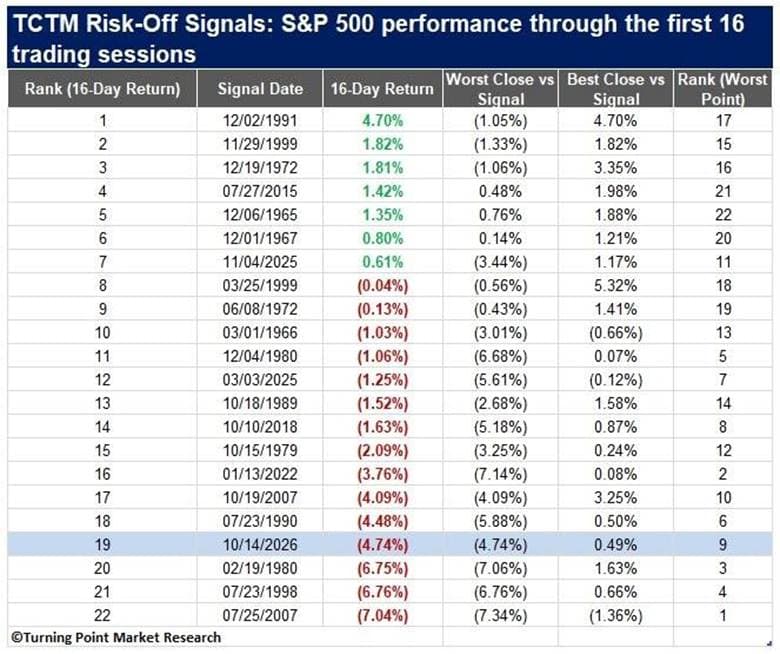
Just how weak has the current signal been through its first 16 days relative to previous Risk-Off signals? It ranks as the fourth-worst start on record, trailing only February 1980, July 1998, and July 2007. The latter is a particularly compelling analog. While it’s tempting to focus on the devastating bear market that followed, what’s more interesting is the similarities in what’s happening within the hedge fund community.
Here’s what ChatGPT returned when I asked what happened to quantitative trading firms in August 2007.
“August 2007 is remembered on Wall Street as the “Quant Quake” or “Quant Meltdown.” It was one of the most significant episodes of simultaneous losses among quantitative hedge funds, particularly equity market-neutral, statistical arbitrage, and long/short strategies. What makes the episode particularly interesting is that several highly sophisticated quantitative firms, using different models and trading systems, experienced enormous losses at virtually the same time. The underlying problem was believed to be crowded positioning, excessive leverage, and forced liquidation.”
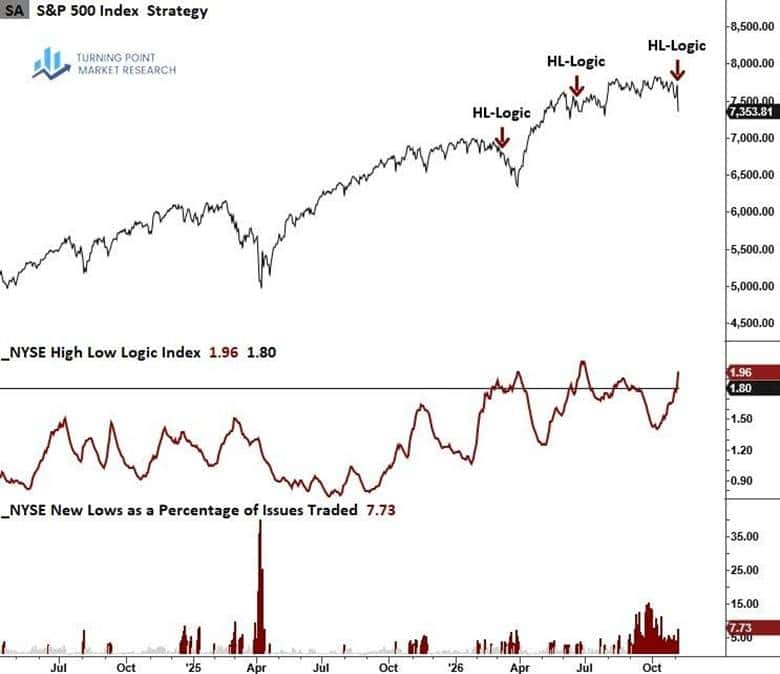
Although it has no bearing on the current Risk-Off signal, which is already active, the High-Low Logic Model triggered a warning this week. The signal highlights the growing divergence beneath the market’s surface and brings the total number of active warnings to six, or 50% of the composite.
More market anomalies
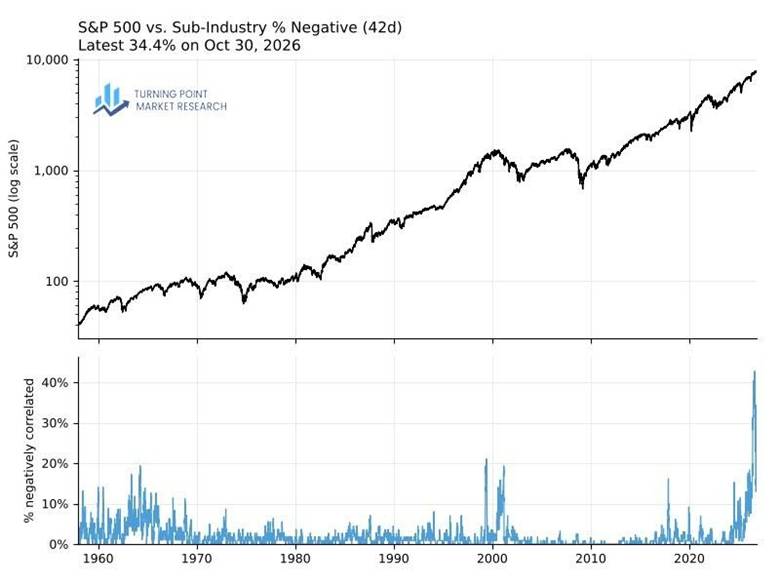
Market anomalies continue to surface, underscoring the increasingly distorted environment created by extreme market concentration, financial engineering, and evolving market structure. Consider the correlation between the S&P 500 and its 11 sectors. Historically, sector performance has closely tracked the broader market. Today, however, five of the 11 sectors have a negative correlation to the S&P 500, an exceptionally rare occurrence. The only similar period was in early 2000.
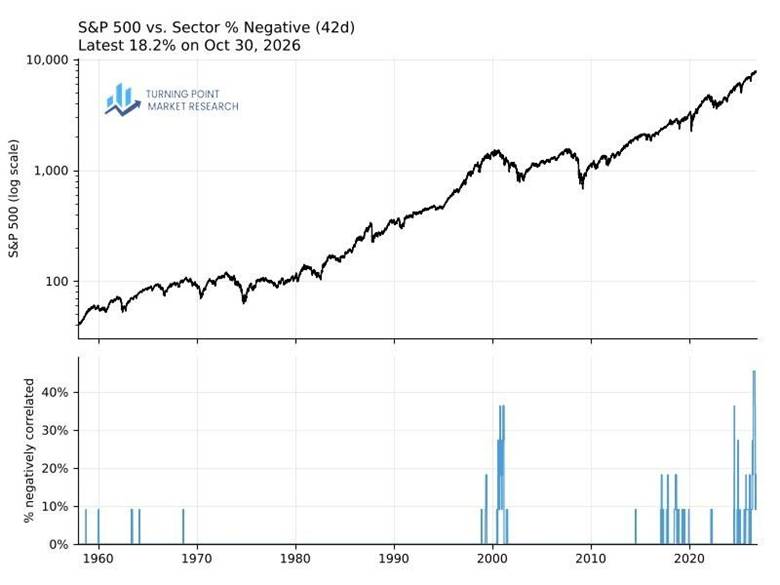
The same correlation breakdown extends across sub-industry groups, where the percentage exhibiting negative correlations to the S&P 500 has also reached a record high.
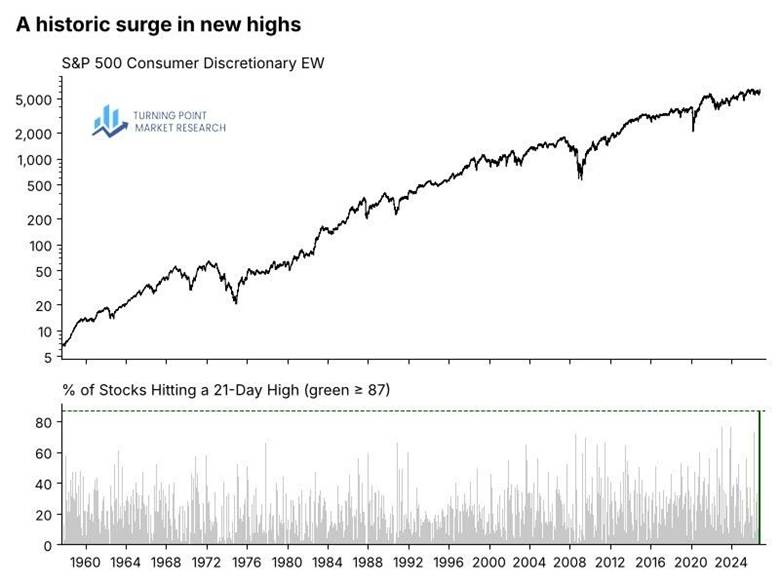
The market’s increasingly unusual two-sided behavior was on full display Wednesday. As the AI trade unraveled, other areas of the market surged. S&P 500 consumer discretionary stocks were particularly impressive, with 87% hitting a 21-day high, a record. Historically, breadth thrusts of this magnitude tend to emerge during powerful recoveries from bear markets or significant corrections. They are normally an unequivocally bullish development. But this isn’t a normal market environment. Given the extreme bifurcation beneath the surface, I’m inclined to temper my enthusiasm for these one-off sector thrusts.
Semiconductor thoughts
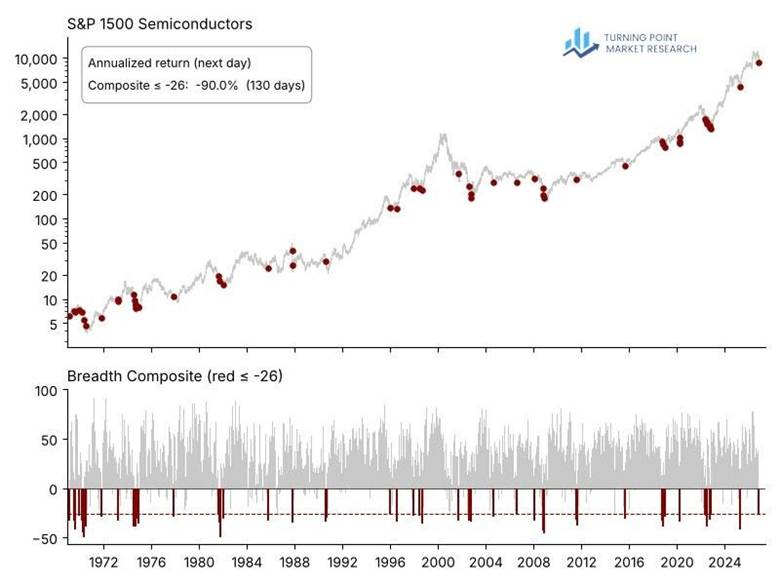
Nowhere was selling pressure more pronounced on Thursday than in the semiconductor space, where 76% of stocks fell 10% or more. The selloff pushed a breadth composite to -26%, an extreme reading that has occurred on just 130 trading days since 1970.
As the red dots in the chart below show, these readings tend to emerge during significant drawdowns and are historically associated with negative annualized returns. That argues for caution when considering buying the falling knife. Of course, every new rally begins from an oversold condition, so the objective now is to monitor the group for signs of stabilization followed by a reversal signal.
Given the severity of the semiconductor selloff, I wanted to determine whether similar periods had occurred historically. To do so, I compared the November 5, 2026, readings across 30 semiconductor breadth indicators against every trading day dating back to 1971. I converted each indicator to a z-score to normalize the readings and make them directly comparable. Historical sessions were then evaluated using four separate similarity measures, which were combined into a single consensus ranking. To qualify, the S&P 1500 Semiconductor Index had to be 18–38% below its 52-week high, with at least half of its constituents still showing positive 12-month returns. Finally, only the closest match from each distinct episode was retained, leaving ten historical matches.
Similar price action to the Dotcom era
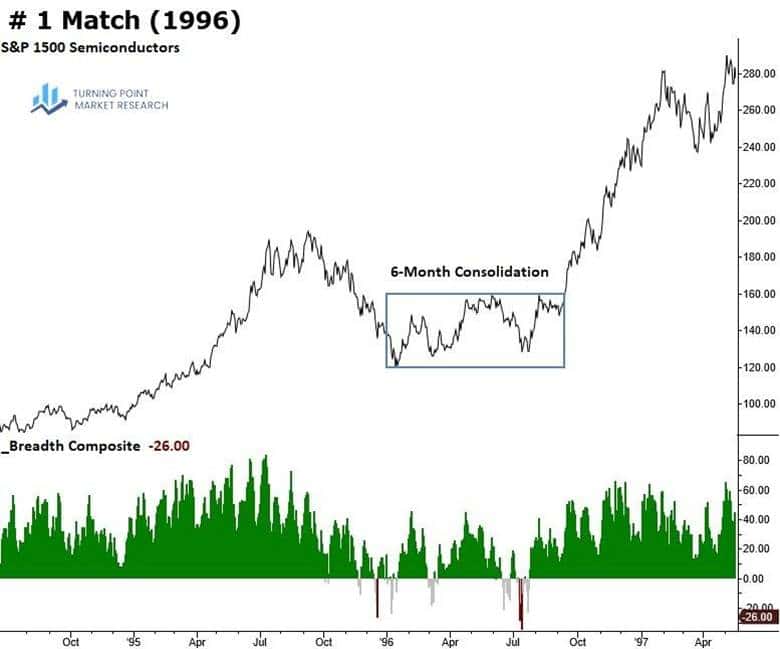
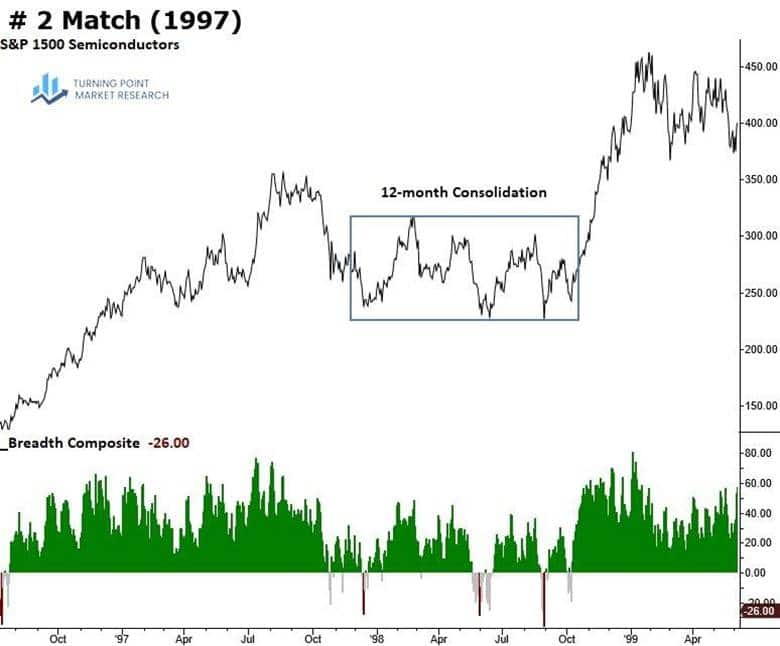
Three of the four closest historical matches occurred around the dot-com era, with 1996 and 1997 ranking as the two most similar periods, both preceding the bubble’s eventual peak. This suggests a historical precedent for severe drawdowns within an ongoing bull market.
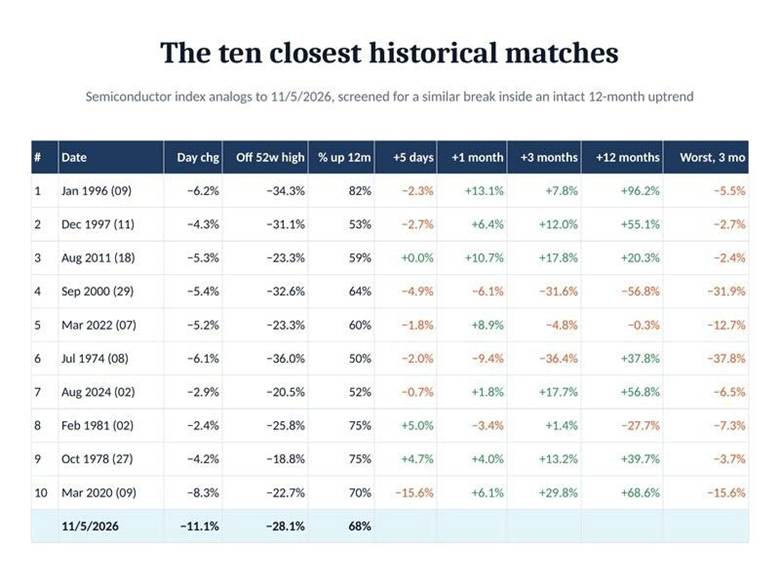
Following the 1996 analog, the S&P 1500 semiconductor sub-industry group rebounded from an oversold condition and entered a six-month consolidation.
The 1997 episode followed a similar pattern, with semiconductors recovering from oversold conditions before consolidating for the next year.
Given the sharp decline in semiconductors over the past month, I ran a historical study to identify similar episodes across sectors and sub-industry groups dating back to 1970. The study isolated instances in which a group fell at least 27% over 22 trading sessions after starting at, or within 1% of, a record high—the same conditions semiconductors just experienced.
At first glance, these episodes typically produced a rally. However, the results were heavily skewed by the 1987 and 2020 market crashes. Excluding those periods reveals a much less encouraging picture, with similar declines producing negative returns across most forward-looking horizons.
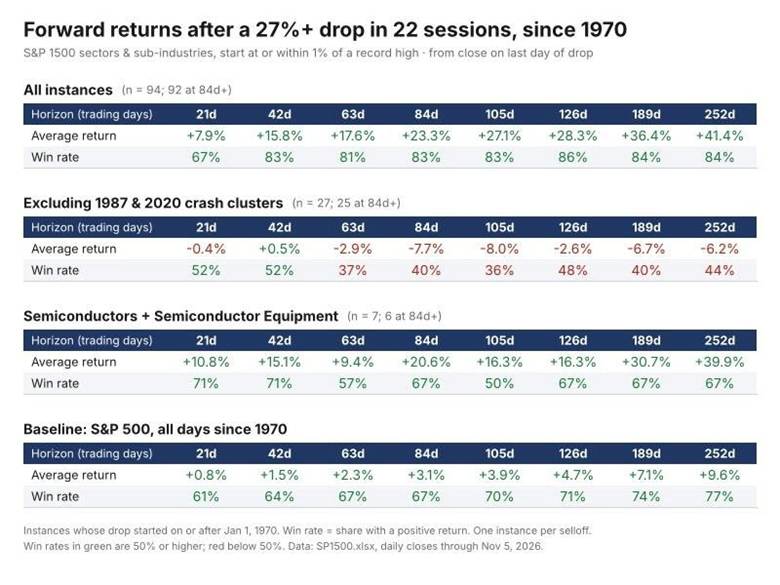
Bottom line: Semiconductor stocks may be due for a relief rally, but a sustained advance is unlikely. Consolidation is the more probable outcome.
Research this week
Monday’s S&P 1500 rankings reinforced the market’s defensive character. Health care, consumer staples, and utilities held three of the top four spots, while communication services fell four spots to rank last among all sectors.

Coty Inc. (COTY), Monday’s featured chart, took off following its earnings report, jumping double digits on Thursday while the major indexes were under significant pressure.

Dual trend analysis
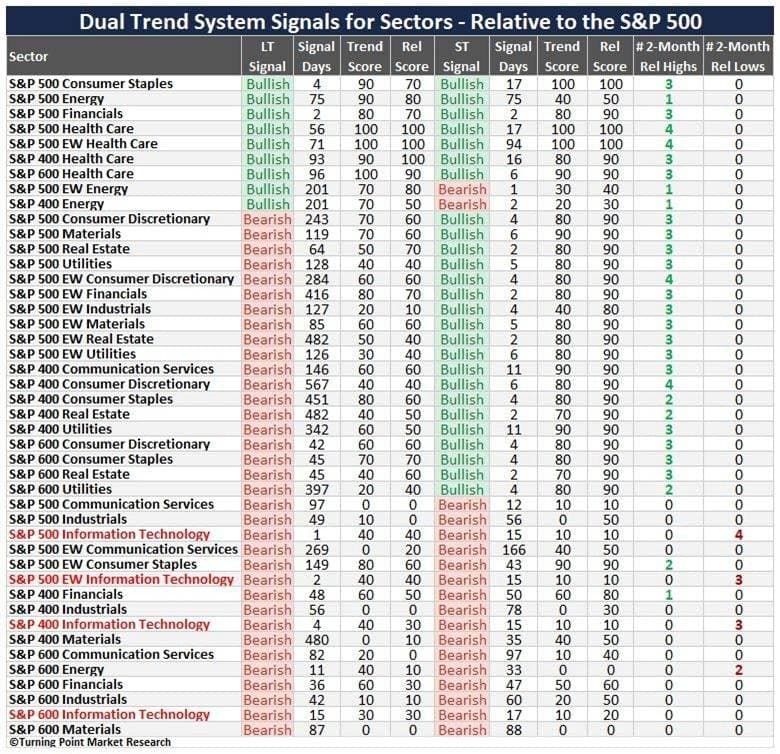
Another week saw rising Dual Trend buy signals across non-AI stocks, led by financials. Conversely, technology and energy, two of this year’s market leaders, experienced significant declines in buy signals.
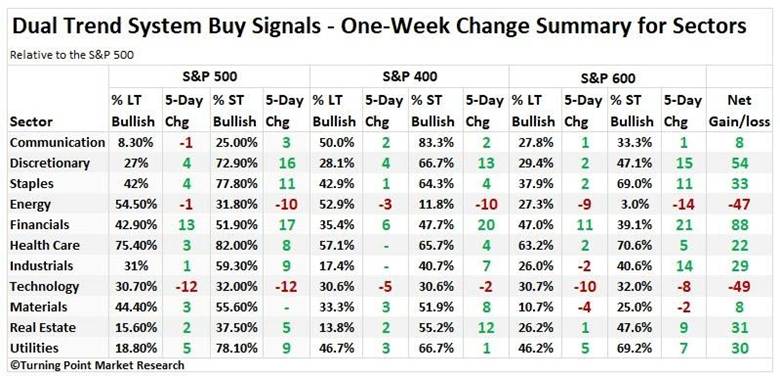
Reinforcing the weakness in individual stocks, all four technology sectors shifted to bearish regimes across both the short- and long-term Dual Trend systems.
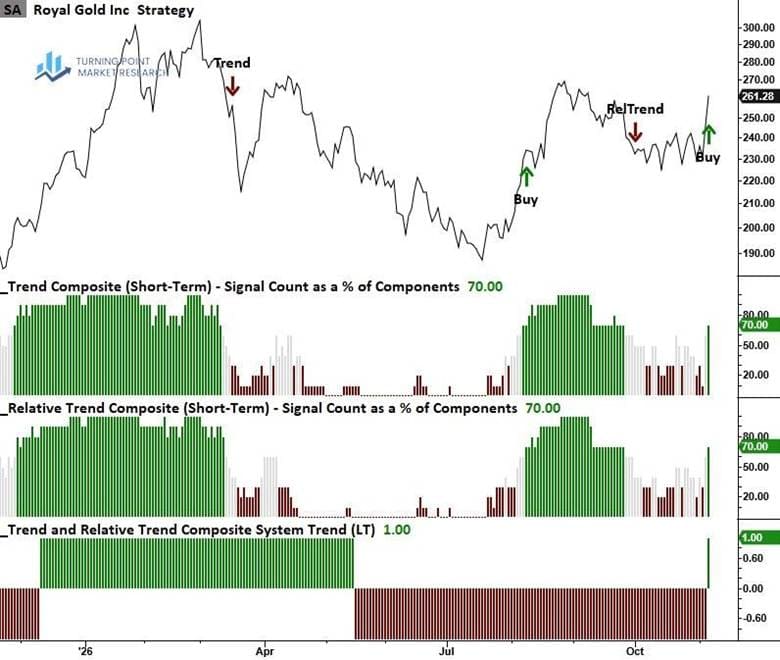
A dual trend signal that caught my attention on Thursday was Royal Gold (RGLD), which has turned bullish on both the short- and long-term models. The chart pattern is also compelling, particularly if the stock can clear its August pivot high. That said, it’s important to keep the broader backdrop in perspective. Conditions across the mining group remain bleak, with RGLD the only stock carrying bullish signals on both timeframes and Centerra Gold (CGAU) the only other stock showing a bullish long-term signal.
Gold miners are moving higher as I write this report, shrugging off a strong U.S. dollar. That’s worth paying attention to.
Portfolio update
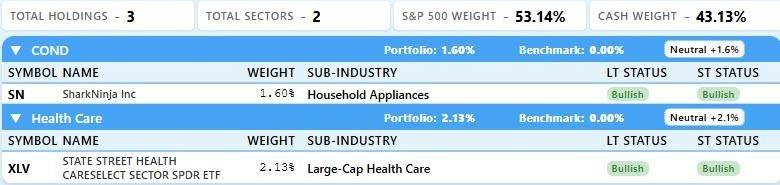
Several broad market exposure transactions were made this week. On Tuesday, the S&P 500 ETF was purchased as a hedge against a post-election relief rally, which materialized on Wednesday and helped minimize relative underperformance. That exposure was quickly removed on Thursday as the market unraveled. The DT portfolio also sold its energy and biotech ETF positions, further increasing cash, which now stands at 43%. The lone purchase was SharkNinja (SN), a stock that had been on the watchlist for some time.
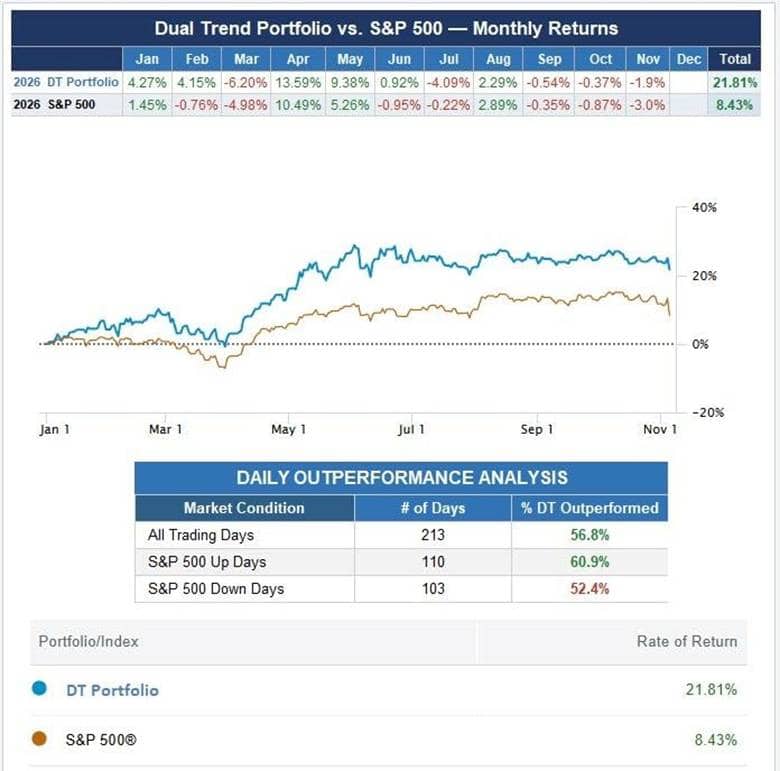
Through Thursday’s close, the Dual Trend portfolio had gained 21.81%, outperforming the S&P 500’s 8.43% return.
Final thoughts
The market remains in a risk-off regime, reflecting a challenging environment. While technology and AI stocks are oversold and could stage a rebound, their charts are broken. The market’s two-sided nature presents another obstacle: weakness in one area is being offset by strength elsewhere, leaving much of the market without the oversold conditions typically associated with a durable low. With few obvious catalysts on the horizon, the seasonally strong months of November and December could leave investors disappointed. Individual opportunities will undoubtedly emerge, but selectivity and risk management will remain essential.