Broad Market Thoughts
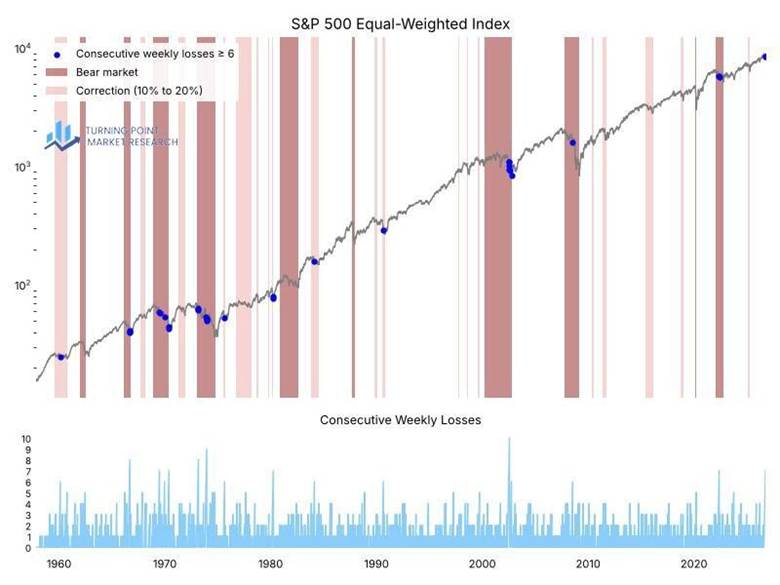
The stealth correction accelerated this week. In fact, the equal-weighted S&P 500 is on track to close lower for a seventh consecutive week, a streak last seen during the 2022 bear market.
The chart below puts this move into historical context, with a blue dot marking each instance when a losing streak reached six consecutive weeks. I’ve also shaded periods when the cap-weighted S&P 500 was in a bear market—defined as a drawdown greater than 20%—in dark red, and corrections between 10% and 20% in light red. As the chart illustrates, six-week losing streaks have historically occurred during corrections or bear markets.
With the S&P 500 less than 2% below its record high, the current market backdrop is unprecedented. Weak relative trends are not inherently concerning and often result from mega-cap leadership, but outright price deterioration is harder to dismiss—and that is increasingly evident now.
Of course, one could argue that the average stock is oversold and due for a catch-up rally, but that scenario depends heavily on the 10-year Treasury yield cooperating.
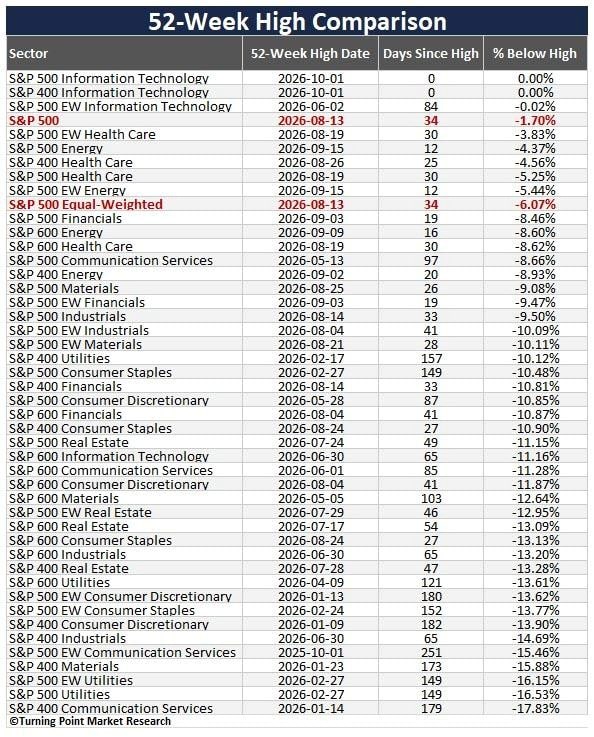
Selling pressure extends well beyond the equal-weighted S&P 500. Across market-cap segments and index-weighting methodologies, 64% of sectors are more than 10% below their rolling 252-day highs, suggesting much of the market has already declined meaningfully.
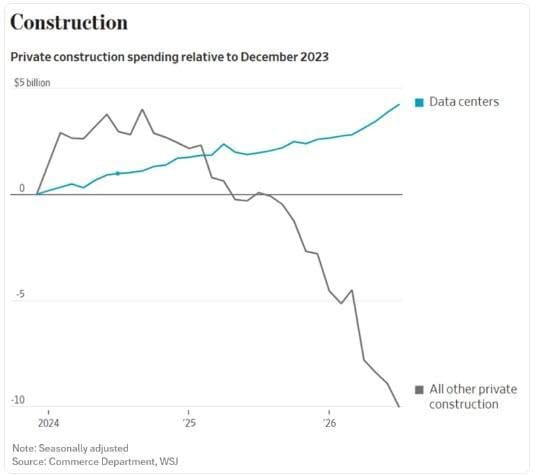
The following chart from the WSJ provides a fundamental explanation for the weak market breadth, as elevated interest rates disproportionately weigh on old-economy stocks while having less impact on companies tied to AI spending.
François Trahan put it best: “Anyone looking for a chart of the ‘two economies’ thesis should take a look at this one.”
For stock market technicians, the quote could just as easily read, “two stock markets.”
Research this week
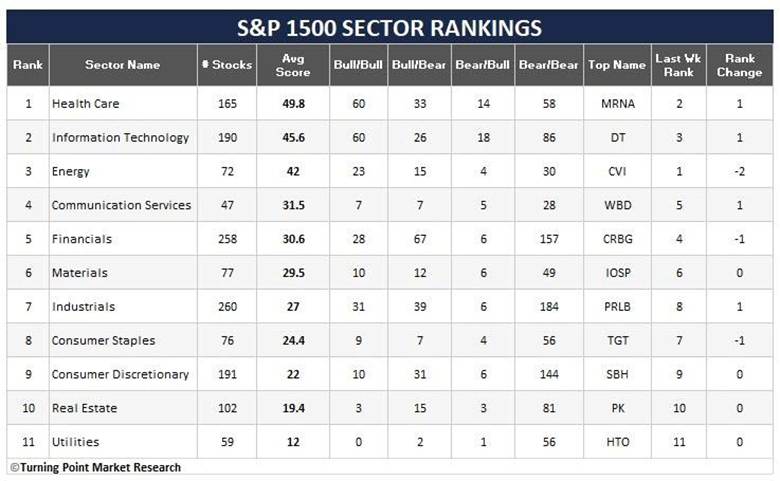
Monday’s S&P 1500 rankings showed health care moving into first place, while technology climbed to second, helped by renewed strength in semiconductors. Financials, meanwhile, have slipped to fifth, and based on this week’s price action, I suspect they could fall further in the rankings.
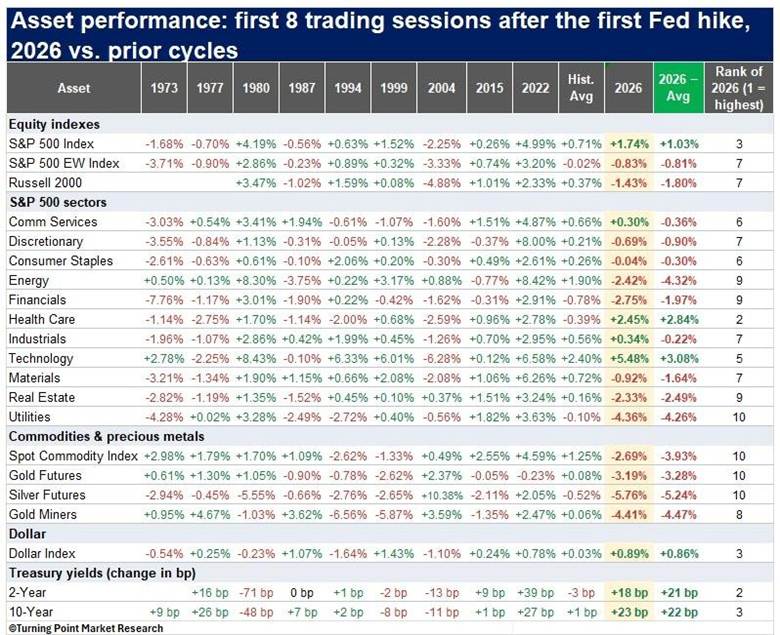
During Tuesday’s monthly conference call, a study examined asset performance during the first eight sessions following Federal Reserve rate hikes. The S&P 500 outperformed historical precedents, fueled by technology and health care, but the gains were far from broad-based. Nine of 11 sectors trailed their historical averages, while commodities, gold, silver, and utilities recorded their weakest returns in history. Treasury yields appear to be the primary culprit, with rates posting some of their largest upside moves following these episodes.
Dual-trend analysis
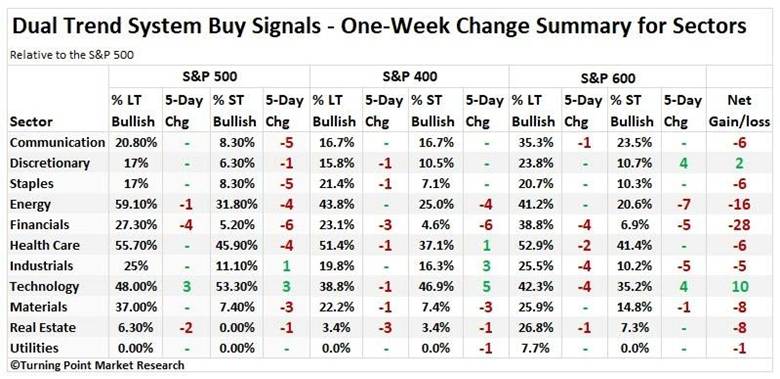
Bearish Dual Trend shifts continue to outpace bullish shifts, although the pace has moderated considerably from previous weeks. Not surprisingly, technology led all groups with net gains across both the S&P 500 and S&P 400.
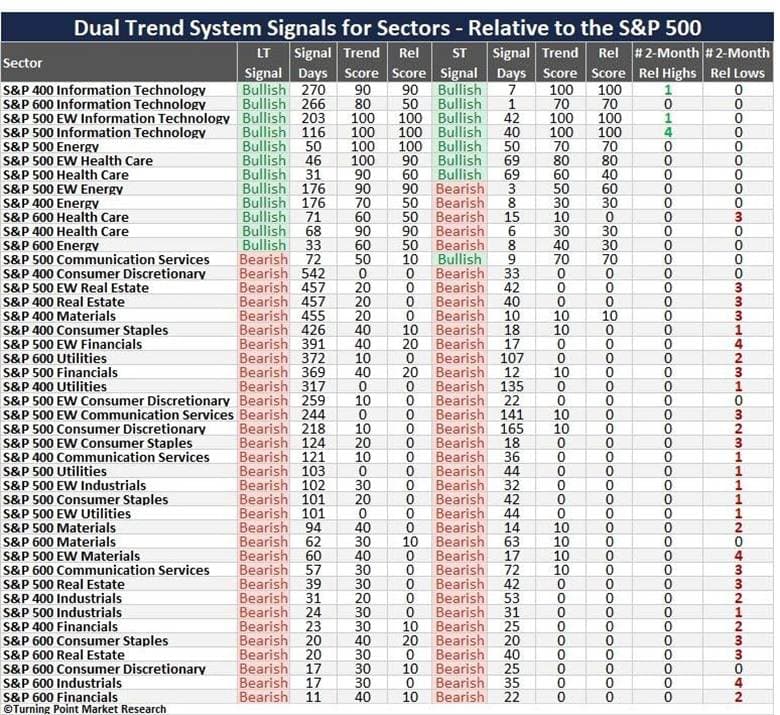
With the bullish shift in the S&P 600 Technology sector this week, technology is now the only group with all four indexes carrying positive short- and long-term Dual Trend signals. Meanwhile, the S&P 500 EW Energy sector shifted to a bearish ST DT condition, further highlighting its deterioration in relative strength.
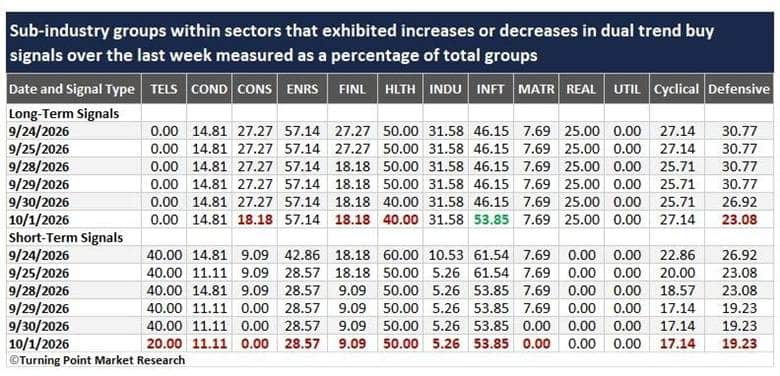
The number of bullish ST DT signals declined across sub-industry groups in nearly every sector over the last week, including within technology.
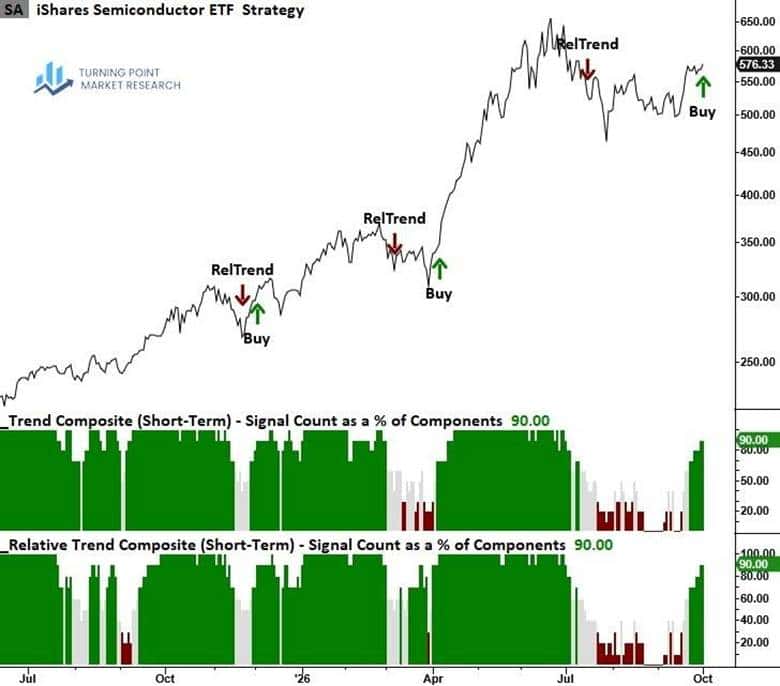
On Thursday, the Semiconductor ETF (SOXX) shifted to a bullish ST DT signal, aligning with its long-term model. This matters for semiconductors because SOXX is more diversified than SMH: its largest holding accounts for less than 10% of the fund, compared with roughly 19% for SMH. As a result, SOXX’s strength reflects broad-based semiconductor trends rather than the performance of one or two stocks.
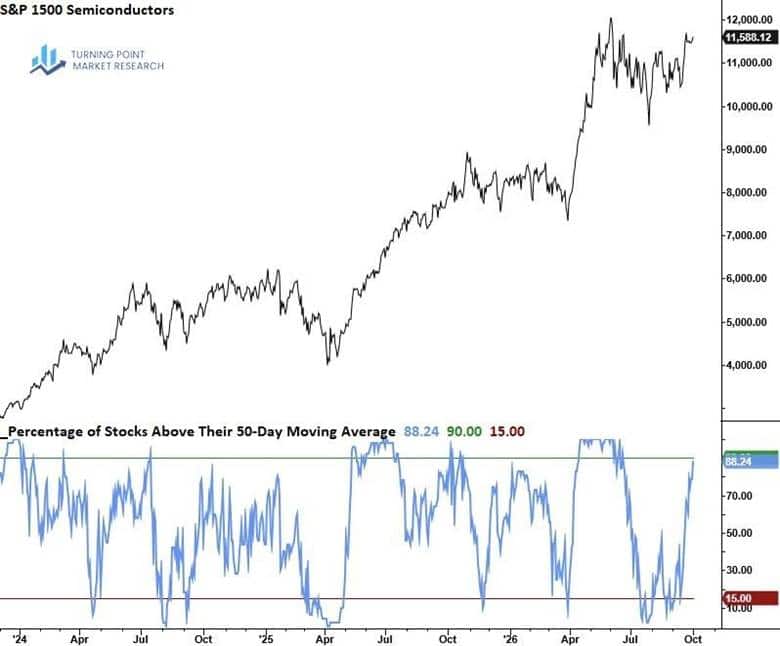
Speaking of improving trends, 88% of semiconductor stocks are now trading above their 50-day averages, highlighting broad participation across the group.
Portfolio update
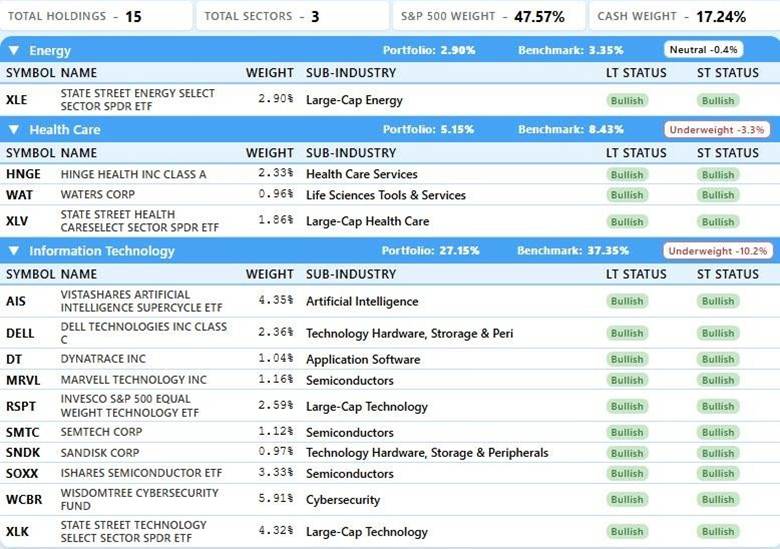
The Dual Trend Portfolio sold the Biotech ETF (XBI) and Micron Technology (MU) this week. For biotech, the ST DT system shifted to bearish, while post-earnings price action in MU was disappointing.
Two new positions were added: Waters Corporation (WAT) and the Semiconductor ETF (SOXX). Life Sciences Tools & Services ranked as the No. 1 sub-industry group last week, prompting the addition of WAT and leaving room to add more exposure to the group. While the portfolio already has semiconductor exposure, SOXX provides a broader basket that better captures the group’s bullish relative trends.
Week over week, cash remained unchanged at 17%.
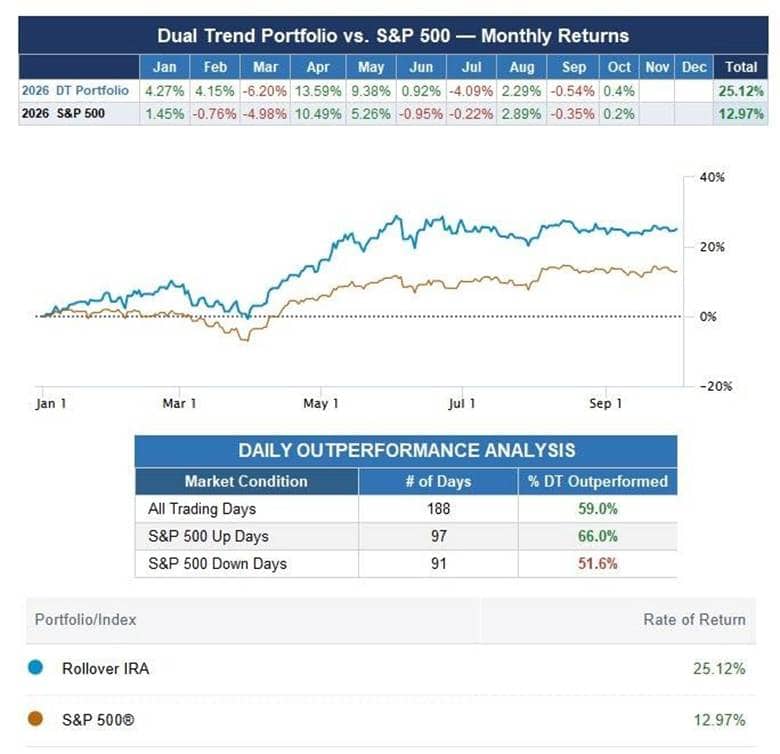
Through Thursday’s close, the Dual-Trend portfolio had gained 25.12%, outperforming the S&P 500’s 12.97% return.
Final thoughts
Yields remain firmly in the driver’s seat, and that dynamic is unlikely to change anytime soon. Even modest moves in the 10-year Treasury yield are being amplified across various stocks, making this an increasingly difficult market to navigate. In all likelihood, a decisive move down to 5% or even below in the 10-year yield will be needed to support a sustained advance in the average stock. Until then, maintaining a slightly cautious overall market stance makes sense while waiting to see how stocks respond to earnings, the Fed’s decision later this month, and the outcome of the midterm elections.