Key points:
- The TCTM Risk-Off composite triggered a warning
- Comparable signals saw the S&P 500 struggle over the next few months
- Defensive sectors outperformed as cyclicals underperformed
Internals signal an unhealthy market environment
For only the 30th time since 1929, the TCTM Risk-Off Composite has triggered a warning, signaling narrowing market participation and increased vulnerability to a countertrend pullback in the S&P 500. No indicator is perfect, but historical evidence suggests that the breadth measures underpinning the TCTM Risk-Off Model have done a reasonably good job of identifying periods when macroeconomic forces begin to weigh on segments of the equity market.
The primary headwind today is no secret: elevated interest rates. The critical question is whether economic growth can withstand the higher cost of capital. In the early stages of the business cycle, economic momentum generally positions the economy to absorb rising rates. Later in the cycle, however, the answer becomes less clear as higher yields increasingly challenge growth and corporate profitability.
Innovation adds another layer of complexity. Major technological advances can extend the business cycle by driving productivity, investment, and earnings growth. The question is whether today’s AI cycle can keep offsetting the pressure from higher rates—or whether an unforeseen event ultimately ends the expansion.
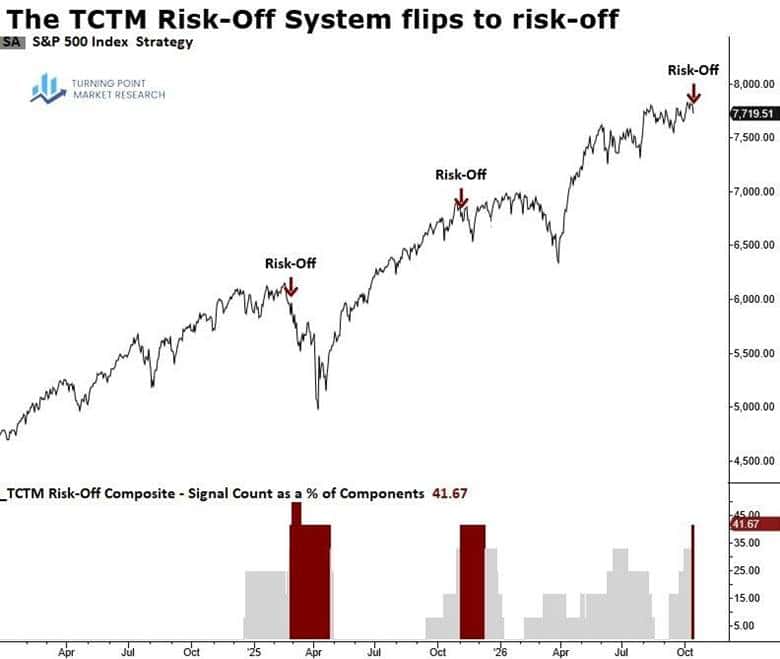
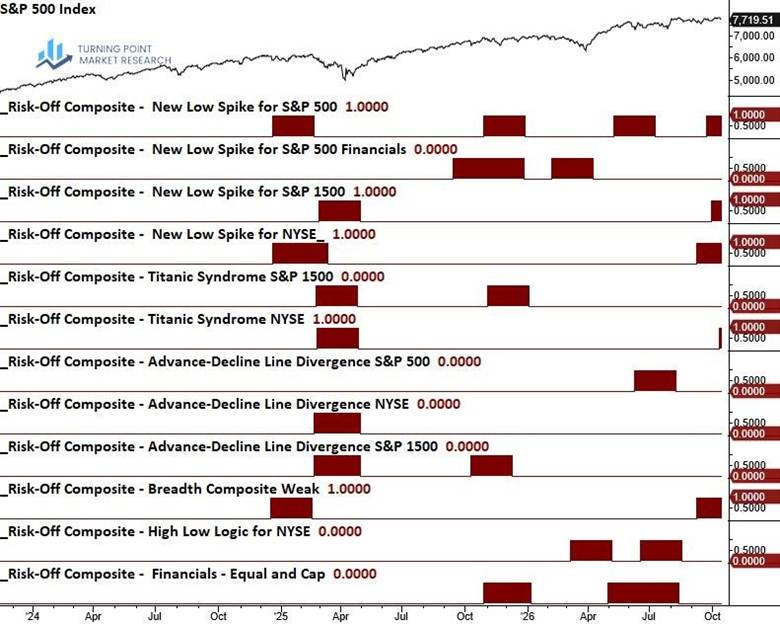
Five warnings are now in place: the S&P 500, S&P 1500, and NYSE 52-week low spike signals, Titanic Syndrome, and the S&P 500 breadth composite. As noted previously, the A-D Line models for all three indexes could also trigger alerts if the S&P 500 experiences further price weakness.
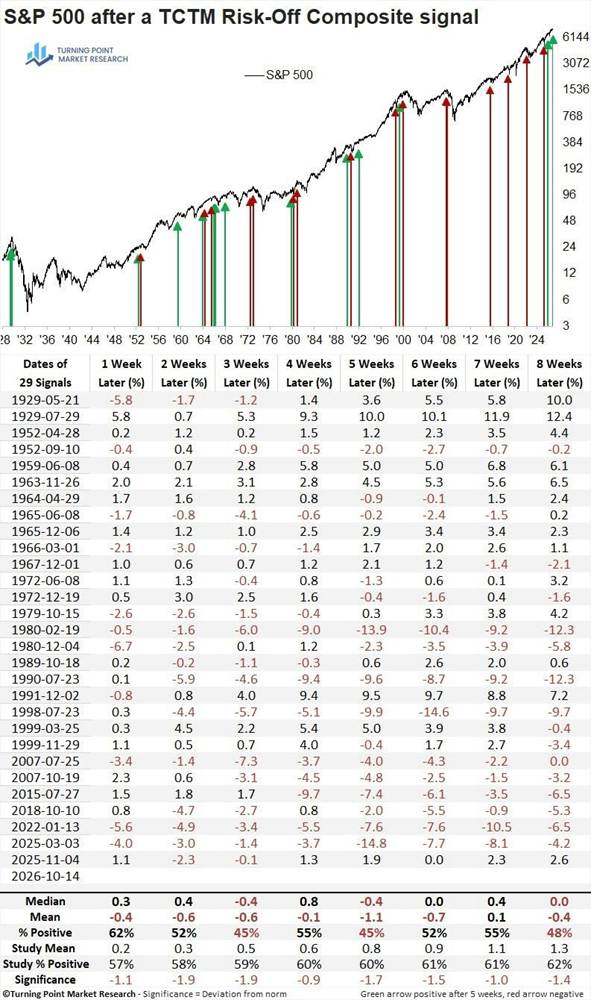
Since 1929, TCTM Risk-Off signals have pointed to an unfavorable outlook for the S&P 500, though not materially so. However, relative to baseline results, the index underperformed in both mean return and win rate across all but one measurement interval.
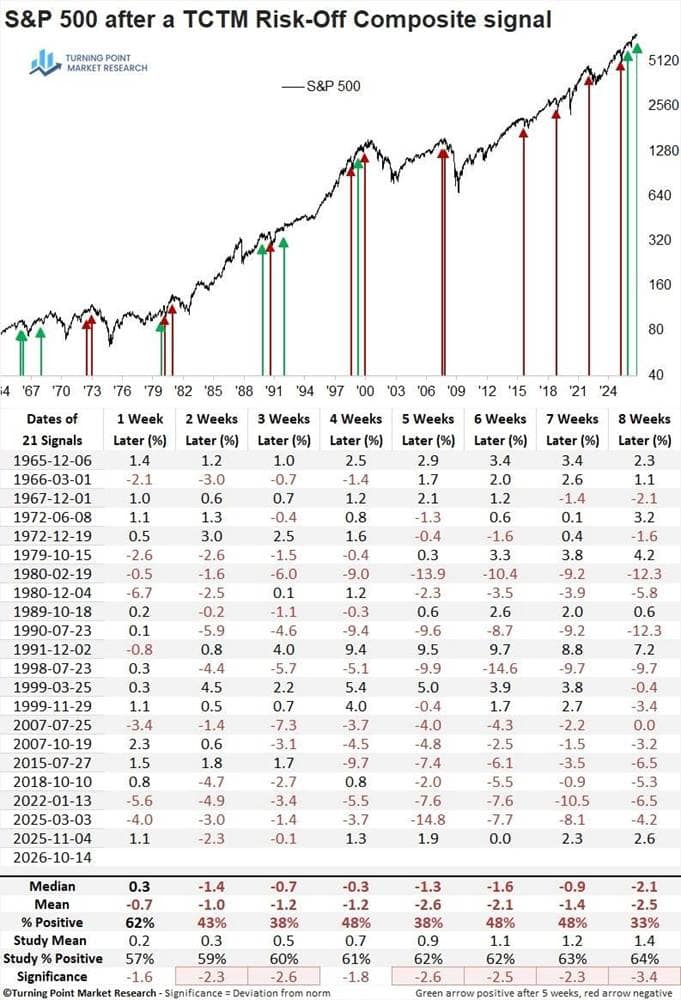
More recent results, which I tend to weight more heavily, are considerably more bearish, with nearly every interval showing statistically significant negative returns. The November 2025 signal was not as weak as other historical instances. Still, the S&P 500 was flat six weeks later.
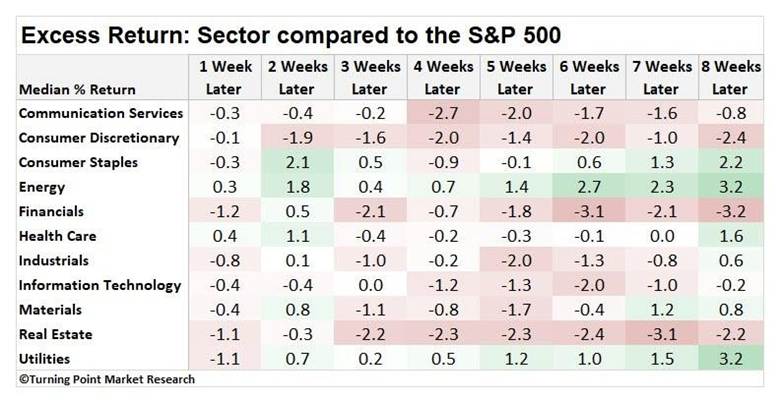
As is typical during corrective phases, defensive sectors outperformed the S&P 500, while cyclical groups lagged. As a general rule, avoid high-beta and speculative stocks.
Context
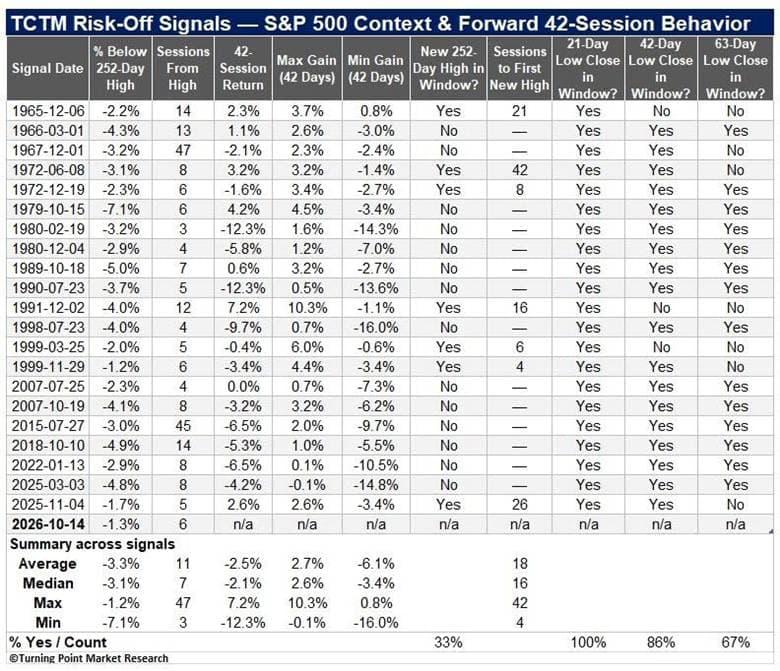
TCTM Risk-Off signals have typically triggered when the S&P 500 was already 3.3% below its high, with the peak occurring an average of 11 sessions earlier. From that point, the average maximum loss was twice the average gain, highlighting the unfavorable risk-reward profile. The index recovered to a new high in 7 of 22 instances (32%) over the next 42 sessions, taking a little over three weeks on average. Moreover, every signal was followed by a new 21-day low, while 86% were followed by a new 42-day low.
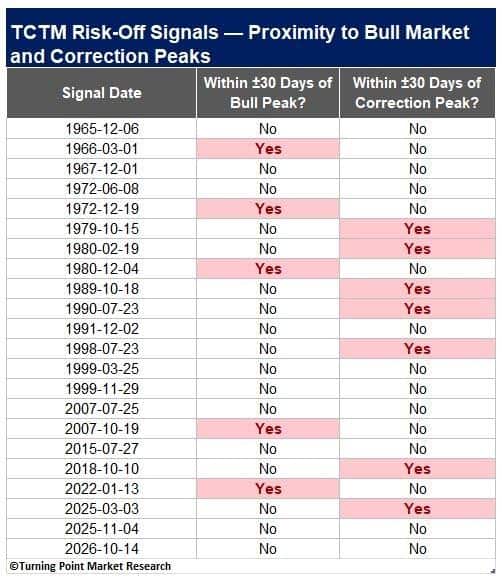
Looking across 22 bull-market and correction peaks, TCTM Risk-Off signals coincided with 12 (54%) of those dates.
What now
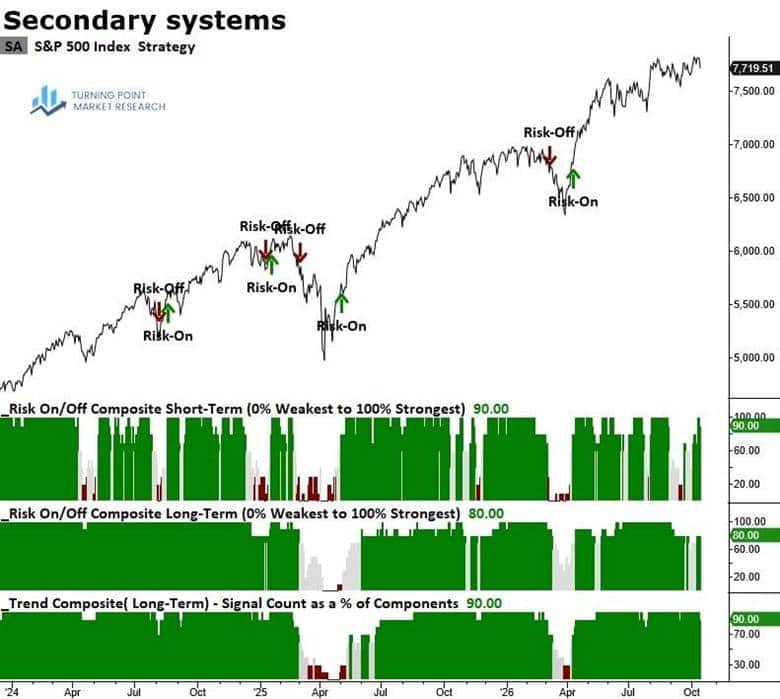
The Dual Trend Portfolio currently holds 34% cash. For now, there is no compelling reason to increase that allocation further, as the S&P 500 trend remains firm. Attention will turn to the Short-Term Risk-On/Off System to see whether it shifts to a bearish status, indicating that trend conditions for the S&P 500 have turned negative.
Notably, the system remained bullish after the November 2025 TCTM Risk-Off signal, as the market experienced a rotational pullback without meaningful deterioration in the trend. Because of that precedent, I’ve decided to keep my market outlook bullish, though significantly less so, until the S&P 500 trend confirms the internal weakness.
What the research tells us…
The TCTM Risk-Off Model has triggered a warning, signaling deteriorating market participation and a potentially more challenging environment for equities over the coming months. This activates a 42-session window focused on capital preservation while retaining the flexibility to adjust exposure in either direction as conditions evolve. For example, continued relative strength in health care could justify incremental additions to the group even as the portfolio maintains a meaningful cash position. No predetermined cash allocation is tied to these signals. Instead, cash will generally increase to a level that protects against a portfolio drawdown, with the final allocation guided by market conditions and available evidence. Should a Washout, Capitulation, Thrust, or Breadth Composite oversold signal occur during the window, stock exposure could be increased. Once the window expires, positioning will be reassessed using the Short-Term Risk-On/Off System, Long-Term Risk-On/Off System, Trend System, and TCTM Long-Term Trend Model.