Key points:
- Stocks rebounded sharply after the first Fed rate hike
- The Dollar Index has defied historical trends, remaining firm
- Commodities, especially metals, continue to struggle
Copper stands alone as metals trends deteriorate
A month has passed since the Federal Reserve delivered its first rate hike since 2023. Shortly after the decision, I published a report comparing asset performance over the first eight sessions with a historical composite of initial rate hikes. At the time, bond yields and the dollar were stronger than historical patterns, creating headwinds for interest rate- and dollar-sensitive groups.
Let’s revisit the analysis to see how conditions have evolved, with a particular focus on the weakest area: metals.
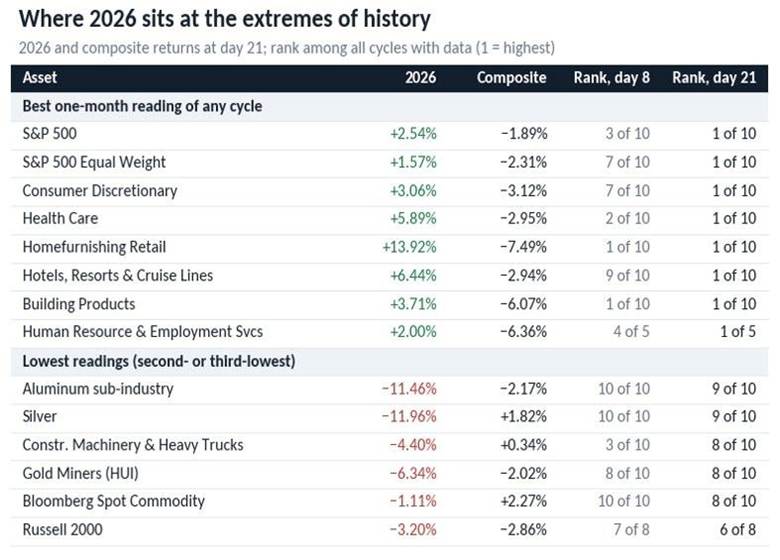
At the one-month mark, several groups have improved considerably and now post their best relative performance across the 10 historical cases. Notably, consumer discretionary climbed from seventh to first, while hotels, resorts, and cruise lines went from the second-worst performer to the best.
The retreat in the 10-Year Treasury yield has clearly played a significant role in this shift. In contrast, commodity-related groups, particularly the metals complex, have remained weak amid a firm dollar.
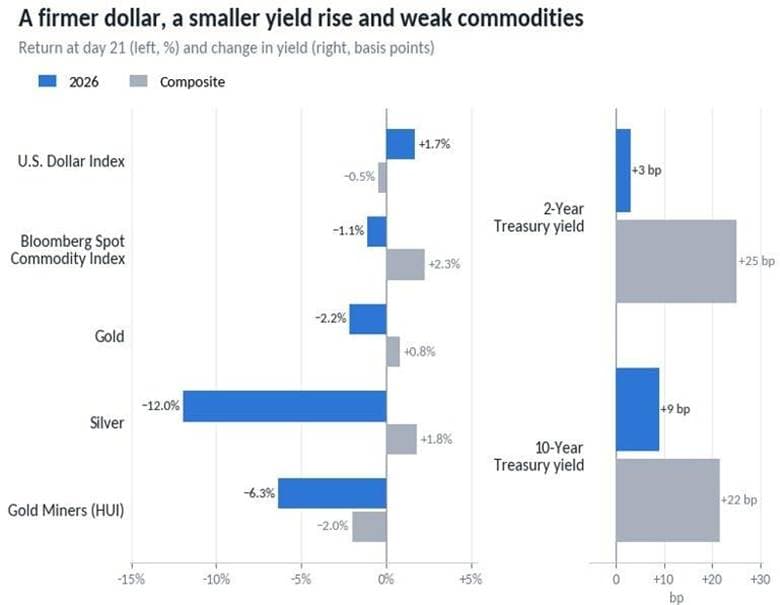
In contrast to historical trends, the dollar has rallied 1.7% in the first month after the rate hike, versus an average decline of 0.5% in prior instances. The firmer dollar has created a headwind for commodities, particularly metals, with all groups underperforming their respective historical composites.
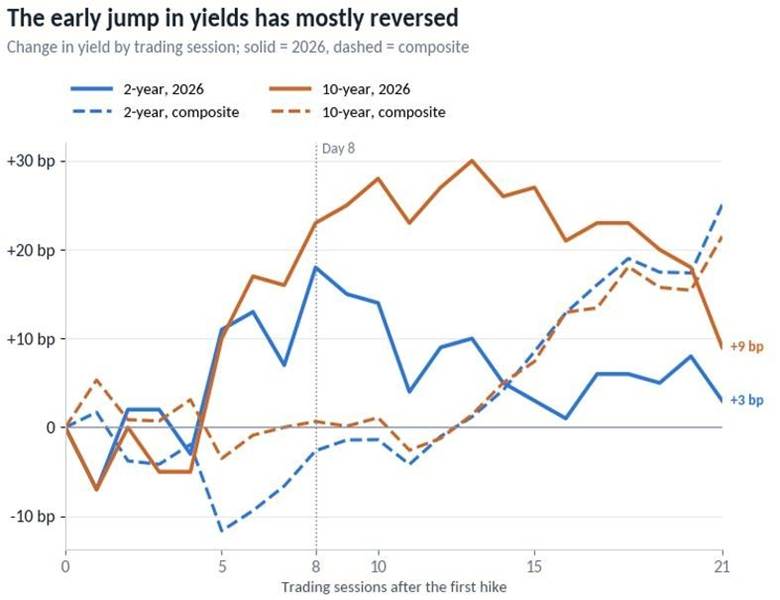
In the first few weeks, 2- and 10-year Treasury yields traded well above their respective composites, putting significant pressure on interest rate-sensitive sectors. Since then, yields have reversed lower, allowing these beaten-down stocks to recover.
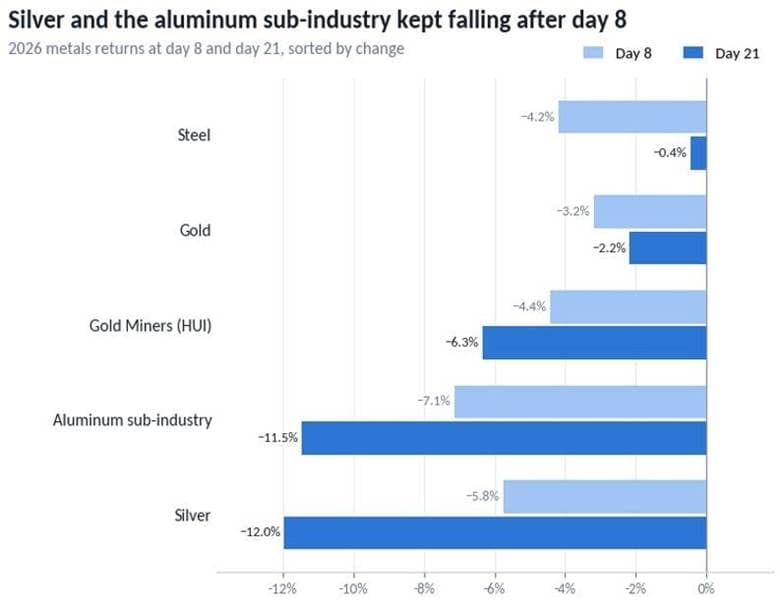
Easing yields have lifted interest rate-sensitive stocks, but that relief hasn’t extended to the metals complex. Since day eight, gold miners, silver futures, and the aluminum sub-industry have suffered additional losses through the one-month mark. Gold and steel have bucked that trend, recovering modestly but remaining negative.
Blowoff tops continue to track history
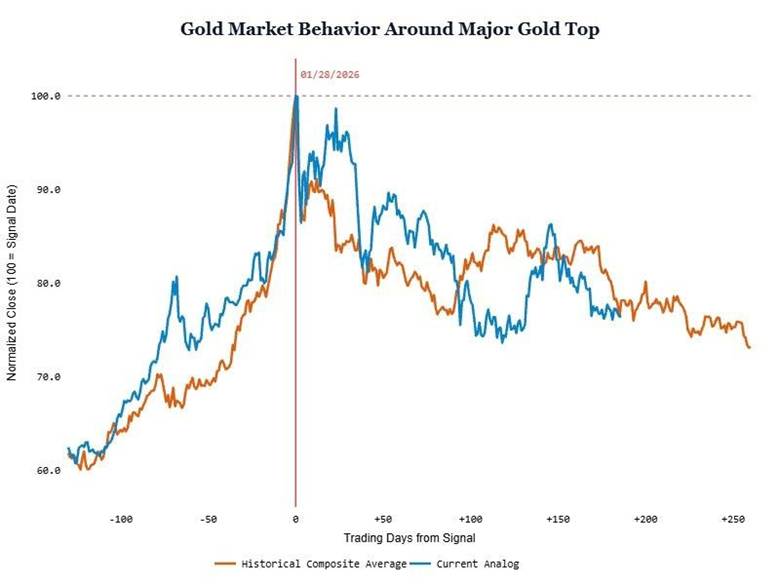
Gold has fallen 2.2% in the first month following the rate hike as the dollar has strengthened. Meanwhile, the metal continues to track the blowoff-top analog, comparing the January 2026 peak with a historical composite, suggesting further downside may lie ahead before a durable bottom forms.
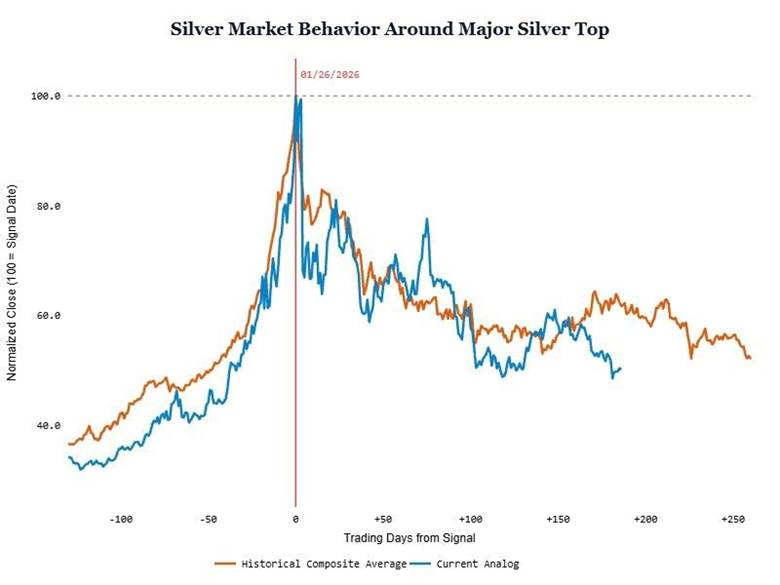
Silver has fallen 12% since the first rate hike, significantly underperforming the historical composite’s average 1.8% gain over the first month.
For both gold and silver, the departure from Fed rate hike norms likely reflects the unwinding of blowoff tops, exacerbated by a firmer dollar.
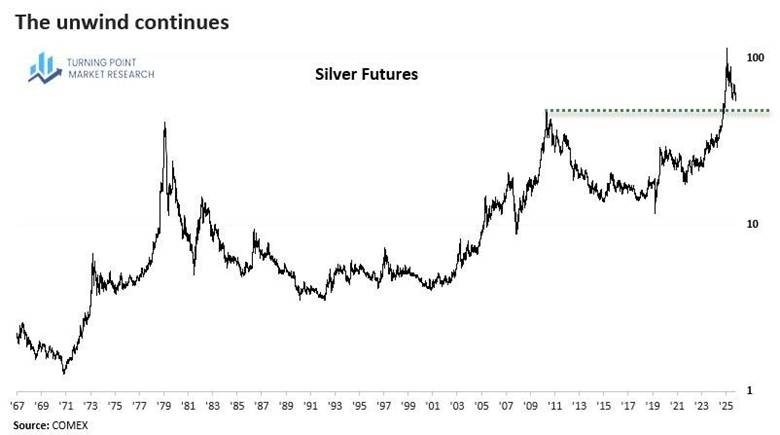
Silver is testing a critical support level near its July low. Should this level fail, the precious metal could decline toward the 2011 breakout point near $47.50, marked by the green line on the chart.
What I’m watching
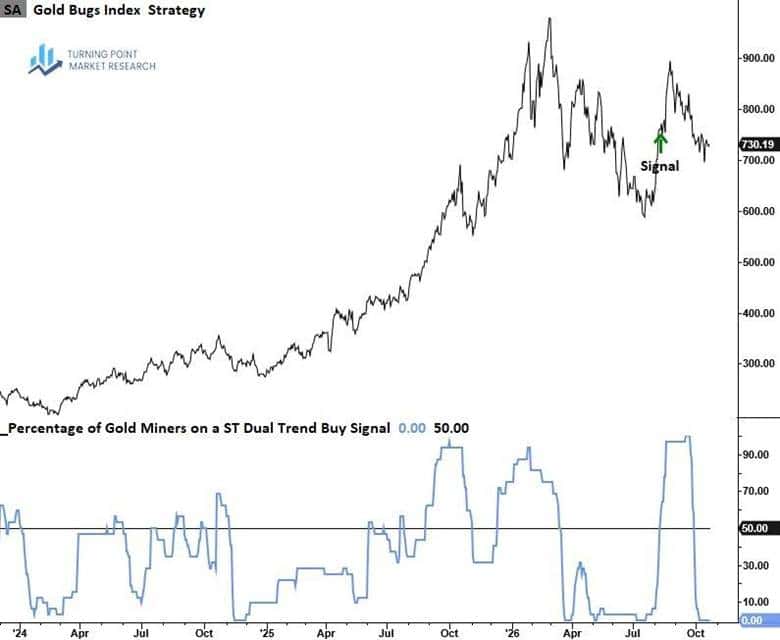
The percentage of gold mining stocks on a short-term dual trend buy signal remains at 0%. Although the last signal ultimately whipsawed, it still produced an initial maximum gain of 17%. The indicator has a strong historical track record, suggesting that when gold miners establish a bottom and reverse higher, another signal could offer a compelling opportunity to act. For now, patience is warranted.
Weakness across the complex
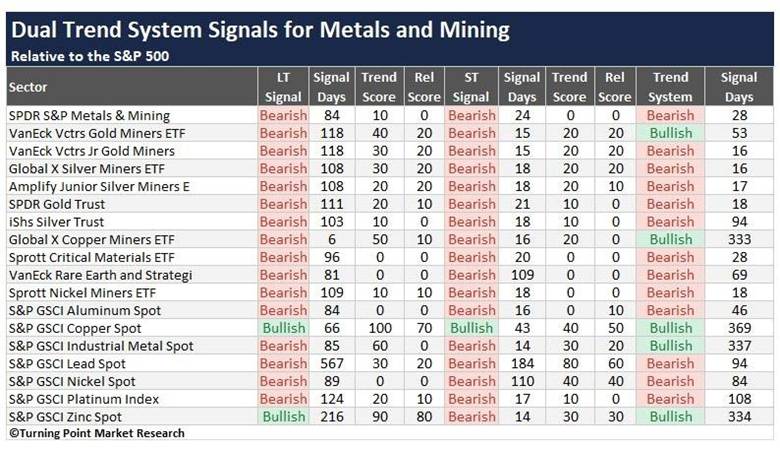
Trend and relative strength remain broadly unfavorable across the metals complex, with copper standing apart. The question is how long that divergence can persist while other commodities and mining stocks send a much weaker message. Copper’s structural demand tailwinds from data center expansion and electrification remain firmly in place. Still, the recent deterioration in AI-related stocks raises the possibility that copper could eventually catch down.
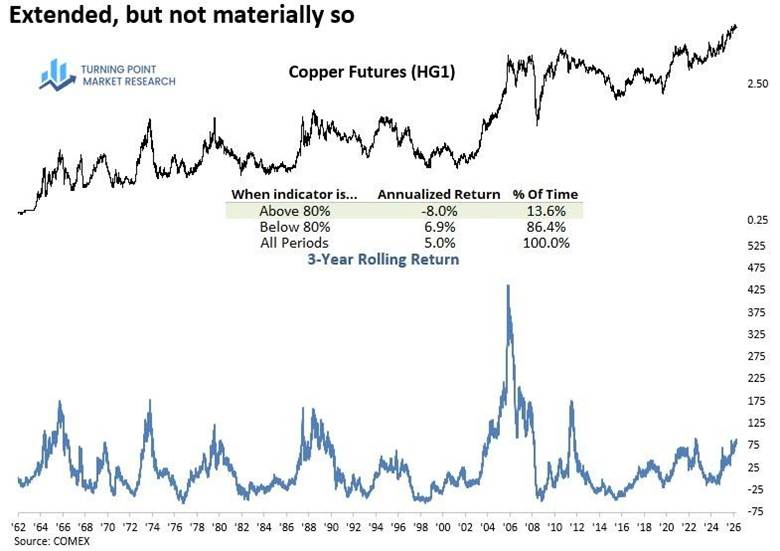
Copper futures have rallied 80% over the past three years. While substantial, that advance falls short of the gains seen in other instances that marked major tops. However, this rally began from a historically high base near $3.50, unlike most prior cases, which started below $1. Even so, three-year gains exceeding 80% have historically been followed by negative annualized returns.
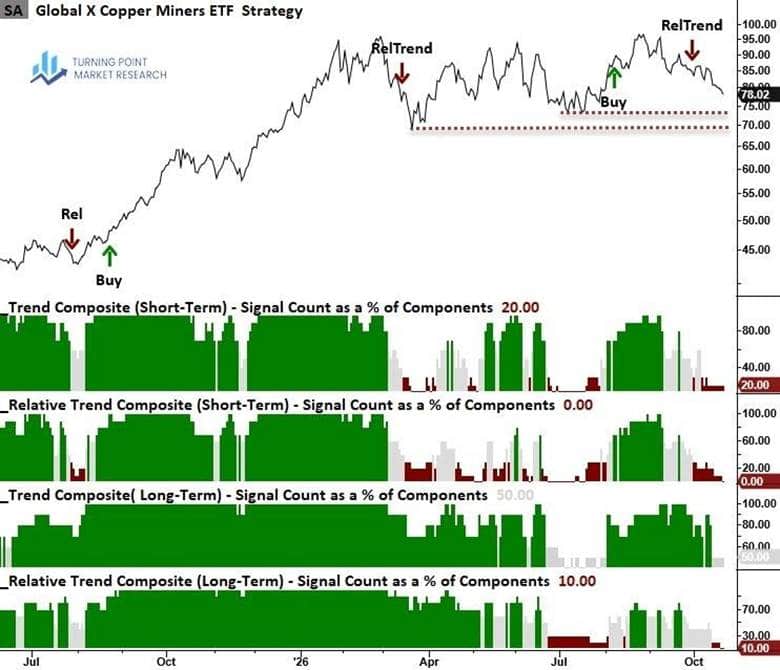
Both the short- and long-term dual trend systems remain on sell signals for the copper miners ETF (COPX). A potential double top is taking shape, but a break below the March low near $69 would confirm the pattern.
What the research tells us…
The metals complex is deteriorating, with copper as a notable exception. Precious metals remain under pressure following their blowoff tops, while a firmer dollar following the Fed rate hike has compounded the decline. Industrial metals and miners present a more puzzling picture. Data center expansion, reshoring, and a healthy economy should theoretically support demand, yet they remain under pressure. Regardless of the underlying reasons, price action is sending a clear message. Until trends improve, industrial and precious metals and their associated stocks remain areas to avoid, and even copper and copper miners may not escape a broader correction.