Key points:
- The NYSE Titanic Syndrome triggered a new signal
- With the new alert, the TCTM Risk-Off composite rose to five warnings
- A convertible bond system shifted to a risk-off status
- Midterm election-year seasonal lows precede strong stock returns
Risks continue to mount, running counter to a strong seasonal period ahead
Market conditions continue to deteriorate, with several indicators pointing toward an increasingly unfavorable risk-reward profile.
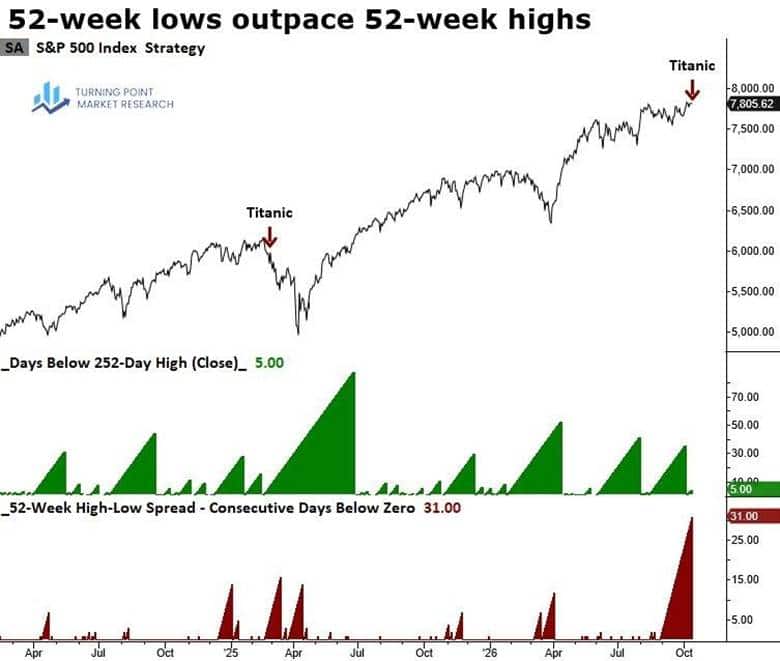
The Titanic Syndrome triggered Tuesday, making it the fifth active TCTM Risk-Off component. This warning occurs when NYSE 52-week lows outnumber 52-week highs for five consecutive sessions within seven sessions of a multi-year high.
Although the model focuses on the period immediately following a high, the spread between highs and lows has been negative for 31 consecutive sessions—a pattern that rarely occurs outside of significant corrections and bear markets.
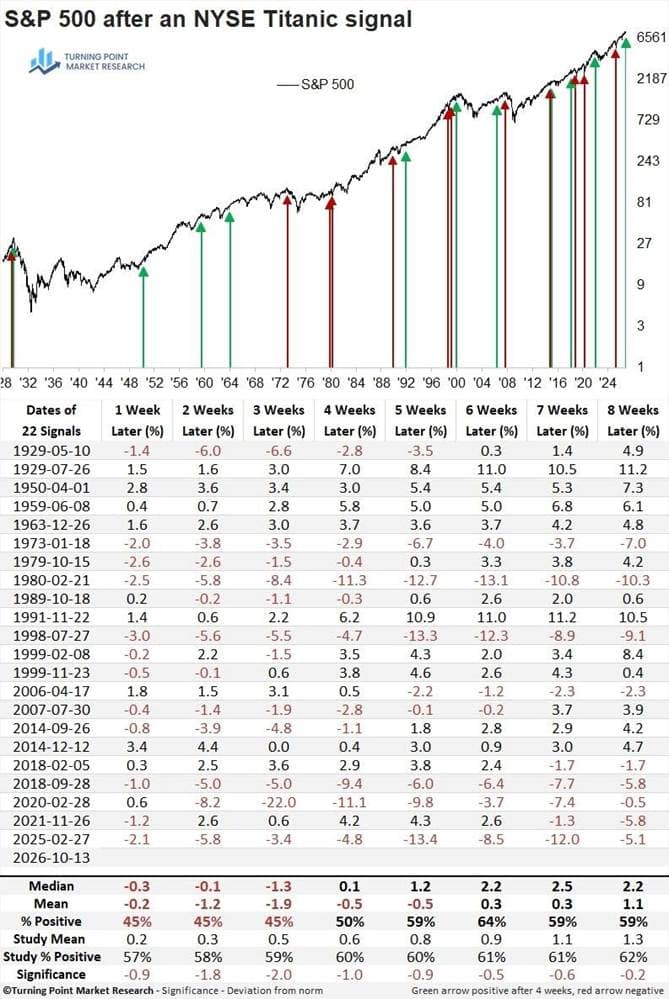
Following Titanic signals, the S&P 500 historically faced a weak outlook over the next few months, particularly during the first three weeks.
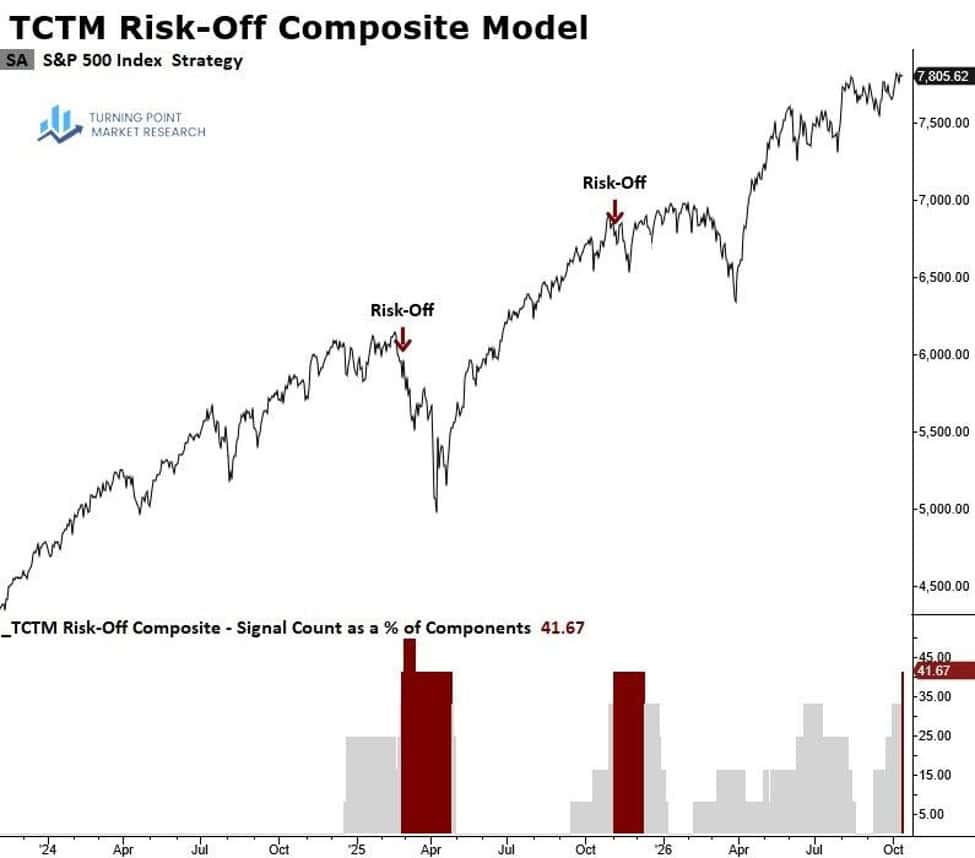
With five warnings now active, the TCTM Risk-Off composite has reached its signal threshold. The model will trigger an alert if the S&P 500’s five-day rate of change falls below -1%, which could happen today.
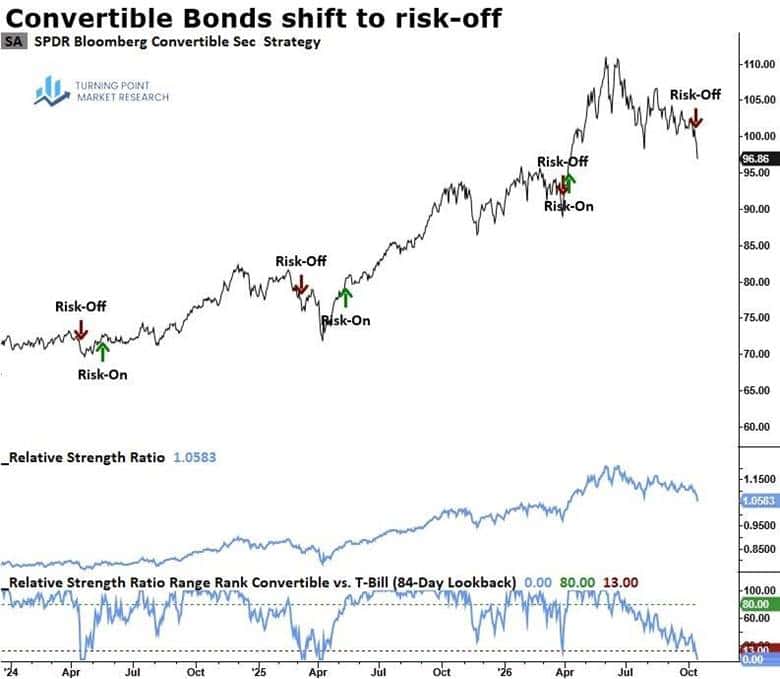
Adding to the deteriorating backdrop, a convertible bond system, highlighted in the August webinar, has shifted to risk-off. Given the Bloomberg Convertible Bond ETF’s heavy technology weighting, this signal warrants attention. The model also turned risk-off in November 2021, about a month before the S&P 500 topped out and tech stocks led the downside in 2022.
Mid-term election year comparison
Last week, I shared a seasonality study comparing 2026 with a composite of historical years following the seasonal low in October. The analysis covered several indicators, including price momentum, interest rates and Fed policy, market breadth, sentiment, inflation, and economic surveys.
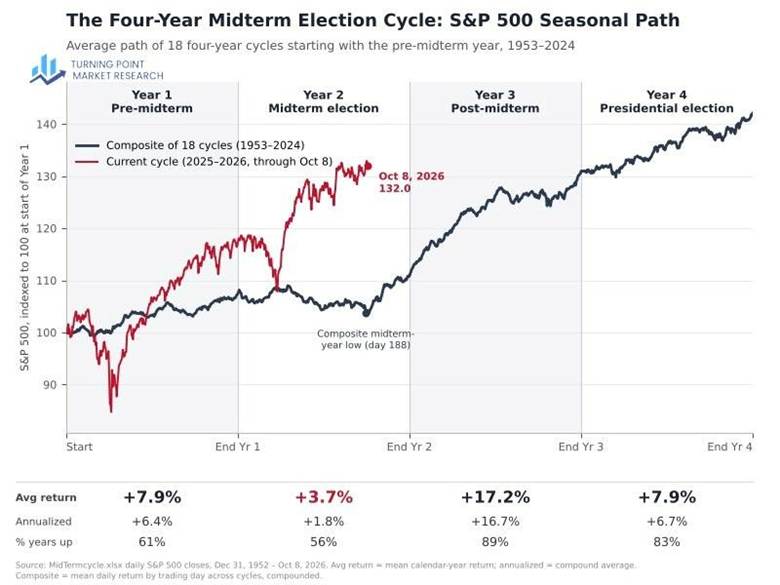
Given the strong seasonal tailwind that typically follows midterm election years, I wanted to conduct a similar analysis comparing 2026 with a historical composite dating back to 1953.
Midterm election years are historically the weakest in the four-year election cycle, with the S&P 500 averaging just 3.7%. However, the following post-midterm year is typically the strongest, delivering an average return of 17.2%. In 2026, the market has deviated from the usual pattern, rallying during what is historically the year’s weakest stretch, from day 73 through day 188, the seasonal low.
The question now is whether the market has any gas left for a year-end rally.
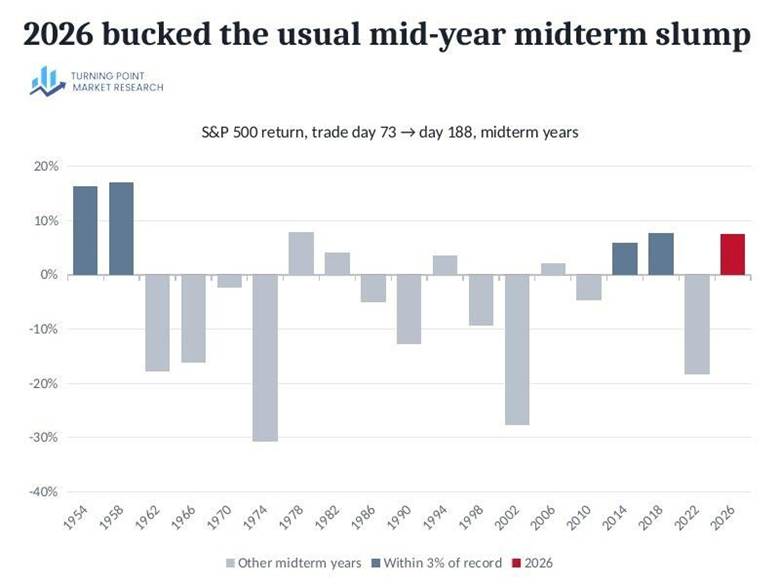
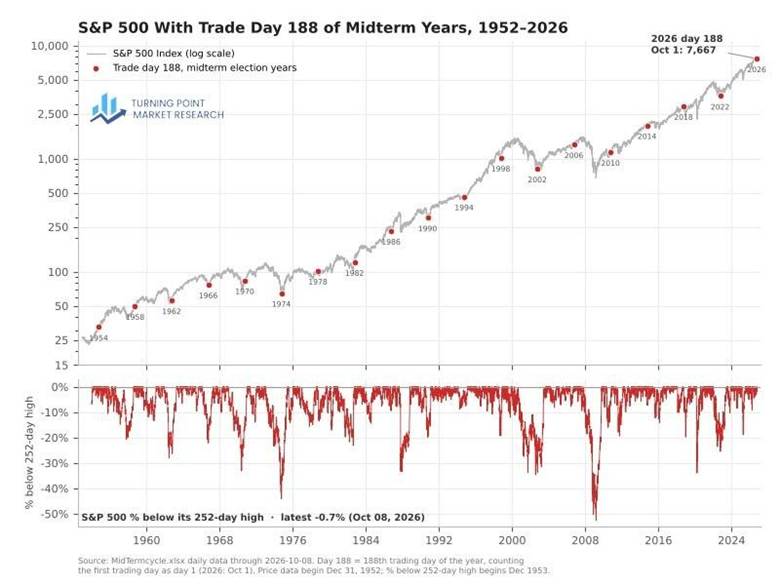
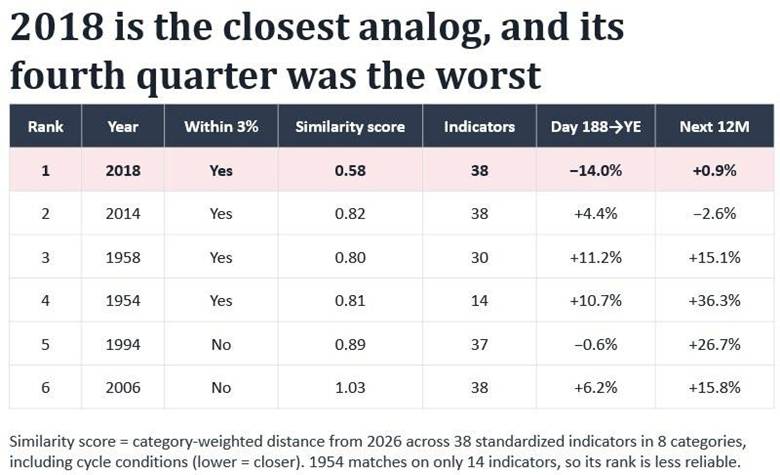
The average midterm year declined 4.5% from mid-April (Day 73) to early October (Day 188), with just 44% of years posting gains. At +7.6%, 2026 ranks fifth among 19 years, trailing only 1958, 1954, 1978, and 2018. Of those years, the 2018 comparison is especially noteworthy: the S&P 500 peaked in early October amid weak breadth before suffering a brutal fourth-quarter correction.
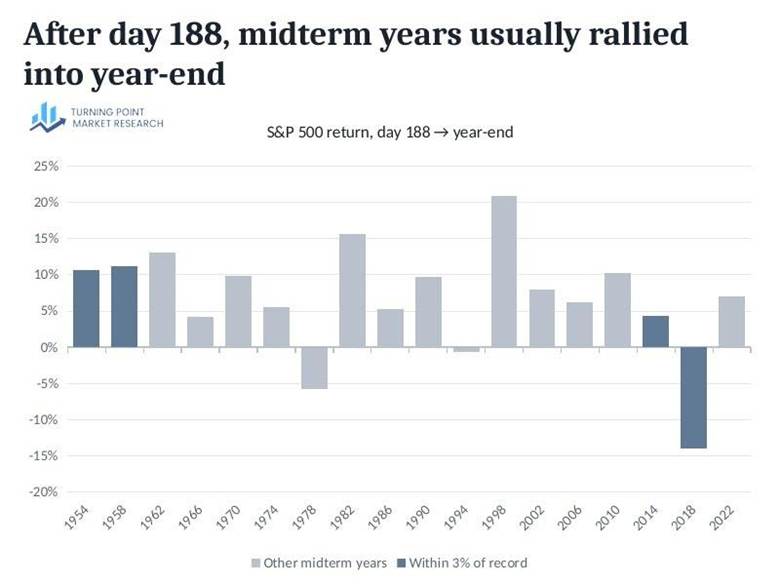
Historically, the period from the seasonal low on trading day 188 through year-end has favored the bulls. Only three years—1978, 1994, and 2018—produced negative returns, with 2018 being the clear outlier.
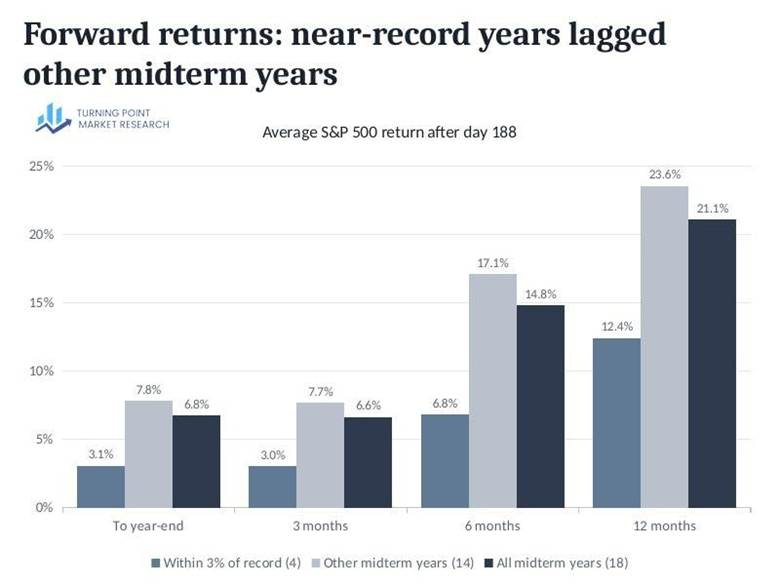
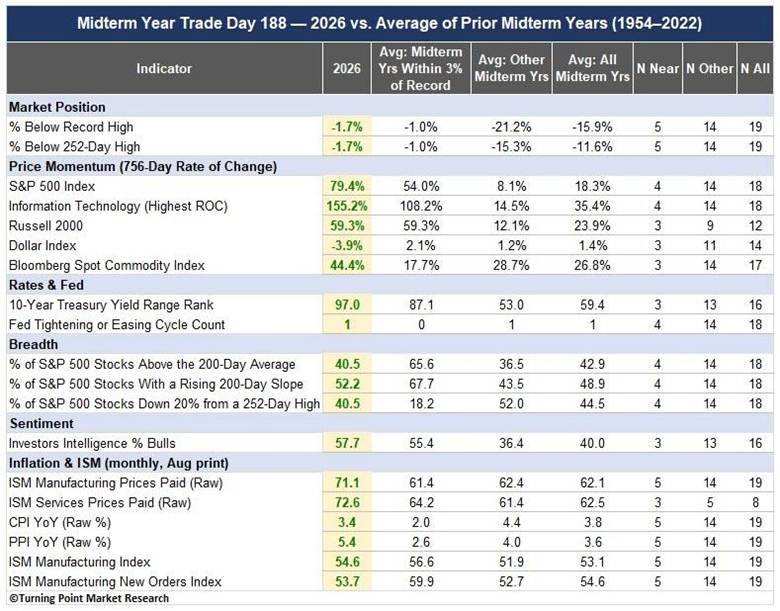
However, breaking out the return profiles paints a less encouraging picture. Instances occurring near record highs underperformed those from other years across every time frame and experienced a much larger average maximum drawdown over the following three months: -6.9% versus -3.0%.
Important context
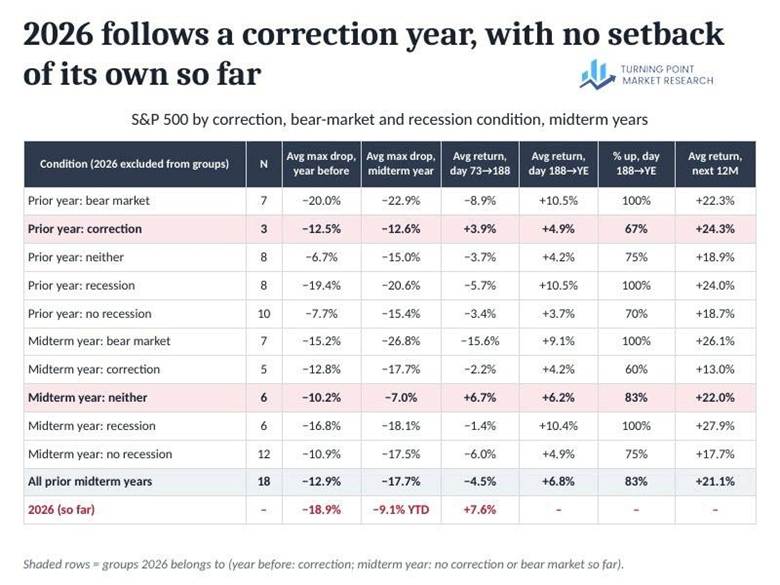
As the chart below shows, the seasonal low in midterm election years often coincided with a major correction or bear market. Consequently, forward returns in Year 3 were exceptionally strong as stocks recovered from deeply depressed levels.
In 10 of the 18 prior cases, the S&P 500 was either in a bear market (7) or a major correction (3) during the year leading up to the midterm elections. Eight of those years also coincided with a recession. The subsequent recovery from these depressed levels contributed significantly to the strong returns over the following 12 months.
As in last week’s seasonality analysis, price momentum, yields, sentiment, inflation, and market breadth diverge significantly from historical conditions at the midterm election-year seasonal low. This makes 2026 an outlier and raises the risk that forward returns will be less robust than historical averages suggest.
A similarity score based on 38 standardized indicators across eight categories identified 2018 as the closest historical match to current conditions.
What the research tells us…
A new TCTM Risk-Off component triggered an alert, raising the total warning count to five—the signal threshold. The only remaining requirement is negative short-term price momentum in the S&P 500, which today’s market action makes increasingly likely. Adding to the deteriorating backdrop, a convertible bond system shifted to risk-off. This is particularly relevant given the Bloomberg Convertible Bond ETF’s heavy weighting toward technology stocks, a sector that has begun to roll over, with signs of potential distribution in certain areas. If technology continues to deteriorate, the prospects for a meaningful year-end rally diminish considerably. The challenge is compounded by a market backdrop at the midterm election-year seasonal low that bears little resemblance to historical norms. Absent a broad-based, meaningful oversold condition, relying on seasonality to deliver a year-end rally looks increasingly questionable. Risks are rising. Manage risk accordingly.