Steve is a meteorologist. He spent some time on our team at Macro Ops a few years ago before getting recruited away to SpaceX, where he now works on the weather side of launch operations — the group that makes the go/no-go call when there’s hazardous weather sitting over the pad. He’s my go-to whenever I need a sober highly informed take on anything weather related.
I asked him to walk me through the “Super” El Niño that’s currently developing in the Pacific, and what it means for markets and beyond. He built a deck for it. What follows is that conversation, condensed and edited, with his slides inserted where they belong (you can find his full slide deck here.
The short version: all fourteen seasonal forecast models now converge on a peak Niño 3.4 anomaly near 4.0°C. The standing record — 2015-16 — was 2.75°C. Roughly ninety percent of ensemble members come in above that record. The only historical analog that competes is 1877-78, an event that killed an estimated three to four percent of the global population through famine. Steve’s framing is that the atmosphere is about to release something like a decade’s worth of accumulated heat in six to eight months, and that the commodity complex has only begun to price this in.
Make of that what you will.
The Mechanics: What El Niño Actually Is
Alex: So walk us through this thing. How bad is it going to be? Should we all be stocking beans, bullets, and building bunkers?
Steve: Not yet. But it’s going to be a doozy.
The thing people miss about these events is that they don’t play out only over the window in which they peak. They have a long tail. The atmosphere is permanently trying to restore an equilibrium it’s never going to reach — there’s uneven heating across land, ocean, and terrain, and the system is constantly transporting air from the equator, where it’s warm, toward the poles, where it’s cold.
If you concentrate a lot more heat into a region, you get a more violent response. And when that heat is spread across a domain the size of the Pacific — remember the Earth is roughly thirty percent land, seventy percent water, and water has a far higher heat capacity than the atmosphere — that energy has to go somewhere. The atmosphere disperses it in a semi-chaotic way.
Alex: Start me at the beginning. I cite El Niño constantly and I still couldn’t reliably tell you the difference between that and La Niña, other than I know one is better for my skiing season.
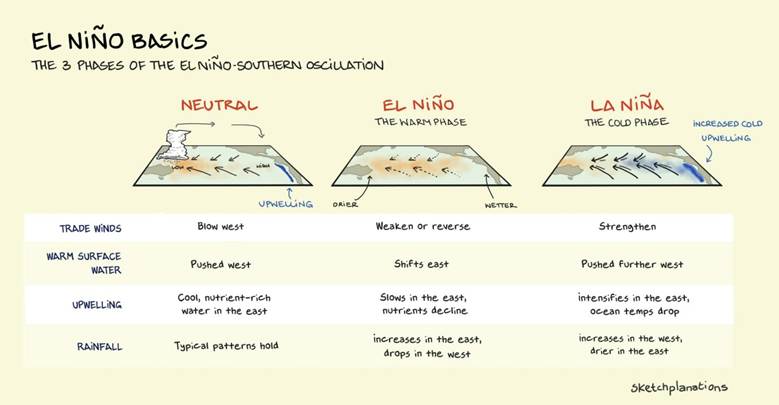
Steve: Ha — fair enough, and you’re not wrong. So the whole system concentrates in the Pacific around the equator, and it really comes down to two things: the trade winds, and what those winds do to the warm water sitting at the surface. The trades are the same phenomenon you get in the Caribbean. In the Pacific they blow east to west.
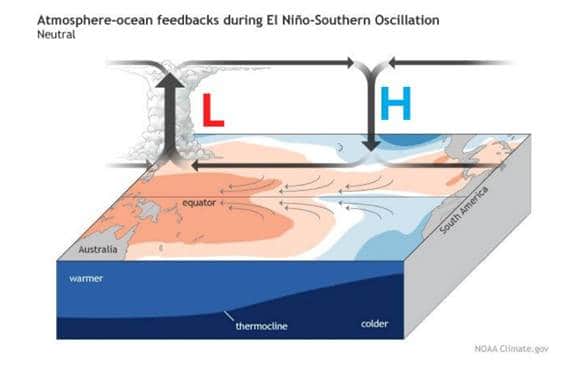
Start with the neutral state. The trade winds blow west and push warm surface water west along the equator. Because you’re moving mass on the surface, conservation requires you replace it, and the way the ocean does that is by drawing colder subsurface water up along the western coast of South America. That’s upwelling. In the neutral state you also get heavy convection and thunderstorms around Indonesia. Everything behaves.
El Niño is what happens when those trade winds weaken — and they can occasionally reverse. The warm surface water that normally piles up around Indonesia and Micronesia is no longer being held there, so it slides back east. Think of it like a spring: remove the force and the system relaxes. All those red anomalies you see on the maps are the product of essentially no trade winds. That’s what we’re observing right now.
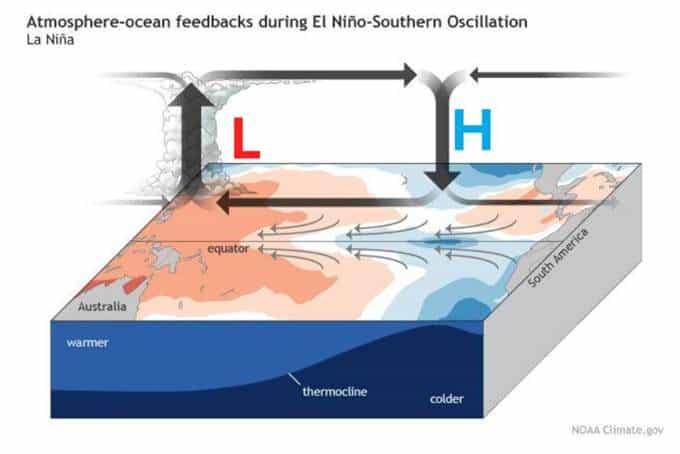
La Niña is the inverse. The trades strengthen, they push even more surface water east to west, upwelling intensifies, and you get a much colder eastern Pacific off South America.
Kelvin Waves and the Energy Problem
Steve: The three-dimensional view makes this clearer. Start again with the neutral state — you can see the trade wind arrows and the warm pool sitting near Indonesia and Micronesia, with the thermocline riding relatively high in the eastern Pacific.
Now look at the El Niño panel and notice there are barely any arrows — the winds have collapsed. And you’ve got something called a Kelvin wave. They’re not really waves in the way you’d picture; think of them as blobs of warmer water propagating west to east along the equator at maybe ten miles an hour, triggered by shifts in wind stress.
What they do is suppress the thermocline — that’s the sharp subsurface boundary between warmer and colder water, normally sitting around 20°C. When the thermocline gets pushed down, you get the red and pink you see on that subsurface cross-section on the right.
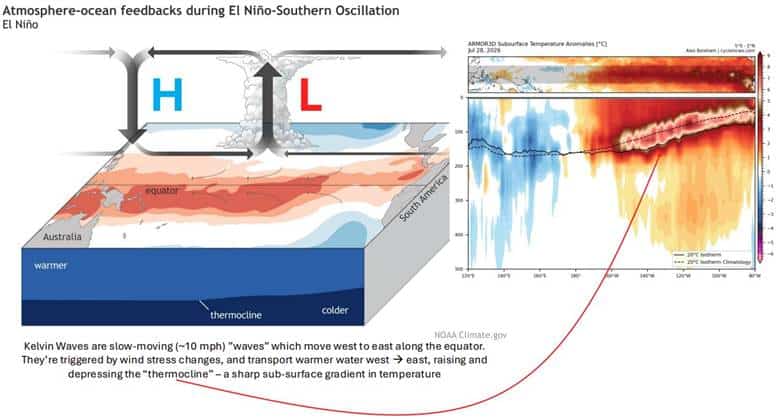
That’s a five to eight or nine degree Celsius anomaly. Which doesn’t sound like much until you integrate that energy over roughly two-thirds of the Pacific Ocean. I don’t have a precise figure, but it’s plausibly upward of a million times the total energy released at Hiroshima. It’s an insane amount of energy, and it has to go somewhere.
What it does first is drive enormous convection roughly halfway between Indonesia and South America. That’s why the Pacific is having the hurricane season it’s having — Hawaii just took a direct hit, and that essentially only happens in El Niño years, because the environment is conducive to it. The atmosphere needs to move heat from the equator to the poles, and a hurricane is an extremely effective way to do that.
And the La Niña panel is the mirror image: the trade winds really intensify, the cold upwelling kicks back in off South America, and all that convection gets forced west toward Indonesia.
Alex: That’s the part I find genuinely fascinating — the energy has to go somewhere. I can see why you’d be drawn to markets. Same class of system: dynamic, nonlinear, highly path-dependent. Change one input at the front end and you get a completely different outcome downstream.
Steve: Exactly — and neither system ever actually reaches equilibrium. It just keeps hunting for it, and the hunt is where all the interesting behavior lives.
A History of Super Niños
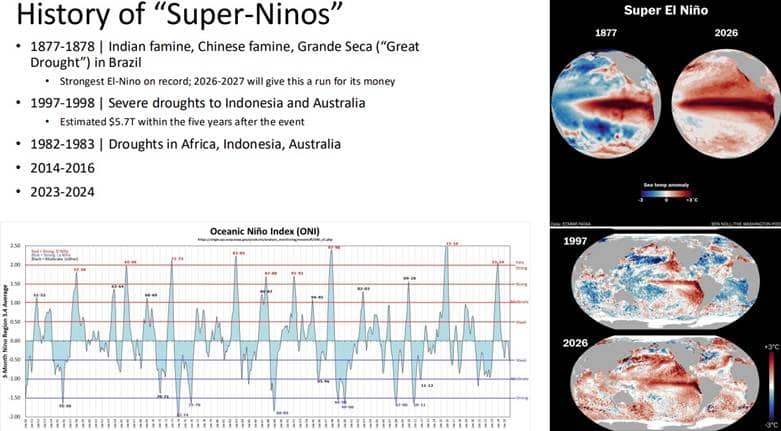
Steve: Look at that ONI chart at the bottom. It oscillates like something you’d pull off a price screen.
To put it in market terms: your buy stop sits above the highs of the prior Super Niños — where a Super Niño is anything with a Niño 3.4 anomaly above roughly 2.0 to 2.5°C.
There are five that matter in the modern era. The largest reliably recorded event was 1877-78. It produced famines in India and China and the Grande Seca — the Great Drought — in Brazil. That’s the one to beat.
And look at the two globes on the top right: 1877 versus 2026. You don’t need a meteorologist to see that there’s considerably more red in 2026 than there was in 1877.
Alex: That’s a lot of red, man
Steve: Here’s the thing — you’re dealing with two effects stacked on each other. There’s the El Niño itself. But you’re also starting from a materially higher base of sea surface temperatures everywhere. So the event is bigger than the anomaly alone implies. There’s simply more energy in the system than there was thirty years ago in the ’97-98 background state.
For additional context: 1997-98 brought severe drought to Indonesia and Australia and carried an estimated $5.7 trillion in economic cost over the five years following the event. 1982-83 hit Africa, Indonesia, and Australia. Then 2014-16 and 2023-24.
Alex: How do we even have data on 1877? Is that reconstructed from records, or is there a geological method — tree rings, something like that?
Steve: All of the above, and people considerably smarter than me have done the reconstruction. Some of it comes from observational anomalies — fish catch data, for instance. Ships took water temperature observations constantly and logged them, alongside a lot of other contemporaneous records.
But the more powerful tool is this: you can take the same equations a weather model runs forward in time and run them backward, feeding those historical observations in as you go. Give a climate model that information and it will work backward from present conditions to tell you what conditions must have been. That’s called reanalysis.
The Forecast: 4°C and the Fat Tail
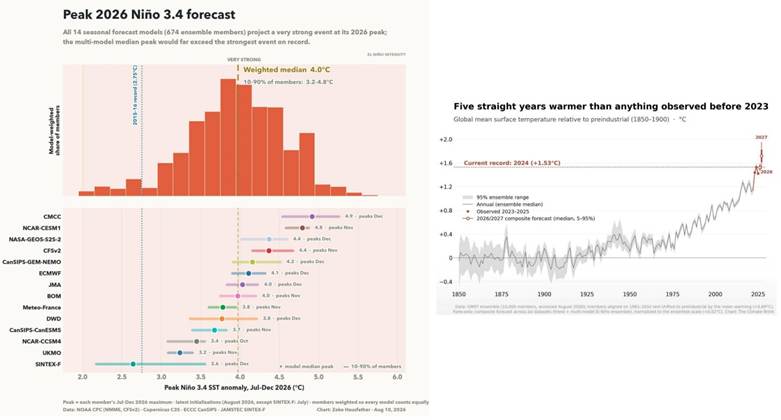
Steve: Look at the blue dotted line marked 2015-16. That was the record. It was 2.75°C.
Every model now centers on a peak anomaly around 4.0°C. The weighted median is 4.0. The 10th-to-90th percentile band across members runs 3.2 to 4.8. That means roughly ninety percent of ensemble members are more extreme than a record set ten years ago.
And people handle this the same way they handle exponential math in markets — badly. The tails shift and nobody updates.
Take Bordeaux. They’ve had 40°C heat for five consecutive days. On a stationary climate that’s something like a one-in-84,000-year event. That is not independent random chance.
You don’t get an El Niño of this magnitude and separately get Bordeaux. It’s all correlated. There’s just far more heat in the system than there was even a few years ago.
The right-hand chart is the one I’d sit with. Climate scientists are saying that over the next six to eight months this event will release into the atmosphere something on the order of what would normally take ten years. You’re not changing the direction of the process — you’re accelerating it. Ten times. Maybe fifteen.
Alex: That’s very hard to internalize, because nobody alive has experienced what’s coming. You’d have to go back to 1877 for the analog — and we may end up above that in severity.
Steve: It’s looking fairly likely you’re at or above it. Which brings us to the real question: okay — so what actually happens?
Where the Rain Doesn’t Fall
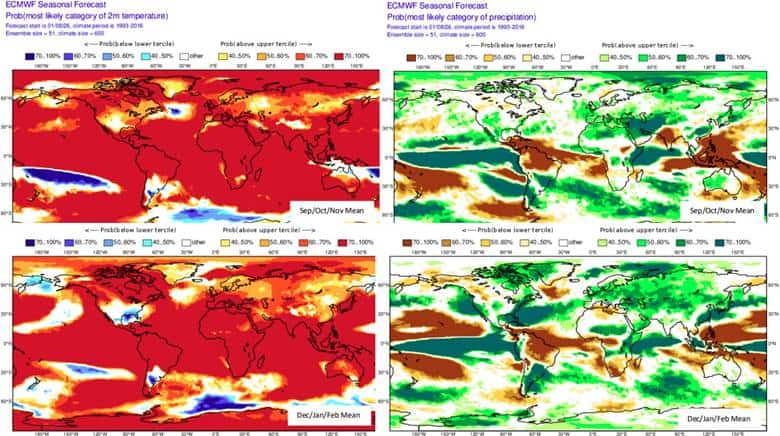
Steve: That’s essentially the entire globe in red.
Top left is the probability of exceeding normal temperatures across September, October, November. Bottom left is the same for December, January, February. It’s a wall of red.
The right-hand panels are the precipitation anomalies, and this is where the trade sits. The pattern is: north of the El Niño signal, very wet. South of it, very dry. The Caribbean, dry. The coffee-growing regions of Brazil, dry. Indonesia, dry — and the model is exceptionally confident about that one. If you want to talk drought impact on coffee, that continues.
Alex: Looking at the drought map, the hardest-hit regions are northern South America — Brazil, Colombia — and Central America, which is where I am. That tracks with what I’m hearing on the ground. We moved to the southern zone of Costa Rica two weeks ago, into what is nominally rainy season, and every local I’ve spoken to says it’s the driest wet season they’ve seen in twenty or thirty years, at least.
Steve: Same story in Puerto Rico — they have a serious drought running. It’s the entire Caribbean, not just you. If you believe the model you get some relief this winter, but the drought conditions persist.
That’s the part to understand about the tail. Once these patterns set up in the atmosphere they behave like a train. It takes an enormous amount of energy to reverse them. This event is going to carry incredible inertia and it is going to take time to wind down.
The Commodity Map
Alex: Give me the sector-by-sector.
Steve: The models are our best guess, but this is an extraordinary event, so the atmosphere may throw chaos at us that isn’t in the ensemble. With that caveat:
Sugar and rice. The Indian monsoon is already running weaker than normal. That drought in the sugar and rice regions continues, because there’s an enormous amount of inertia in the pattern and it isn’t slowing down anytime soon.
Citrus. I could see US citrus futures spiking this winter. The atmosphere is going to try violently to disperse heat, and you don’t need a full polar vortex event to do damage in Florida — a sharp trough will do it. A brief but severe hard freeze is very much on the table.
Cocoa. There’s a persistent wind event in West Africa where cocoa is grown called the Harmattan. It carries sand off the Sahara, coats the plants, and destroys production. It’s already ongoing. It was bad during the 2014-16 El Niño. I expect this one to be the same or worse.
Coffee. The market is slowly adjusting to this, but if there’s any strength in the coffee chart, El Niño only propels prices higher. I don’t see a mechanism by which this event makes coffee cheaper.
Alex: That maps almost exactly onto what came out of our investment portfolio meeting this morning. Coffee, cocoa, corn, sugar — the whole ag complex is starting to wake up. Positioning is still offsides because the market hasn’t fully processed it, but price is beginning to move, especially in the later-dated contracts. The wisdom of the crowd is creeping in.
What strikes me is how this gets covered. I follow Hackett and a few other ag services, and a few of them have been pointing at this for the past few months — but they talk about everything in hyperbolic terms, every year. So the natural reaction is to become dismissive. And underneath that is the deeper problem, which is that we’re structurally bad at pricing step-function changes to reality. A seasonal weather event that dominoes through the entire global economy doesn’t fit the way most people forecast.
Steve: That’s exactly the failure mode, and it cuts both ways. People don’t handle exponential math or shifting tails well in markets, and the same thing happens here — the forecast community cries wolf for years, so when the genuine tail event arrives, nobody’s leaning into it.
The difference this time is that this isn’t one newsletter’s read. It’s fourteen independent seasonal models and nearly seven hundred ensemble members all pointing at the same number. When the ensemble converges like that, dismissiveness stops being skepticism and starts being a position.
The La Niña Handoff
Steve: El Niño peaks in late fall or early winter. What goes up must come down, and the down is La Niña. We have six to eight more months of El Niño to run.
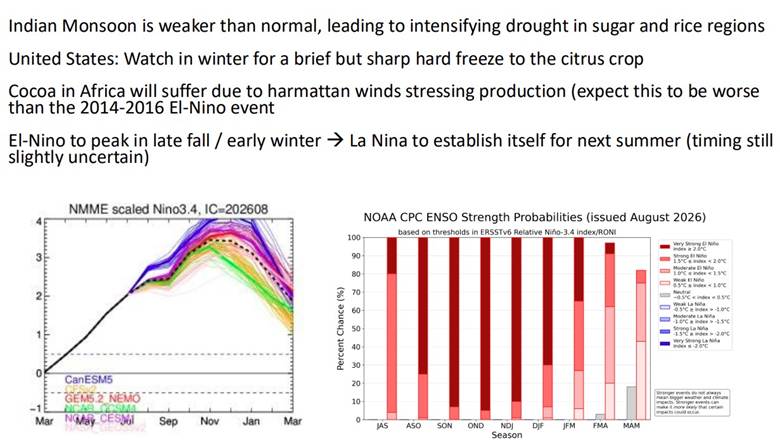
The timing on La Niña establishing itself is uncertain, but it looks like next summer. What we don’t know is the amplitude. An extreme El Niño does not automatically produce an extreme La Niña — the system may take a few years to disperse the heat this event put into it. It could be just as extreme. It isn’t currently forecast that way. But that remains to be seen.
The strength probability chart on the right (chart above) has about ninety-five percent of members above 2°C. So call it a ninety-five percent chance this is a Super Niño and stays at that intensity through at least the early part of next year.
Alex: What actually determines whether it swings into a super La Niña versus something milder?
Steve: Honestly, we don’t fully know. The working understanding is that it comes down to rapid shifts in wind stress at the ocean-atmosphere boundary. If you get rapidly shifting winds, the ocean has to respond — it has no choice, because the wind is physically relocating surface water.
But there’s no single identifiable trigger. It’s persistent patterns of convection working their way across the Pacific and the Micronesia region. It’s a chicken-and-egg problem.
The Economic Tail
Alex: I should go back and study 1877 properly, just to get my head around the magnitude — though obviously the world is a very different place and this will be a different event.
Steve: I was reading on this earlier. Roughly three to four percent of the global population died in that event. Due to famine. That’s about fifty million people then, or 290 million people today.
I had the same instinct you did — that’s 150 years of difference in infrastructure and institutions. But I could still see extreme drought. Florida’s had a very dry summer already. People have called 1877-78 arguably the worst environmental disaster ever to befall humanity. It sparked political movements.
Alex: Three to five percent of world population. That’s serious.
Steve: And look at the mechanism of the economic damage. The ’97-98 event carried an estimated $5.7 trillion cost within the five years after the event. It doesn’t hit all at once. It disperses. But it disperses in violent, persistent ways.
Alex: That matches the literature I was reading before we met. There are a couple of papers on the lagged economic impact — particularly in the countries that take the direct hit, Brazil and that region — where measured GDP is still detectably below counterfactual a decade out. In a globalized, tightly coupled economy, that reaches everyone in some form.
What to Watch
Alex: Last thing. For laymen — what’s the one data point to track to see whether this shifts in severity? And are there credible handles worth following?
Steve: I’ll send you a list of handles, and more usefully, a few government sites that publish weekly briefs. Those aren’t hobbyist products — the ag markets will likely move off the briefs those groups put out.
The thing I’d emphasize: when El Niño starts to cool, that does not mean the event is over. It means you’re coming down off a record-breaking event, and that energy still has to go somewhere. I could see the effects from this El Niño lasting longer than I currently forecast. In the charts, you’ll probably realize the convexity later than you expect to.
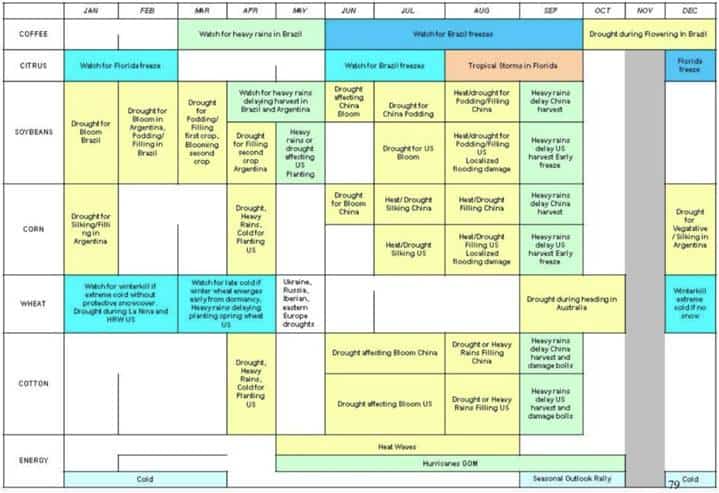
Steve: That last slide is the calendar. What to watch for, and when.
Alex: This gives me exactly the starting point I needed — I’m going to go deep on this one and game it out as far as it’ll go. Thanks for carving out the time, man. I know you’ve got rockets to launch. Hit me up if anything interesting comes down your way, or if something in the models shifts.
Steve: Will do — and the red flags are coming your way, of course. You can always hit me up too. Great talking to you, Alex.
Alex: Great talking, brother. Take care.
Recommended resources:
- Government releases – one to two week update frequency (link here)
- Track the progress of El-Nino here
In 2020, I laid out the secular bull case for AI and memory chips, pitching Micron specifically, in my report titled Underwriting The Future.
A central pillar of that piece was how markets tend to be efficient in the short-term and terribly inefficient over longer periods or when there are step-function changes to base reality. Here’s a snippet from that piece:
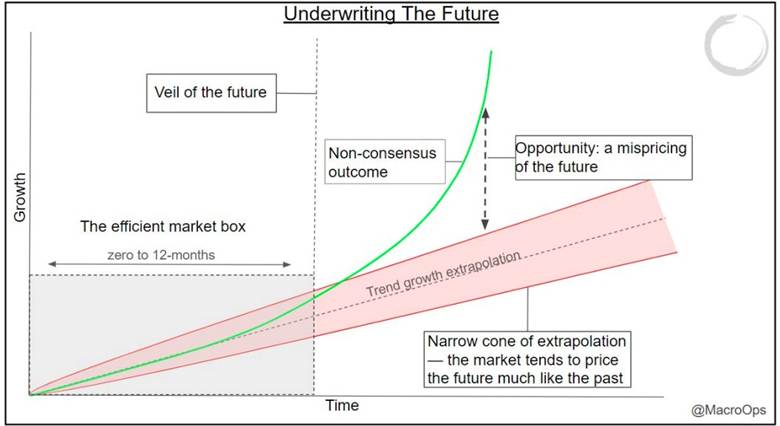
The market is hyper-efficient within the 0 to 12-month timeframe or what I call the efficient market box. Now, yes, of course, there are exceptions. Efficiency turns to silliness when reflexive processes loop us away from anything resembling a probable outcome. The majority of the time though these feedback loops abort before they can really get started.
Looking out past the veil of the future is where things get interesting. And that’s where we should do most of our thinking.
The market tends to simply extrapolate the present well into the future. Whatever the trajectory of growth, competitive advantages or disadvantages, addressable market size, etc… is today, largely comprises the expectations that are embedded in the price.
This mostly works which is why it’s so. Betting on trend continuation and mean reversion around that trend is statistically a good bet, whether we’re talking about actual market prices or fundamental trends.
Occasionally though, large mispricings occur. The market bets on future trend continuation but instead we see wildly divergent outcomes. Why is this?
Here are a few reasons…
- The market is slow to recognize competitive advantages as well as underappreciate its impact on future value creation
- The market tends to underweight the impact of secular macro shifts while overweighting cyclical ones
- The market is inefficient at pricing anything exponential
I wrote this piece with equities strictly in mind. But the concept applies across the board. If anything, it’s even more applicable to macro where large shocks and meaningful shifts occur more regularly, at larger and more complex scales.
Normalcy bias: the human tendency to assume that tomorrow will resemble today, even in the face of direct overwhelming evidence, is a real thing. Taleb calls this Black Swan blindness or “tunneling” which is in reference to our tendency to focus on narrow, legible sets of risks while excluding the less-modelable sources of uncertainty.
To put it simply… Most investors lack imagination.
And, to be fair, the vast majority of the time it pays to bet on trend continuation — that tomorrow will look much like today. That’s usually a good bet.
The extreme on the other side is to be a doomer. A brain damaged ZeroHedged zealot. That sees tail events everywhere and can’t stop screaming to everybody about it.
The skilled trader has to sit between these poles: participate in the market’s established tendencies, stay alert to evidence that the regime is changing, and use risk management to navigate the transition.
Okay, enough theory… What should we do with Steve’s information above?
Look, nobody knows exactly how bad this El Nino event will be, nor exactly how it will play out.
But we do know that the market’s tendency is to be slow in pricing these things in the lead up to the event, and then overreacts on the tailend.
My read is that the Narrative Pendulum on this development, is that we’re very much in the ealry innings of things.
Look at this monthly chart of BBG’s Ags sub-index chart. It’s breaking out of a major compression regime. This chart looks awfully similar to the BCOM Index compression breakout that we were banging the table on last year — and which we made a sizable return playing.
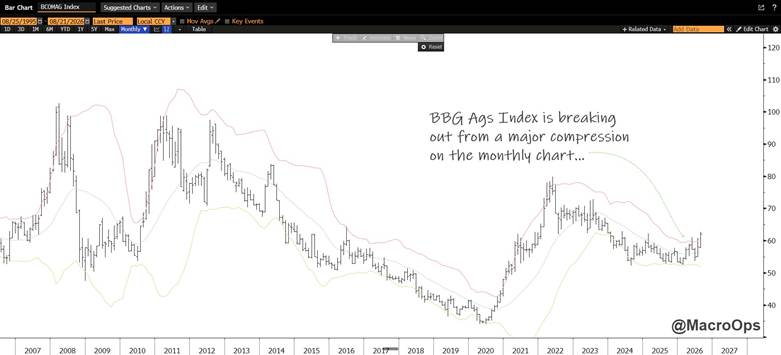
Ags tend to lag the other commodities in a commodity bull cycle. The sequence is typically precious metals to industrial metals to energy and then finally to ags.
So we were due for a proper broad-based bull leg in Ags already. Throw in a 200-year + seasonal weather tail event, and we have the makings for what could be meaningful, multi-asset trends.
We have initiated starter positions in several Ag futures and will add selectively through predefined buy stops. This is not a one-trade thesis; it is an emerging opportunity set spanning agriculture, FX, and equities.
LNG tankers, potash producers, and select Latin American currencies are among the areas we are examining. The key now is to map the transmission channels: which crops and regions are vulnerable, where inventory and pricing power are tight, which companies offer the cleanest exposure, and where consensus expectations remain too complacent.
El Niño may shape markets for the next six to nine months, with the possibility of a consequential La Niña phase afterward. The market is beginning to recognize that something is coming — but it still appears far from pricing the asymmetry.
Our job is not to predict every detail. It is to identify the skew early, express it with defined risk, and update aggressively as the evidence arrives.
So let’s apply our Collective intelligence to work mapping the second- and third-order effects before they become consensus.
Steve is a meteorologist working in launch operations and a former member of the Macro Ops team. Charts and slides are his. This transcript has been condensed and edited for clarity.
COPYRIGHT 2026 MACRO OPS RESEARCH & COLLECTIVE — ALL RIGHTS RESERVED // DO NOT DISTRIBUTE