“In chaos, the disciplined find calm. The rest drown in the noise.” ~ Navy Seal maxim
No plan survives first contact with the enemy, so the saying goes… I think some old Prussian military strategist first coined it, though some version of it has probably existed as long as organized warfare has been around.
The modern philosopher (and retired boxer) Tyson would say, “everybody has a plan until they get punched in the mouth.”
Both encapsulate the inherent truth that reality shreds spreadsheets…
Traders — at least successful ones — know this.
It’s been seared deep into their marrow, often through pained lived experience.
Highly kinetic environments such as firefights, boxing rings, and trade wars not only up the Clausewitz factor (fog of war), they also excite our amygdalas, making us more prone to over/under react, misread cues, and generally flub things up.
How do we, as traders, navigate these types of environments then?
We can find our answer (just fyi, I’m going to really overabuse the military analogies in this note) from the SEALs who are trained in the cognitive practice of: Soft Eyes and Front-Sight Focus.
Soft Eyes and Front-Sight Focus (I’ll explain what both these are in a bit) are their answer to the problem of Attentional Tunneling that tends to arise in fast-paced, high-stress, kinetic environments.
A quick story…
Captain Bob Loft, First Officer Albert Stockstill, and Flight Engineer Don Repo guided Eastern Airlines Flight 401-a Lockheed L-1011 TriStar, through the pitch-black skies above the Florida Everglades. The mood was calm as the crew prepared for a routine landing in Miami. Then, a single burnt-out bulb sparked catastrophe.
As the landing gear lowered, the nose gear’s green indicator light failed to illuminate. The crew circled at 2,000 feet, troubleshooting the minor issue. Repo manually inspected the gear mechanism below the cockpit while Loft and Stockstill debated whether the gear was truly faulty or if it was just a faulty bulb. Hyperfocused on the light, none noticed the autopilot’s altitude hold had disengaged when Loft accidentally nudged the yoke.
Unseen by the crew, the jet began a gradual descent of 300 feet per minute. A soft C-chord altitude alert sounded, but it drowned in the noise of their troubleshooting. Over the Everglades, with no city lights or terrain cues, the darkness masked their peril.
“We’re going to have to write this up,” Loft muttered, still fixated on the bulb.
At 11:42 PM, Stockstill finally glanced at the altimeter: 900 feet. “We’re still at 2,000, right?” he asked, voice tightening.
Too late.
The TriStar’s left wing clipped the swamp at 227 mph, shearing off engines and fuselage. Survivors described a “deafening crunch” as the jet disintegrated, killing 101 of 176 onboard. Investigators later found the landing gear fully functional — the bulb had simply failed.
Loft’s final words, captured on the black box, haunt training manuals: “Hey, what’s happening here?” — a stark reminder of how narrow focus, unchecked, can beget ruin.
This is attentional tunneling.
Okay, so back to the SEAL insight into how to recognize and counteract tunneling:
- “Soft Eyes” Technique: Expanding visual focus to include peripheral vision, which calms physiological stress responses and improves environmental awareness.
- Front-Sight Focus: Narrowing focus and reducing cognitive load by emphasizing prioritization of immediate tasks (e.g., neutralizing a threat).
Now, for Special Operators such as the SEALs, the Soft Eyes and Front-Sight Focus is literal. They consciously adjust their optical and cognitive focus depending on the environment and the objective — in Sniper school, we spent countless hours training our awareness in this way, until it became second nature.
When Operators are clearing a room, they go soft eyes as they sweep the area, remaining alert to any potential threats in their periphery.
When they’re engaging a target, they go front-sight focus, honing in on the most significant risk, while cognitively blocking out the environmental noise so they can access the flow state and eliminate the target.
A quick but interesting aside is that the SpecOps community, through experience, stumbled upon a nervous system hack that’s been known by yogis and mystics for ages.
The yogis call it nasagra drishti, where they place their thumbs outstretched in front of their eyes and move them side to side and up and down while tracking them with only their gaze, keeping their head still. The kahunas (meaning keeper of the secrets) of Hawaii had an identical practic,e which they called Haka.
Both served the same purpose, which is to broaden optic awareness. Expand one’s field of view from the narrow, where most people spend most of their day, to the broad.
What this does is that it flips something in our nervous system, causing us to downregulate into a parasympathetic response, which is a state of rest and recuperation.
This then allowed for deeper meditative states of awareness and the realization of penetrating insights.
Alright, so you may be thinking right now, “yea, that’s cool Alex… but what does this mean? Are we supposed to practice going soft eyes when looking at charts?”
Fair question.
So… similar to the SEALs, we need to consciously — and metaphorically — oscillate between soft eyes and front-sight focus, to keep us from overindexing on a single flashy, and worse, inconsequential, data point. We need to maintain extreme focus on the few things that matter, while remaining cognizant of the ever-changing big picture.
Think of the macro doomer who’s hyper-focused on recession risks because of what the yield curve is saying, that he completely misses rebounding growth leads and an improving liquidity picture.
Or the deep value guy who becomes so enamored with his company that he’s blinded to the changing macro picture that points to dangers ahead…
Maintaining a balance between soft eyes and front-sight focus allows us to narrow our attention to mitigating risks and assessing high-reward bets. While our broader scope allows us to continuously update our mental maps, using Bayesian analysis, which then feeds into our larger planning and gaming out of specific scenarios.
By mastering this balance, operators (in all high-stakes professions) avoid both paralysis and recklessness, allowing us to thrive where others falter.
Those of you who read my tribute piece to John Boyd and his OODA-Loop framework from back in the day (link here) will recognize some of this. As it’s an iteration on much of what he taught, which is that:
To thrive in a changing world, you must be willing to continuously deconstruct reality and rebuild new ways of thinking faster than your competition.
So keeping soft eyes and front-sight focus is not just how we survive. It’s how we thrive.
Now for my 2026 Macro Non-Outlook.
Starting with the top of the Trifecta Funnel.
Consensus/Positioning/Sentiment
We are at an all-time high in average investor equity allocations (blue line). Equity allocation has a correlation coefficient of 0.89 to subsequent rolling 10-year SPX returns. We can see the tight fit between the two below, with forward returns in orange.
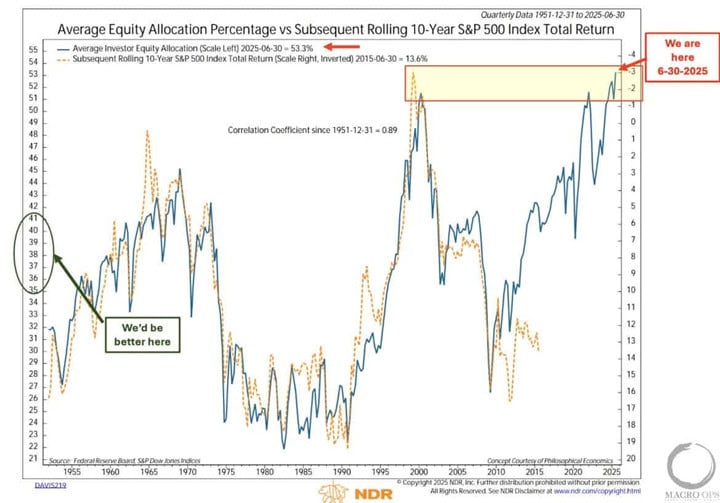
This is a secular measure of positioning and sentiment. It’s therefore a condition, not a catalyst for action or reason for bearishness. It potentially means nothing over the next year, but it likely means everything over the next five.
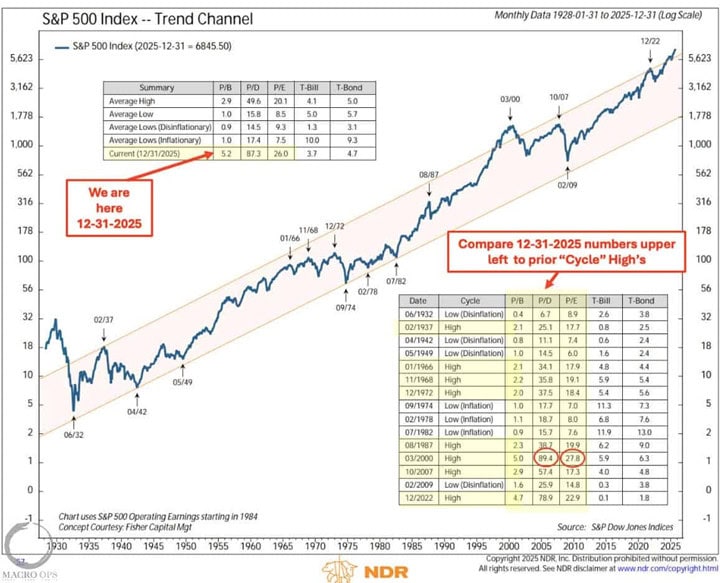
High equity allocations go hand in hand with valuations. And right now, the SPX is richly valued, no matter how you slice it. It’s also above its 90-year trend channel. Like the chart above, this is a conditional data point.
Valuations cannot matter for long, until the day comes when they really do. That day is always preceded by a shift in the liquidity regime — more on that below.
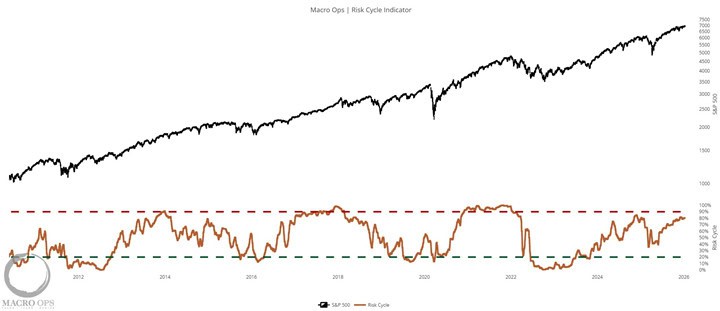
Our Risk Cycle indicator, a composite of NYSE FINRA margin debt, forward valuations, leveraged sentiment, and STAXX retail positioning, has climbed to 80% — a sell signal is triggered when this crosses >95%.
The Risk Cycle is a cyclical measure of risk-taking and fragility in the market. The idea is that cyclical bear markets are the result of investors getting out over their skis. As it’s the build-up of leverage in the system that eventually catalyzes a reflexive unwind, where forced selling begets forced selling, which creates the grinding nature of bear regimes.
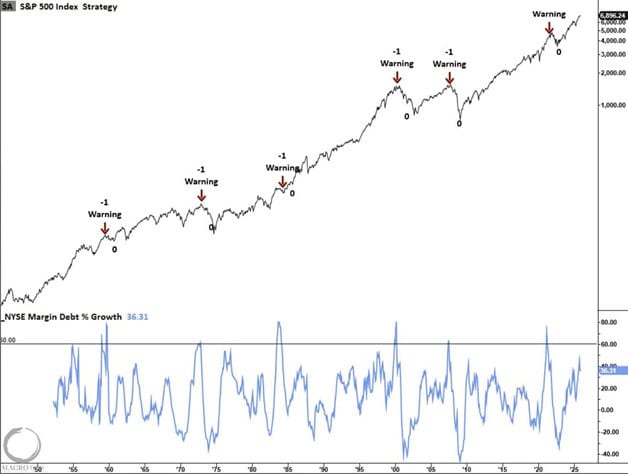
Looking at NYSE margin debt on a RoC basis, we can see that it paints a similar picture. The current reading is at 36%. A cyclical sell signal is triggered when this climbs above 60% and then falls back below 50% (chart via our friend Dean over at TPM).
Similar to our Risk Cycle measure, this data point shows that investors are becoming increasingly comfortable adding leverage to their books. But we still have plenty of room for more gearing before the sandpile turns critical.
When this one triggers, it’s high-time to button up the hatches and prepare for an extended bear regime.
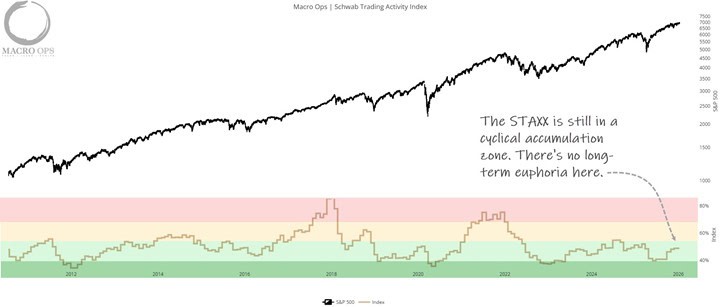
Schwab’s STAXX paints a more benign picture, as it’s still firmly in the green zone.
For those of you unfamiliar, the STAXX (formerly IMX before TD Ameritrade was bought) draws from a pool of tens of millions of retail accounts. It’s a composite score of equity exposure, portfolio volatility, and trading activity that aggregates into a measure of “risk exposure” across a large sample of accounts.
Like margin data, we prefer this to standard sentiment surveys. These tell us what millions of retail investors are actually doing with their capital rather than how they say they are feeling.
Similar to the indicators above, this should be viewed more as a longer-term/cyclical measure of positioning and sentiment.
It should be viewed through a contrarian’s lens. The current picture is bullish for risk assets.
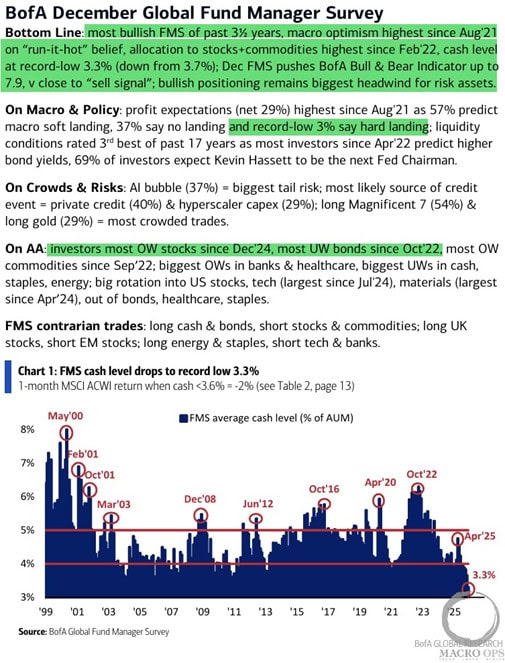
The most recent BofA Global Fund Manager Survey highlights the following:
- Most bullish FMS since early 22’
- Highest macro optimism since Aug 21’
- Highest allocation to stocks + commodities since Feb 22’
- All-time record low in cash
- A record low of fund managers expect a hard landing in the coming year
- Investors most overweight stocks since Dec 24’ and underweight bonds since Oct 22’.
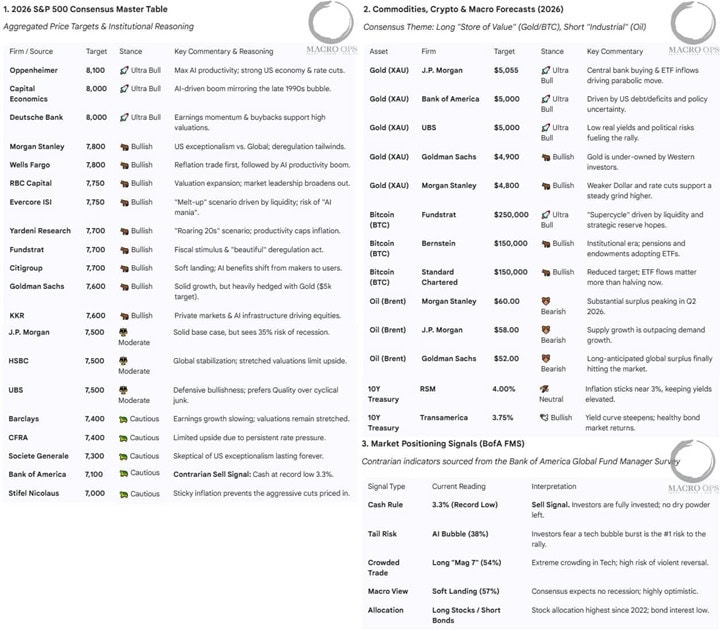
The average bank forecast for the SPX eoy 2026 price target is 7,610, implying +9.5% upside this year.
According to AI, the increasingly popular narrative amongst Wall St. is:
The US economy has successfully achieved a soft landing, and we are now entering a mid-cycle ‘Roaring 20s’ boom driven by AI productivity, where earnings growth matters more than Fed rate cuts.
This aligns with my read of things as well.
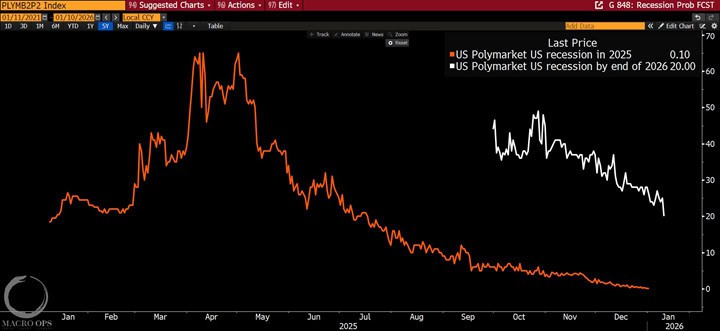
Coming into the year, betting markets are placing 20% odds of a recession in 2026 (white line). Which is about the same level as 2025 started with (orange line).
Will 2026 be the year that Main St wins over Wall St?
Doubtful… but with Republicans headed for a challenging election, it’s likely we see the Trump admin pull out all the stops ($2k stimmy checks, assumable mortgages, etc…) And all this on the back of a resurgence in both US and global growth.
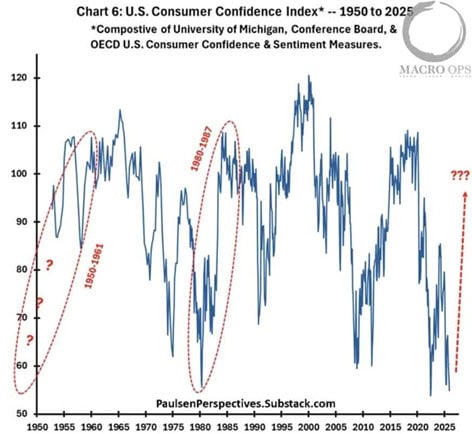
That’s why I think this chart from Paulsen might be foretelling. It’s a composite of consumer sentiment indicators, which Paulsen argues is as critical to future equity returns as earnings are, though it receives far less attention.
He highlights the current historic divergence between the two and draws parallels to the 1950s and 1980s, when stocks soared primarily on rising optimism. Consequently, Jim views a rebound in Main Street confidence as the likely “winning ticket” for 2026.
Sentiment & Positioning Bottom-line:
- Secular indicators of positioning/sentiment and valuation are either at or near all-time record highs.
- Cyclical measures of positioning/sentiment are rising but remain well below levels that mark cyclical tops.
- The 2026 consensus:
- Everybody is bullish, but only moderately so
- Consensus expects earnings to rise, but multiples to contract
- Popular narrative: Soft landing achieved and a return to growth
- Gold to 5k
- Bearish oil
- Everybody is bullish, but only moderately so
My general feeling is that we’re entering the latter stages of a cyclical bull market. Investors started to turn increasingly bullish in the second half of 25’, but it was a timid bullishness. Most seemed to add risk due to a lack of alternatives (TINA).
We can see this reluctant bullishness in the large spread between gross and net exposure over the past few months. Gross hit record highs. But investors loaded up on insurance, so net exposure has remained neutral.
All this strikes me more as a product of the debasement regime we now find ourselves in.
Dalio commented on this in a recent post (link here), writing:
What happened to the value of money: the dollar fell by 0.3% against the yen, 4% against the renminbi, 12% against the euro, 13% against the Swiss franc, and 39% against gold (which is the second largest reserve currency and the only major non-fiat currency). So, all fiat currencies fell, and the biggest story and the biggest market moves of the year were the result of the weakest fiat currencies falling the most, while the strongest/hardest currencies strengthened the most.
The best major investment of the year was long gold (returning 65% in dollar terms), which outperformed the S&P index (which returned 18% in dollars) by 47%. Or, said differently, the S&P fell by 28% in gold-money terms. Let’s remember some key principles that pertain to what is happening:
When one’s own currency goes down, it makes it look like the things measured in it went up. In other words, looking at the investment returns through the lens of a weak currency makes them look stronger than they really are. In this case, the S&P returned 18% for a dollar-based investor, 17% for a yen-based investor, 13% for a renminbi-based investor, only 4% for a euro-based investor, only 3% for a Swiss franc-based investor, and, for a gold-based investor, it returned -28%.
The Technicals
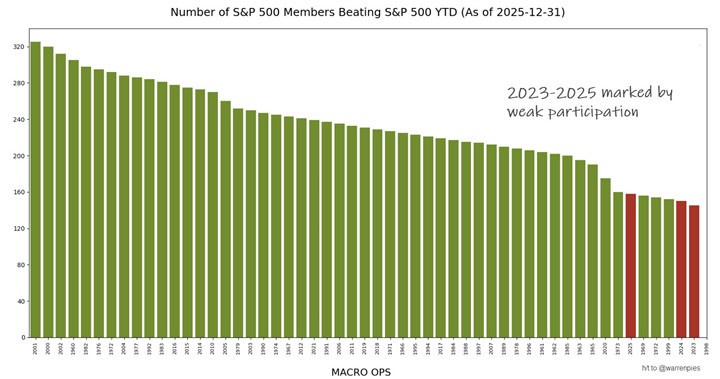
The past three years have been marked by high concentration / weak participation in the indices. This is typical of the latter innings of a cyclical bull (note the other years in the far right of the chart; 98’, 99’, 72’, 69’).
While 69’, 72’, and 99’ immediately preceded cyclical market tops. The market had a bit more juice left in it post 98’, and there’s reason to believe 2026 will be similar, as participation appears to be broadening out.
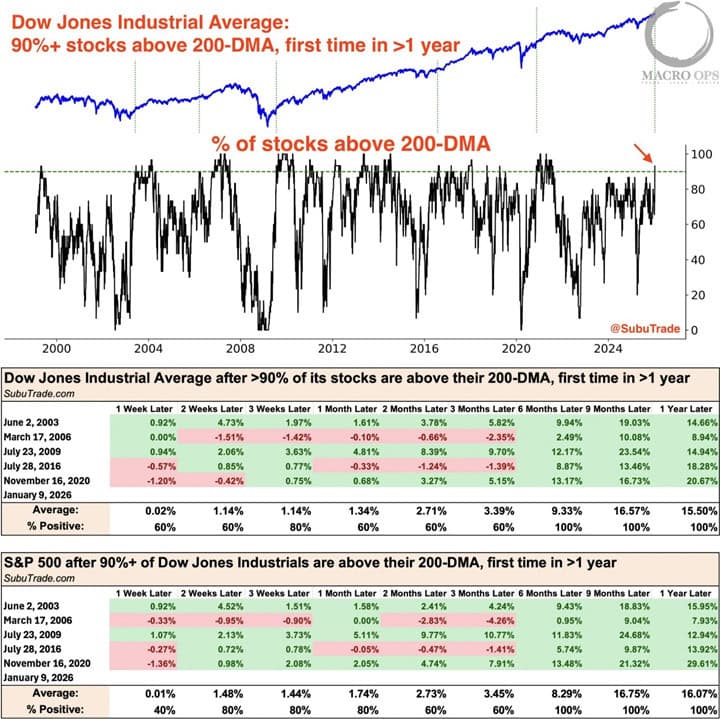
Here are a few examples of this, which bode well for equity returns over the next 6-12 months
This chart from @SubuTrade shows that over 90% of DJIA stocks have climbed above the 200dma for the first time in over a year. Historically, this has preceded very strong gains 6-12m out 100% of the time.
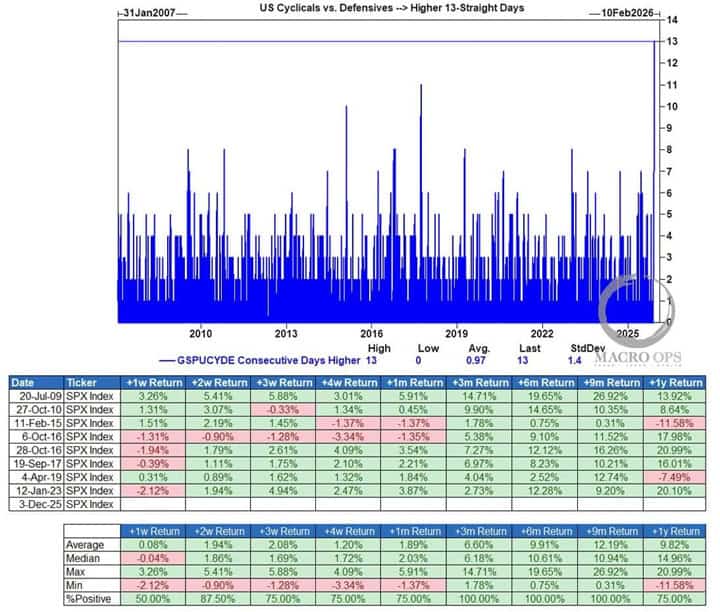
I shared the following in December from GS, where they noted the historic string of Cyclical vs Defensive outperformance, writing:
When we look at every period since 2007 where cyclicals beat defensives in long streaks (8 straight gains or more), the 3-9 month returns for the S&P are almost always positive — and often very strong. It’s one of the cleaner signals we have that the market is sniffing out better macro conditions before the data fully reflects it.
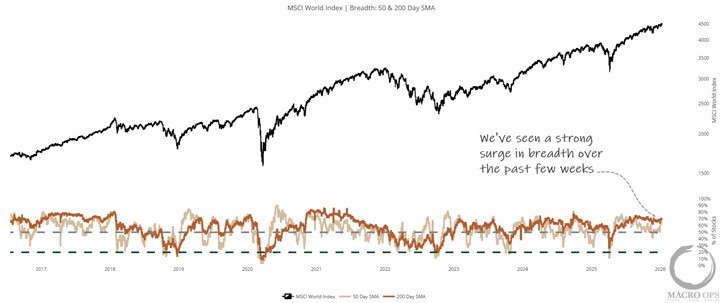
No matter how you slice it, we’ve seen a strong surge in breadth over the past few weeks. Here’s the MSCI World Index showing that both the % of members of the 50- and 200-dma are north of 65% and climbing.
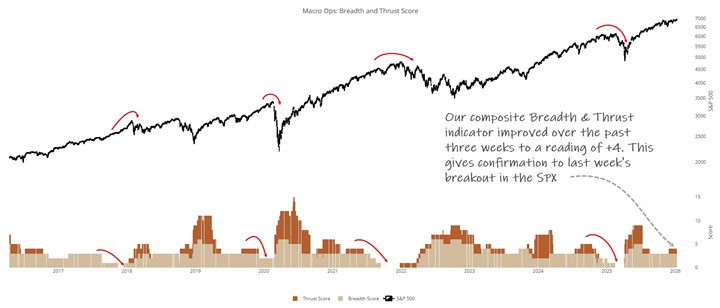
Our composite Breadth & Thrust indicator jumped to +4 over the past four weeks. It’s highest reading since August. This is a trend that’s picking up, not breaking down.
The S&P 500, Russell 2000, Dow Jones, German DAX, EuroStoxx 50, Nikkei225, and Emerging Markets are trading at (or within a hair’s breadth) of all-time record highs.
There’s something you should know about all-time highs. They tend to beget more all-time highs.
Nothing about this is bearish.
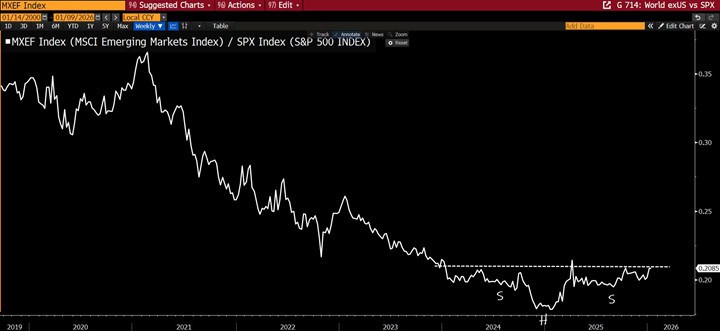
Lastly, the chart below is particularly interesting to me. The other week, I noted the US equity market’s weak underperformance versus the rest-of-the-world (RoW) in 25’.
Below is the MSCI Emerging Market index against the SPX. It’s put in a large 2yr H&S bottom. If this chart breaks out to the upside, meaning emerging markets continue last year’s outperformance, it would likely mark a structural shift in the cycle, with profound implications for the dollar and commodities alike.
Keep an eye on this one.
Technicals Bottom-line:
- The recent surge in global breadth bodes well for 6-12 month future returns
- The recent Cyc vs Def historic outperformance points to strong 6-9 month returns
- Composite breadth is confirming last week’s SPX breakout.
- Nearly all major global indices are at or near all-time highs, which is bullish
- Keep an eye on Core vs Periphery relative performance.
Macro (Growth, Liquidity, Labor, Inflation)
Whether we like it or not, we are in a policy-dominated world. The central banks have fired most of their bullets, and now we’re left dependent on profligate governments to keep driving this train forward.
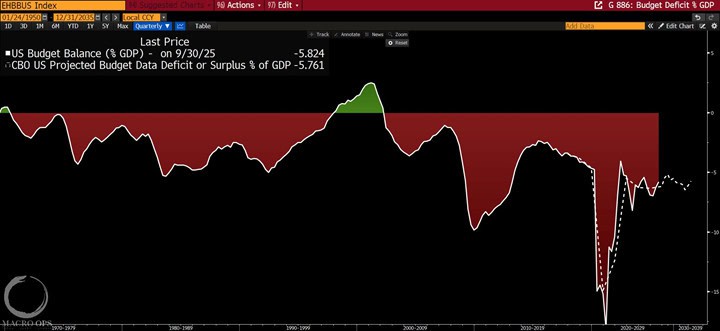
Our starting point, then, is the budget deficit, currently at roughly -5.5% and not expected to improve in the foreseeable future.
One important thing to note is that it’s very hard for the economy to tip into recession when the budget deficit is this large.
Citadel points out that the fiscal and liquidity impulse will be strong for the first half of the year:
- Policy Inflection Point: The start of 2026 marks a key shift in policy, with fading tariff uncertainty and a reversal in fiscal impulse from a Q4 2025 drag (-0.6% of GDP) to an early 2026 tailwind (+0.5% to +0.9% of GDP) driven by the “One, Big, Beautiful Bill Act.”
- Front-Loaded Fiscal Stimulus: Retroactive personal income tax cuts expected to deliver ~$80 billion in Q1 2026 refunds to U.S. households, with a high economic multiplier potentially boosting retail equity trading activity.
- Monetary Policy Support: Lagged effects from 175 basis points of Fed rate cuts over the past 18 months will ease financial conditions, adding an estimated +0.5% to quarterly annualized GDP growth through much of 2026.
- Upside Risks to Stimulus: Policy risks lean toward more support, including additional tariff relief or targeted transfers (e.g., $2,000 payments to households earning under $75k, equating to ~$150 billion in extra fiscal aid), which could further amplify aggregate demand.
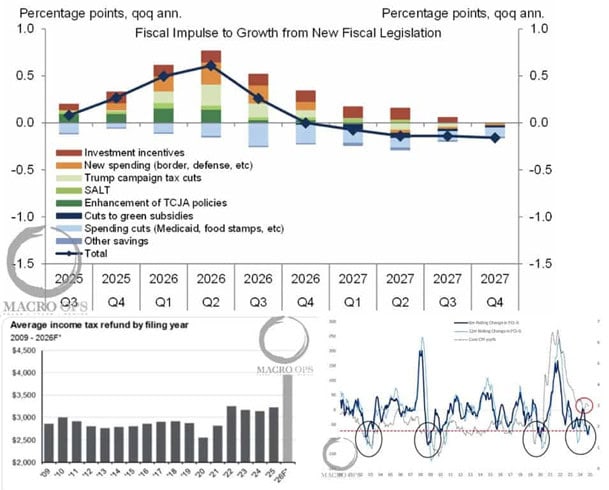
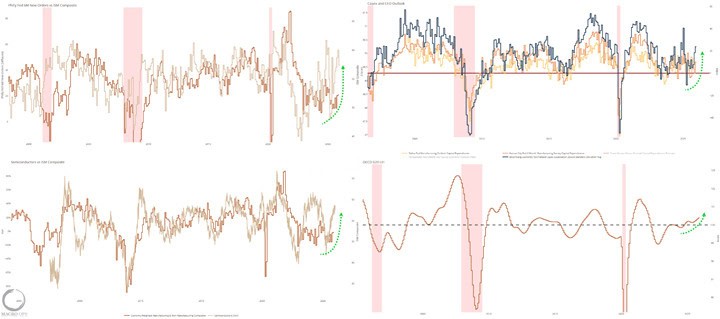
Our growth leads have been picking up on this, pointing to accelerating growth over the next two quarters.
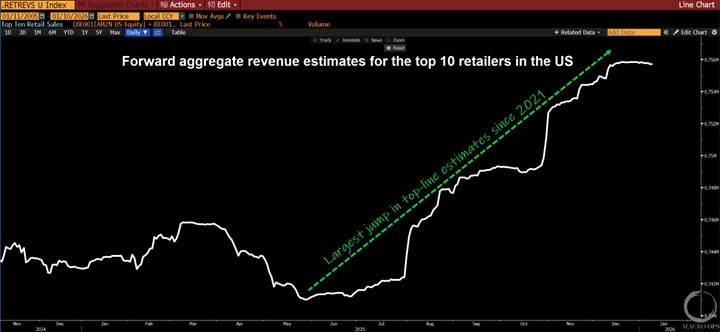
These revised growth expectations are showing up in NTM revenue expectations for the top ten retailers in the US.
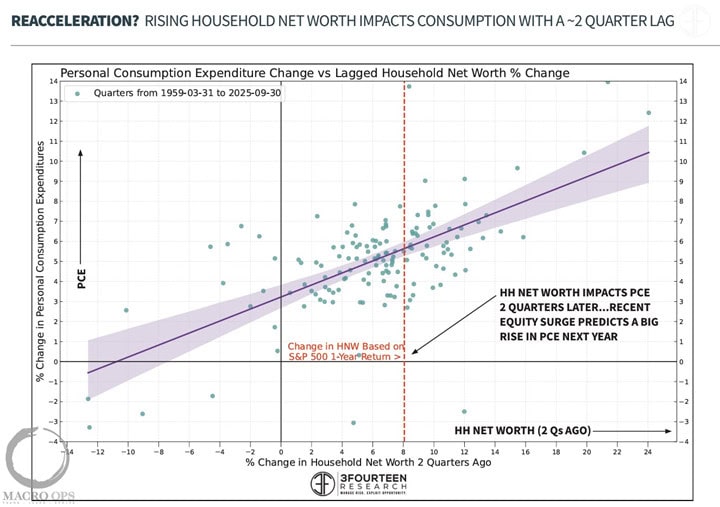
For months, I’ve been pointing out the massive increase in household net worth and how this is extremely bullish for future growth.
Someone sent me these two great charts from 3Fourteen Research. They show that we just saw the largest 6-month growth in household equity on record.
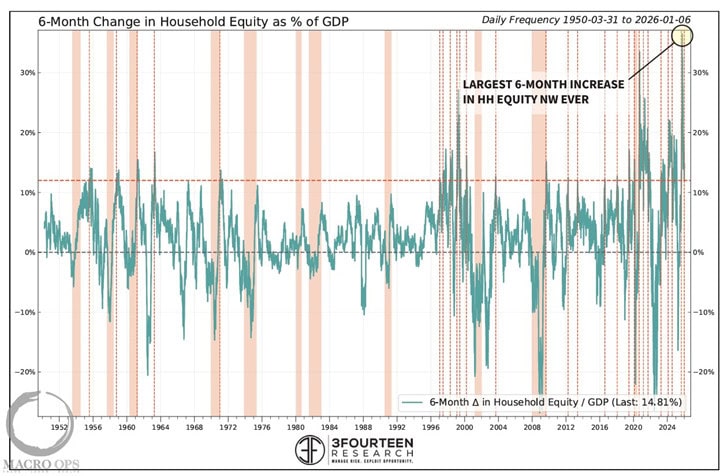
The next chart shows how this is predictive of an equally big surge in personal consumption over the following year.
This growth resurgence is being driven by an extremely favorable liquidity regime.
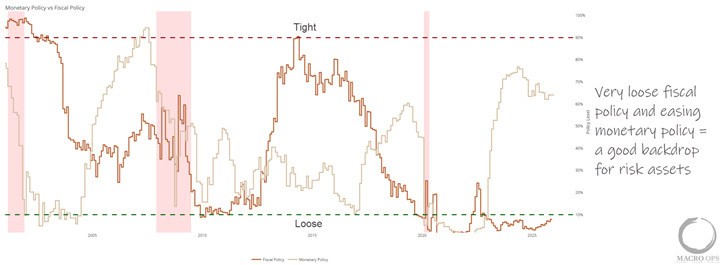
Our Monetary & Fiscal Policy indicator below shows a highly supportive fiscal regime with an improving monetary one.
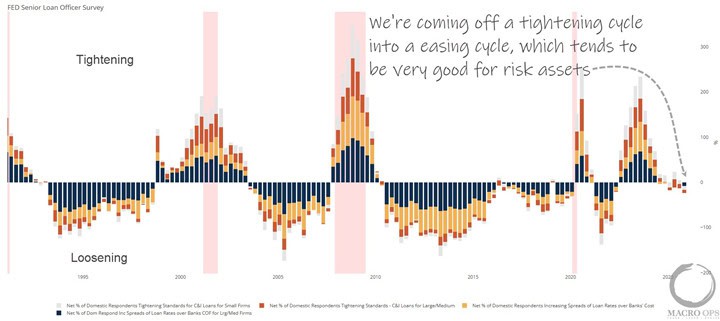
We can see these improving liquidity conditions in the recent Fed Senior Loan Officer survey, which shows a cyclical recovery in the lending market.
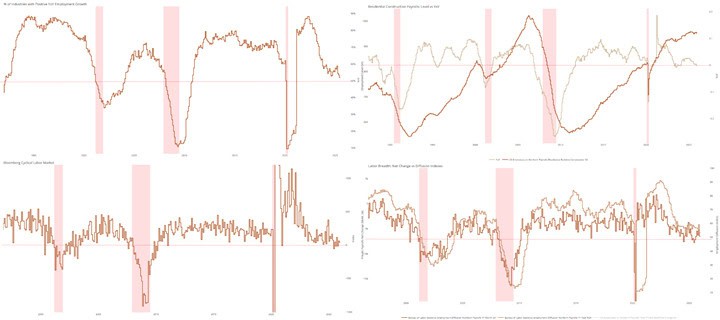
Despite a favorable liquidity and growth backdrop, the labor market remains frozen, with low hire and quit rates.
Now, we’ve been arguing that these numbers are being somewhat distorted by the big crackdown on immigration this year, along with a quickly aging population. The reality is that the run rate needed to keep the jobs market at neutral is much lower than it has been in the past.
Even accounting for this, though, the labor market doesn’t look great. But it isn’t at risk of an imminent recessionary unwind either.
Our lead labor market indicators show a tepid jobs market, but one that is not signaling a recession. My guess is that we see a slight improvement in the data over the next two quarters as trade war tensions ease during this midterm year, CAPEX picks up, and growth accelerates.
It remains to be seen whether AI will have a significant impact here.
My bias is that AI will prove far more disruptive to labor, and at a much faster pace, than technological revolutions in the past. I think this could become a big story as early as the second half of this year.
On the positive side, at least for equities, a tepid but non-recessionary labor market keeps wage growth pressures muted. And it’s difficult to have persistent cyclical inflation without sustained wage growth.
This should keep the Fed on the easy path, for at least the first half of the year.
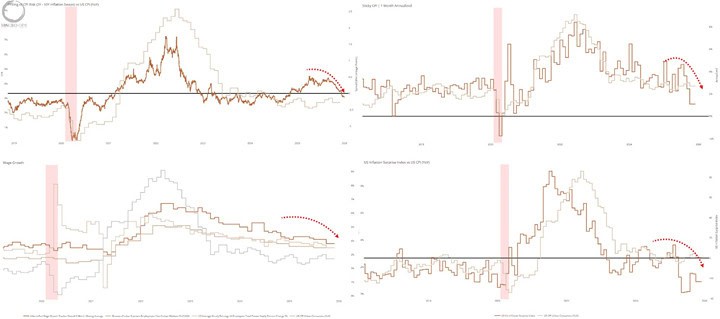
Speaking of inflation, our leads continue to fall, with some outright collapsing.
All signs point to this continuing in the first half of 26. Accelerating AI adoption is lowering unit labor costs, allowing companies to protect margins without raising prices on consumers. Additionally, due to CPI’s 12m+ lag to shelter (core CPI’s most significant component), inflation must mechanically fall in the first half of this year.
Macro bottomline
- An accelerating fiscal impulse and favorable liquidity backdrop will drive a reacceleration in growth over the first half of the year, likely much more than what’s currently expected
- A tepid labor market and mechanical disinflationary pressures will keep the Fed easy over the next two quarters
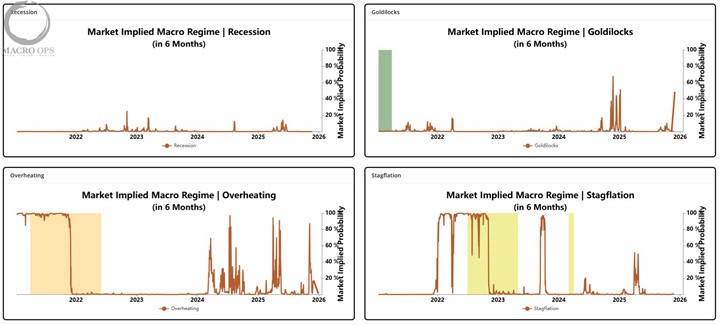
- Taken together, this suggests a high likelihood that we’re entering a Goldilocks regime that will likely play out until inflationary pressures return in the latter part of the year.
Conclusion
I don’t like that the popular narrative is beginning to catch up with where we’ve been over the past six months: we’re in a world of re-accelerating growth, with low recession risk and strong disinflationary pressures over the next two quarters.
I much prefer to be on the other side of the consensus. But, I find it difficult to be bearish here, barring a policy or geopolitical shock or a resurgence in inflation, which I don’t expect until later in the year.
And perhaps, the crowd isn’t bullish enough?
Investors have certainly upped their risk exposure over the past six months. But while their gross exposure is high. Their net is neutral. Everybody’s hedged. Few are truly pusing out onto the risk curve.
As our cyclical positioning data shows, there’s still plenty of capacity for investors to juice things if they turn outright bullish and start upping net exposure.
We’ll see… As you know, we at MO don’t predict, we assess probabilities. The above is my general macro assessment as we kick off 2026.
More a read of where we are now, so that it may inform where we go next.
We’ll play the market as it comes. Using our Trifecta lens to try to stay on the right side of the big trends, in both the market and the economy.
We’ll be paying close attention to the below, to see whether our indicator validates our first half Goldilocks base case, and for when an “Overheating” regime inevitably throws cold water on this party.
I’ll be out with more dives into specific assets and the trade setups I’m most interested in as we start the new year.
Until then, keep soft eyes and a front-sight focus…