In March 2019, we pointed out the incredibly tight compression regime in gold, writing:
Volatility in gold as measured by the width of its monthly Bollinger Band is at levels last seen over 17-years ago, in 02’ right before the barbarous relic began its decade-plus run…
Markets tend to work like rubber bands. The tighter they’re wound up, the more explosive they unravel. In other words, compression regimes lead to expansionary ones. The size and velocity of the move often mirror the preceding level of contraction in vol. There are logical reasons for why this occurs (it has to do with positioning and narrative cascades).
The current level of compression suggests something big is coming around the corner. As macro traders, it’s regimes like these where we need to be at the ready. An explosive macro trend is about to be born…
We pounded the bullion table some more a month later, writing:
It seems we have the two necessary ingredients for a major bull market in gold. These are (1) low expected returns for long-term financial assets and (2) a global money stock that is likely to keep growing (potentially by A LOT).
When we combine this with the current low vol regime + the textbook long-term inverted H&S bottom pattern forming, we get a clear trading opportunity….
Looking at the tapes of a number of gold miners I can’t help but salivate. There are a few stocks here that look ready to explode…
The background timing of the current macro environment tells us something big is coming, something that’s not yet fully known or fully discounted by the market…
This means some major trends are on the horizon. And along with major trends come major opportunities to profit.
Gold is just one area I see that’s ripe for exploitation…
And finally, we trumpeted the bullish clarion again in April of this year:
I expect gold will take out its all-time high made in 2011 within the next six months. After that, the sky is the limit.
I have high conviction on this trade over the long-term.
Gold closed the month of June near its highs — a bullish development. And is now less than 7% away from taking out its all-time highs.
You can find the links for each of these timestamped reports here, here, and here.
Alright… enough with the self-congratulatory hubris. That’s not the point of this piece. I share this so you can see how much you can improve your analysis of the metals market when you have a hard and consistent framework for doing so. A framework that I’m going to share a key part of with you right now.
Similar to all other markets we trade, the foundation of our precious metals framework is the “Marcus Trifecta”. A triangulation of the Macro, Technicals, and Sentiment. We’re going to cover the macro.
The macro framework is simple… It has little to do with inflation or “crisis insurance” of any other of the perfunctory narratives that commonly get passed around as wisdom.
Okay… so here it is… our macro framework is: RED. That’s it, what do you think… Pretty good, huh?
Not impressed? Okay, that’s fine, let me break it down for you then. RED is an acronym that stands for.
-
- Relative Size
- Expected Real Returns
- Demand
Here’s what each of those means.
Relative Size
Less than 15% of the gold mined throughout history is held in investment form. Gold’s total market cap is somewhere in the ballpark of $10-13trn but its total investable market cap is less than half that amount. While the global capital stock (equity + debt) is in the realm of $250-$300trn. This creates a positively sloped investment demand function. More on that below.
Expected Returns
Read the following from a 1985 NBER working paper titled “Gibson’s Paradox And The Gold Standard”. Here’s the link to the paper (emphasis from me):
Gold is a highly durable asset, and thus, as stressed by Levhari and Pindyck (1981), the demand for the existing stock (as opposed to the new flow) must be modeled. The willingness to hold the stock of gold depends on the rate of return available on alternative assets. We assume that the alternative assets are physical capital with a (instantaneous) real rate of return r, and nominal bonds with (instantaneous) nominal return i = r + P/P = r — Pg/Pg. The real rate of return is exogenous to the model, but subject to shocks. These shocks reflect changes in the actual or perceived productivity of capital as envisioned by Keynes and Wicksell.
The above is just a fancy of way of saying two things (1) since gold is a non-perishable metal and the amount mined each year (new flow) is tiny relative to the existing stock, we should focus on the latter in our supply & demand calculations and (2) the attractiveness of gold is ALL relative and demand only becomes positive when the expected real rate of return offered on other assets (stocks and bonds) is low.
Demand
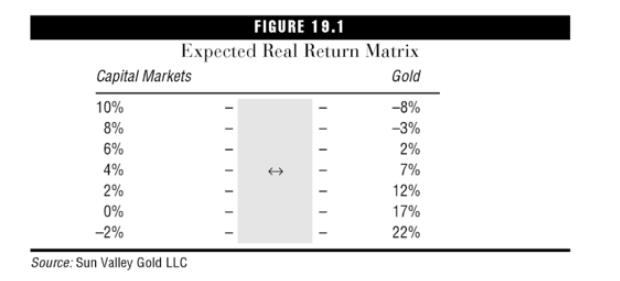
Demand, not supply, is what matters. Remember, potential demand is many multiples the size of the existing gold stock, which is fairly inelastic. So it doesn’t take much of a change at the margins of asset preferences to cause very big moves in the yellow metal. And as we learned above, this demand or asset preferences are driven by the expected real returns of stocks and bonds. This is why gold tracks the real yield on bonds very closely. When the real yield offered on bonds is trending lower, gold goes up. And vice versa.
This inverse relationship can be seen below in the following matrix via the excellent book Hedgehogging, written by Barton Biggs (the chapter with Peter, the “Gold Guru” is also where I first became aware fo the above NBER paper).
So that’s it… That’s RED. Our fundamental framework for analyzing gold.
The entire thing can be boiled down further into just two key points:
-
- Over the long run (and this is one of Ray Dalio’s “principles” regarding gold, as well) the price of gold will approximate the total amount of money in circulation divided by the size of the gold stock
- And it’s not inflation or deflation that is the principal driver of gold, but the expected real return from other long-term financial assets, particular equities.
Using the above we can quickly discern that there’s a very high probability the bull market in gold will continue for the foreseeable future.
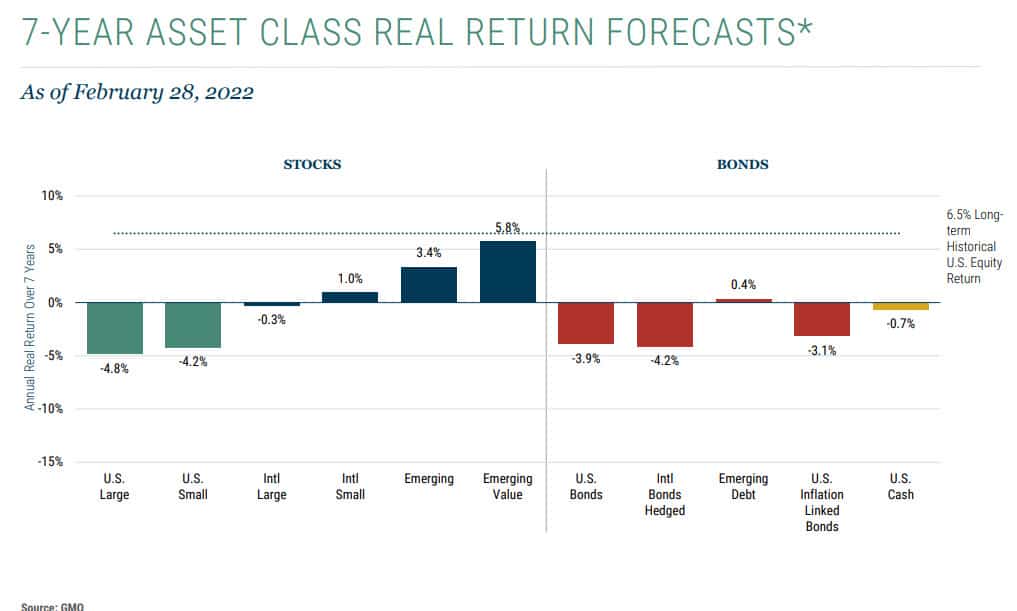
The global money stock has exploded and continues to rise… While the expected real return on financial assets is very low. Even negative in some cases. See GMO’s 7-year forecast as case in point.
Gold obviously isn’t going to go straight up from here. So, if you’re a trader, then you’ll want to pay attention to some key indicators and of course, read the tape.
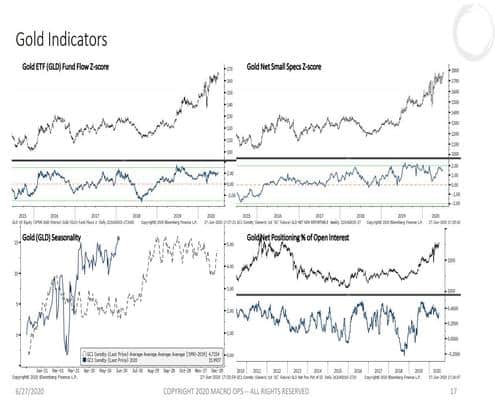
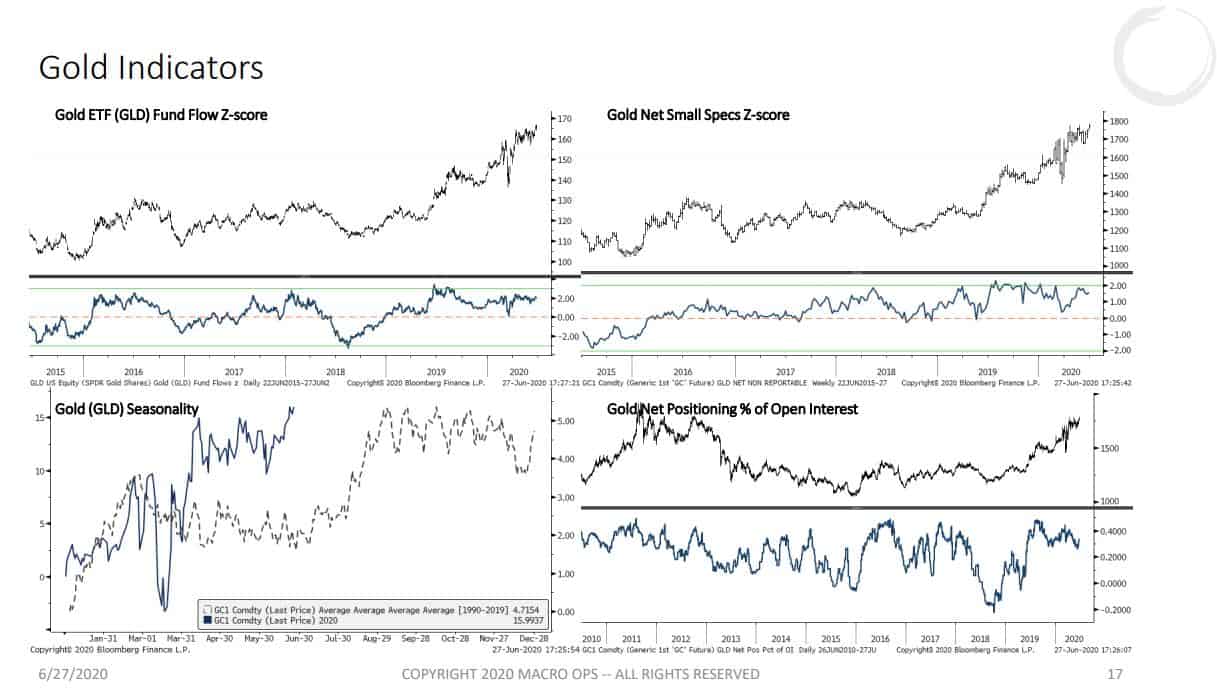
Here’s a slide from our regular weekly Trifecta Report that goes out every Saturday. In the report, we analyze the four main macro instruments: SPX, UST 10yr Bonds, Gold, and the dollar.
The below slide shows some of the key positioning, sentiment, and seasonal data that we track for gold. As of right now, fund flows, sentiment, and positioning all remain supportive of higher prices. Not to mention, gold is about to enter the strongest 2-months of the year for returns on a seasonal basis.
The tape says we’ll probably see a little pullback over the short-term as stocks get bid up. But, that’ll just offer us another good opportunity to add to our position.
So there you have it. That’s our RED system for analyzing gold. I hope you find it useful. We didn’t even cover silver, which according to our framework, should outperform gold over the coming months.