There is a very important difference between being a theoretical contrarian and dealing with it in practical terms. In order to win as a contrarian, you need the right timing and you have to put on a position in the appropriate size. If you do it too small, it’s not meaningful; if you do it too big, you can get wiped out if your timing is slightly off. The process requires courage, commitment, and an understanding of your own psychology. ~ Michael Steinhardt
Summary: The market’s in a precarious spot, with the S&P 500 grappling below its 200-day moving average—a setup historically skewed toward downside risk. Our Trifecta Lens and Breadth Aggregators flipped negative months ago, signaling this selloff. Macro headwinds like slowing growth, negative earnings revisions, and tighter liquidity add to the bearish case. On the bright side, our Weekly Nervous & Numb indicator flashed a buy signal, but it’s one of few positives in an otherwise defensive environment. Bottom line: we’re staying nimble and defensive until the data says otherwise.
Alright, let’s get to it.
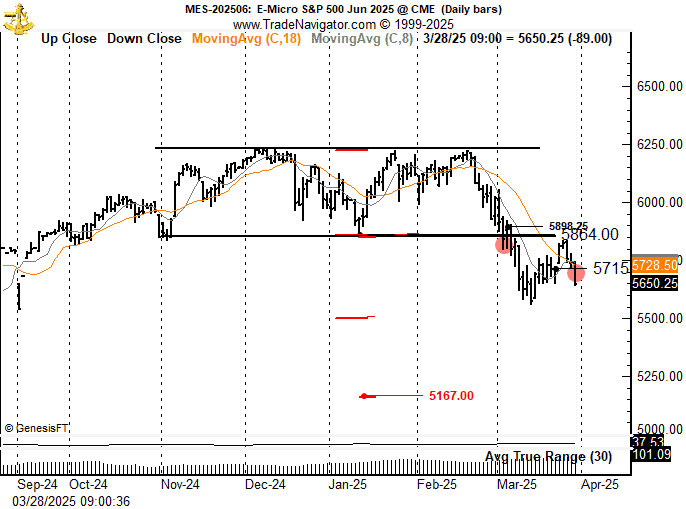
1. @PeterLBrandt “S&Ps now in established downtrend. The 2X target of 5170 is a very appropriate 18% correction from the high.”
We concur.
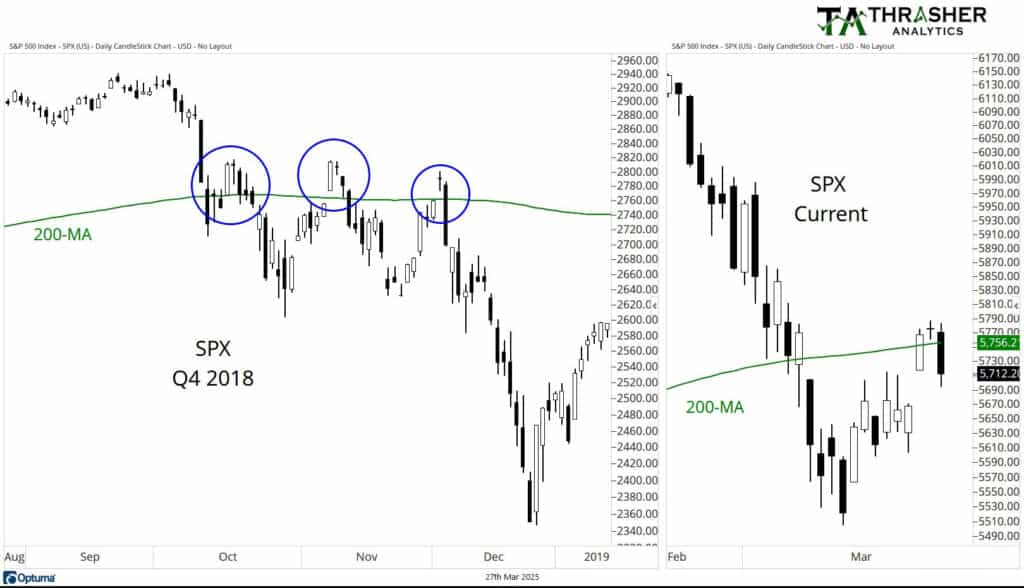
2. @AndrewThrasher “The S&P 500 price struggle at the 200-day MA is beginning to look similar to the down trend in 2018.”
Again, we concur.
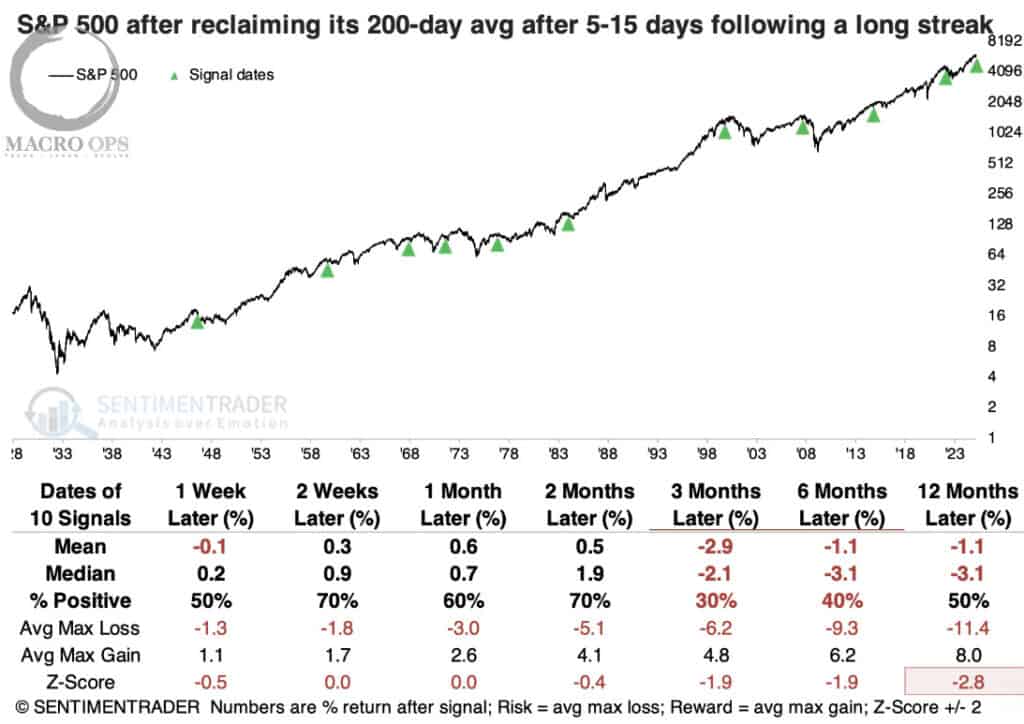
3. SentimenTrader shows the stats on any time the SPX “went more than 200 sessions above its 200-day average, then dropped below it for between 5 and 15 sessions before reclaiming it… A drawdown analysis shows a negative skew, with more -10% drawdowns than +10% drawups. Only four of the ten signals showed more reward than risk over the following year.”
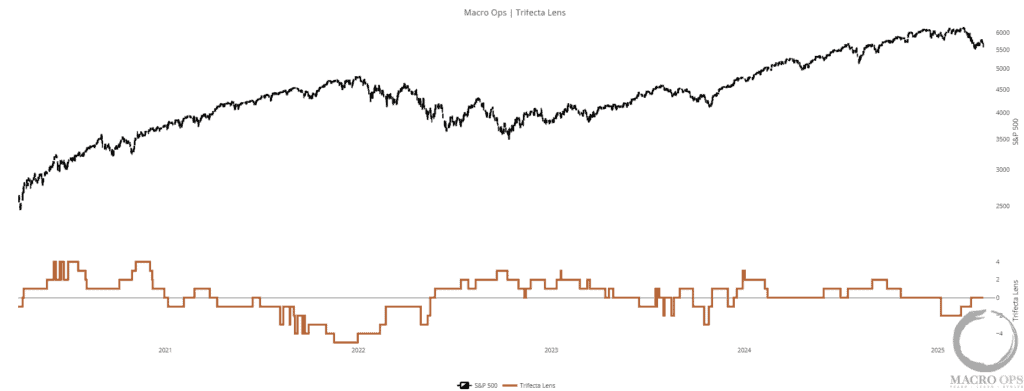
4. In chaotic market environments, we tighten our timeframes and zero in on core data points, giving extra weight to the tape to avoid getting whipsawed by the ever-shifting Narrative Pendulum. This defensive approach keeps us nimble and focused on what matters most. Our Trifecta Lens—a composite of Breadth, Thrusts, Liquidity, Sentiment, and Positioning—flipped negative at the start of the year, accurately signaling the selloff.
It’s now neutral, but we need a +1 reading to consider turning constructive and a +2 before shifting decisively bullish. Until then, it’s all about playing strong defense and staying adaptable.
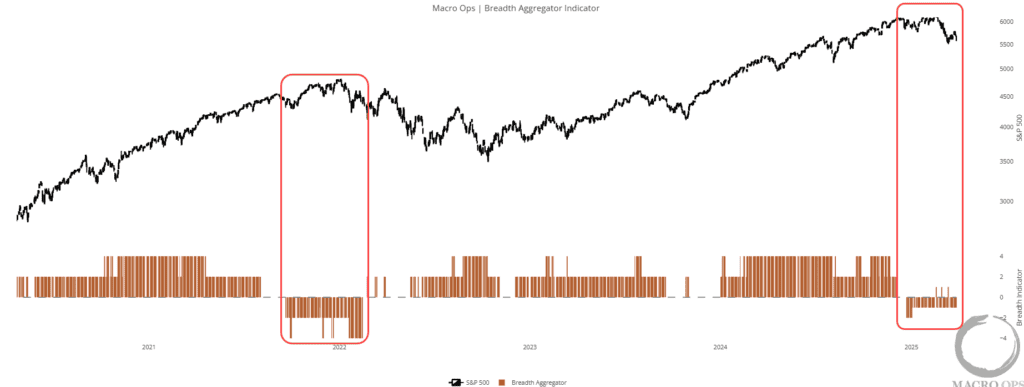
5. One of our key “Keep It Simple Stupid” (KISS) indicators is the Breadth Aggregator, which tracks the overall participation of stocks in market moves. This tool flipped negative back in December, right at the market’s peak, signaling the need for caution. Until we see a consistent string of +3 readings, we’re maintaining a defensive stance. It’s all about waiting for clear confirmation before shifting gears.
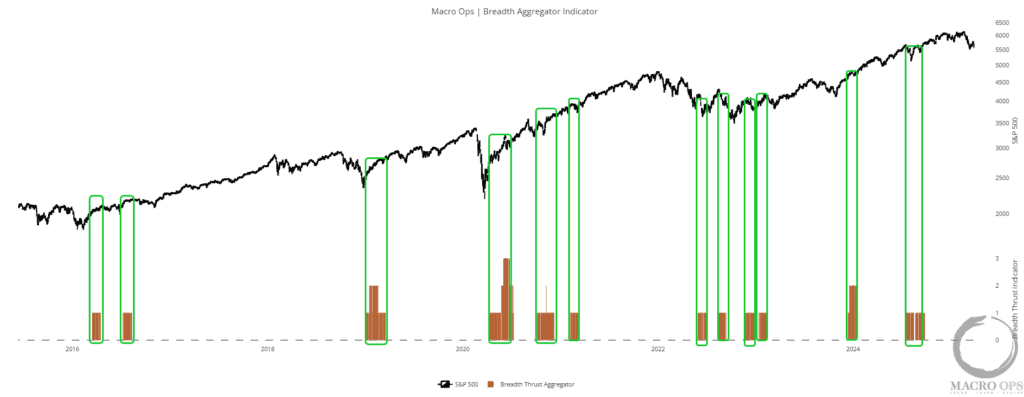
6. Our Breadth Thrusts Aggregator is another one… Any enduring bottom following a selloff like the one we’re in, will be accompanied by a series of thrusts. We’ve seen zero as of late.
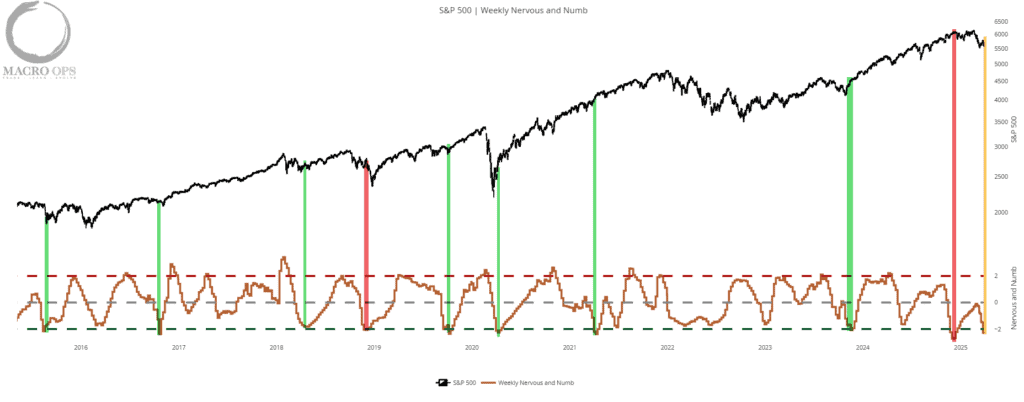
7. One positive data point that can go in the bullish ledger is the Buy Signal from our Weekly Nervous & Numb indicator, which measures the relative movements between the SPX and the VIX. The chart below shows that there’s been 9 other buy signals over the past decade. Two were false signals (red highlights) while the other 7 marked major bottoms.
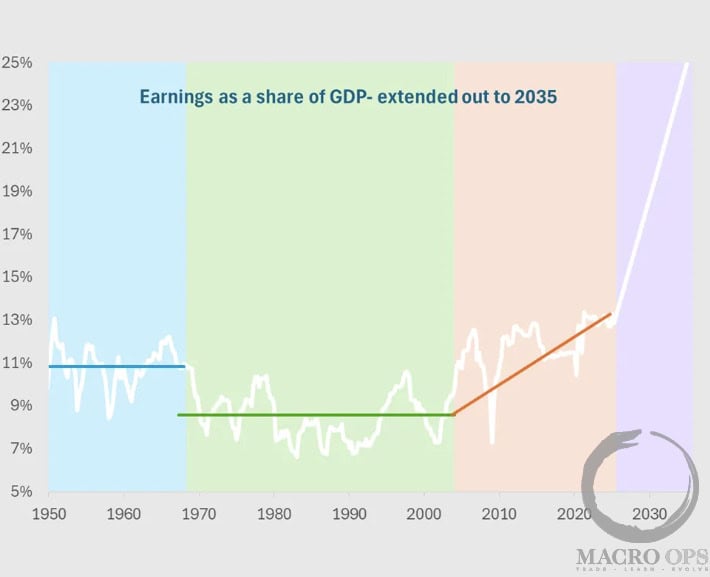
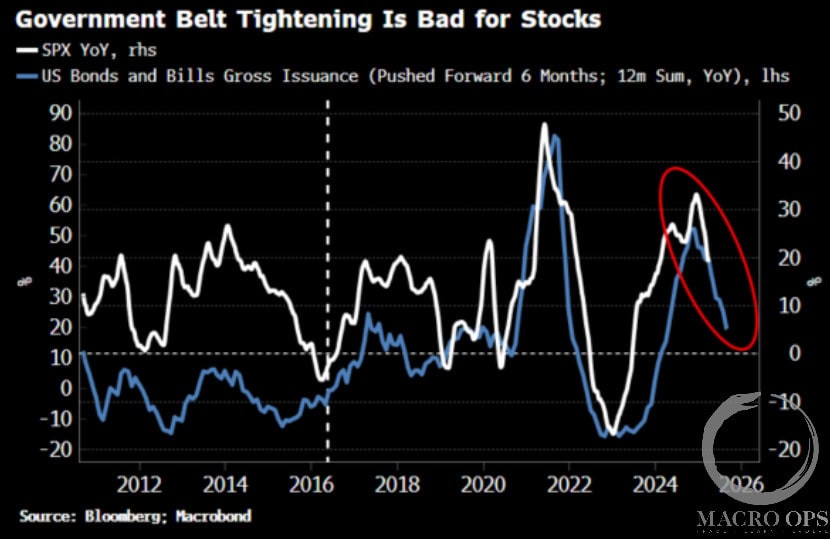
8. BBG’s Simon White pointed out last week that “there is a concerted effort to address the size of the state in the US. The deficit is likely to stop rising. That means less Treasury issuance: a bad omen for stocks. As teh chart below shows, gross issuance of bonds and bills leads stock returns. As the growth of gross issuance falls, stocks are likely to meet resistance over the coming 3-6 months.”
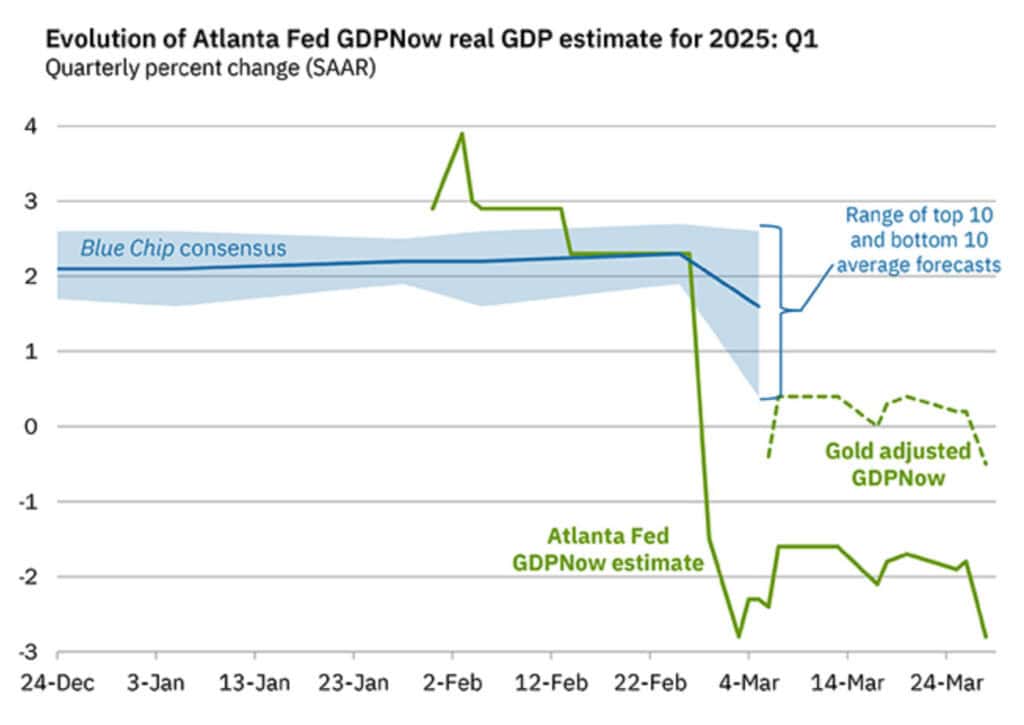
9. An escalating trade war and a narrowing defict will both detract from growth over the coming quarters. The Atlanta Fed’s recent GDPNow estimate (adjusted for gold imports) just turned negative.
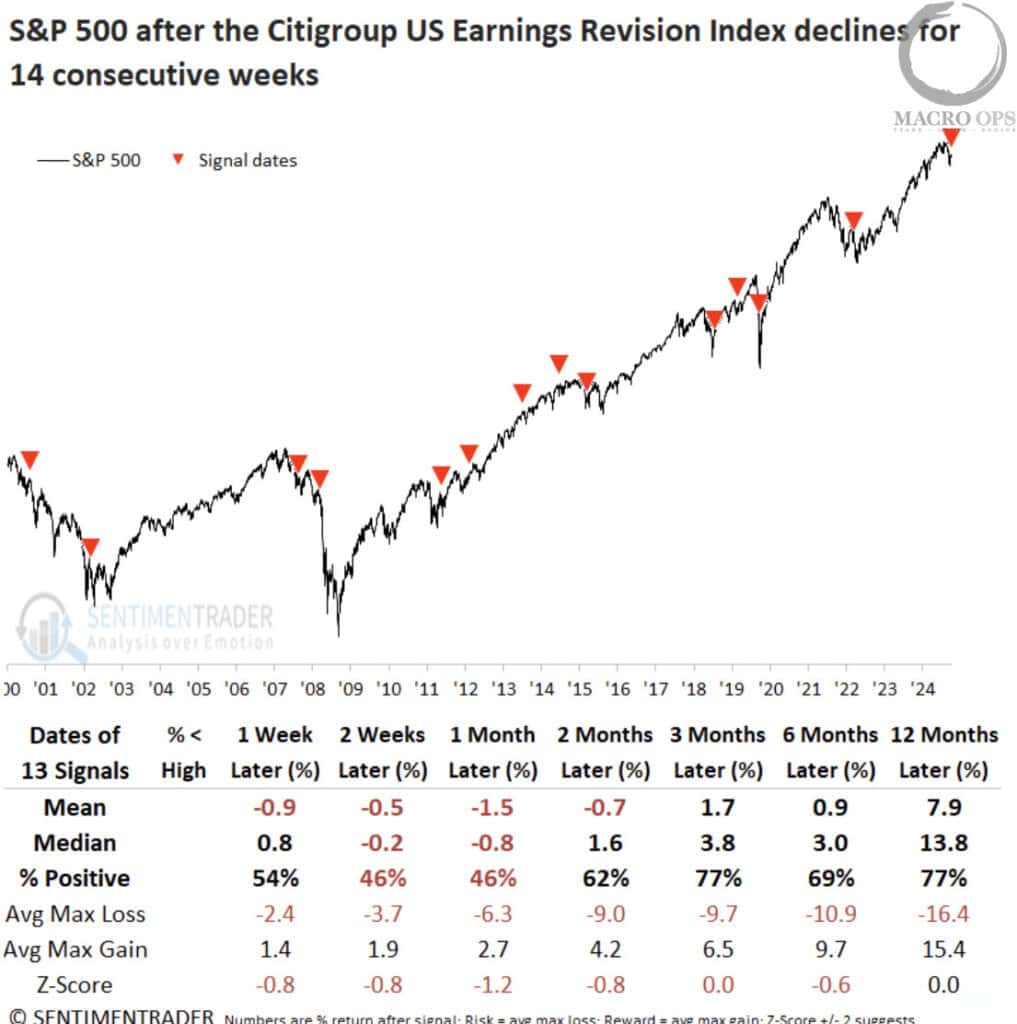
10. The weakening macro backdrop is also driving negative earnings revisions, ST writes: “Whenever the Citiroup Estimate Revisions Index declined for 14 consecutive weeks, the S&P 500 struggled over the subsequent month, displaying unfavorable returns and consistency. At some point over this same time frame, the large-cap index declined in 9 out of 13 cases…Across all time horizons, the average max loss was more significant than the maximum gain. In four of seven time frames, the median loss surpassed the median gain, signaling a poor risk/reward profile.”
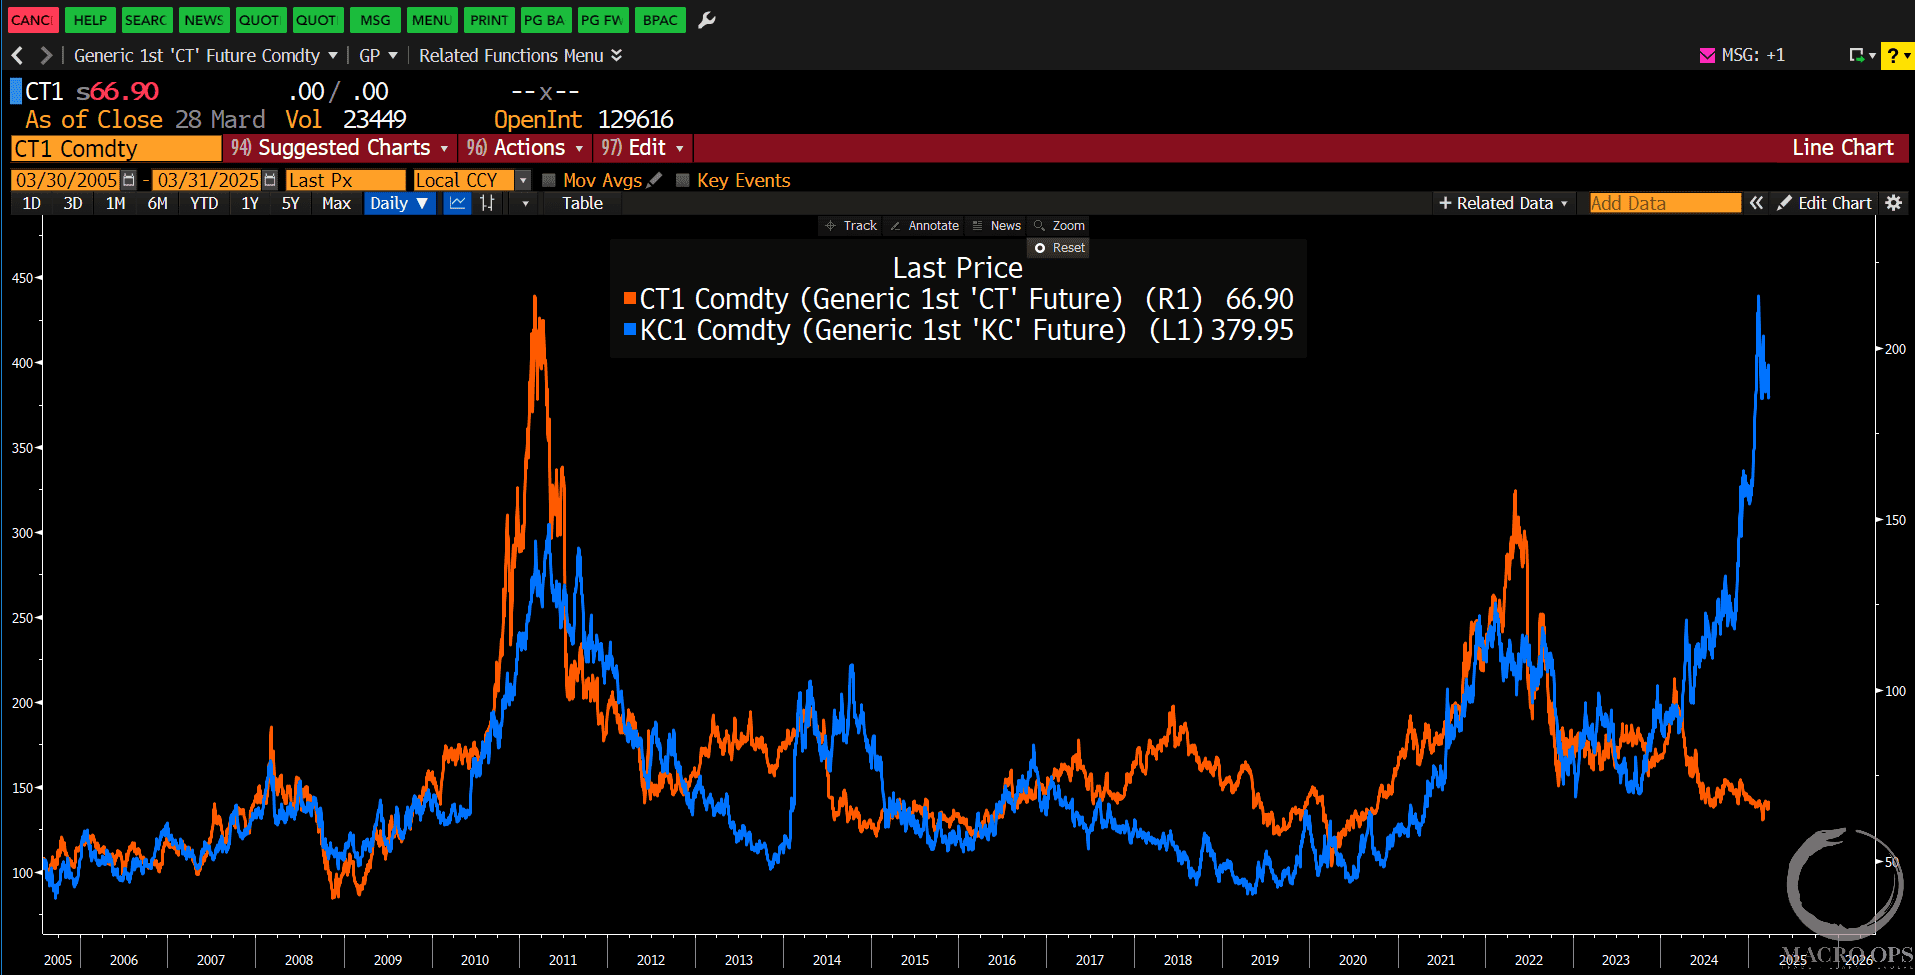
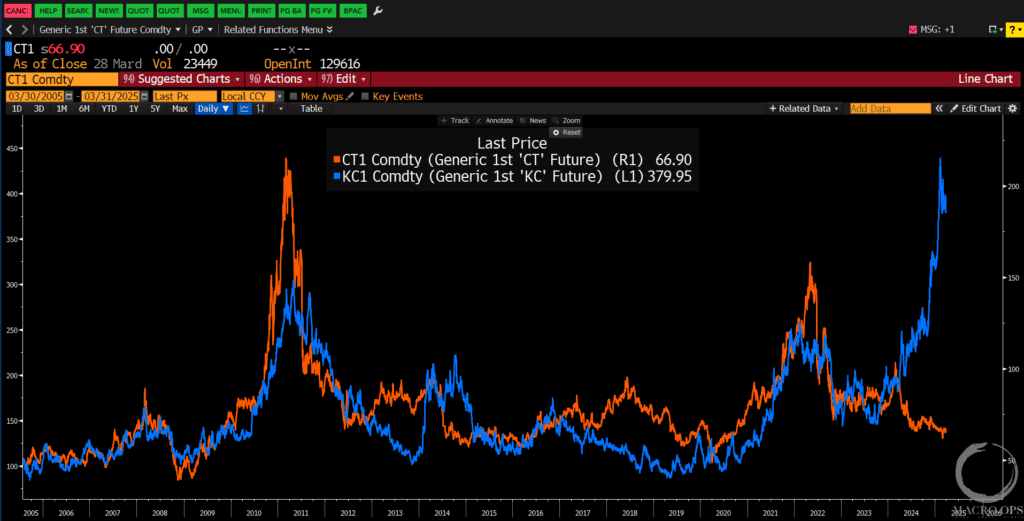
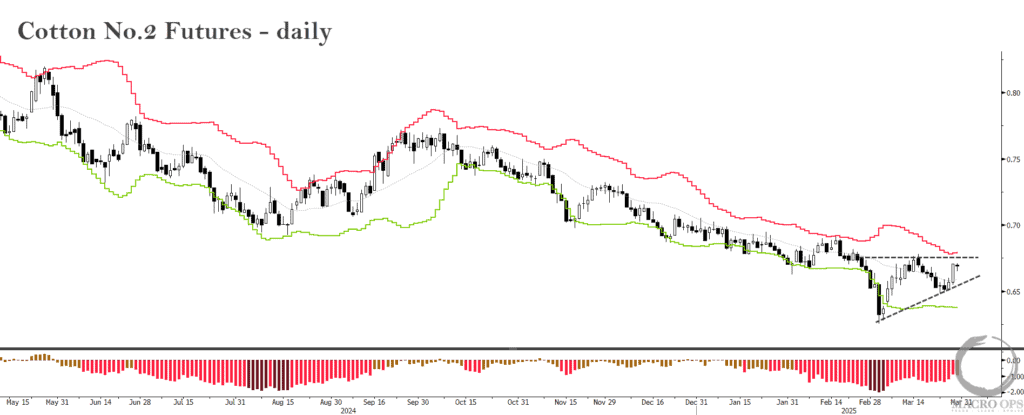
11. Cotton and coffee tend to be highly correlated but that correlation has recently broken down (h/t @AndreasSteno). We expect cotton to see some strong positive reversion soon, supported by the crowded bearish positioning, sentiment, and relative valuation that we noted a few weeks back (link here).
12. It may have put in a complex double bottom. We’re buyers on a breakout above its recent pivot high.
Join The Collective
Thanks for reading.