Key points:
- After falling into correction territory, the Nasdaq 100 rallied three straight sessions
- Similar patterns saw the NDX 100 advance, although results did not exhibit significance
- The S&P 500 also rallied for three consecutive days from a low, suggesting a rally
Investors are likely offsides, providing fuel for a rally
The last few months were challenging for many investors, yours truly included, as technology—the market’s dominant leadership group—came under pressure. While the recent pullback was painful, a sharp rebound that catches investors positioned too defensively could be even more painful, given that stock markets spend more time rallying than declining.
The Nasdaq 100 fell 11.31% from its June 2 peak to its July 29 low, pushing the index into correction territory. Since then, the technology-heavy benchmark has rallied for three straight sessions. The last time it staged a similar three-day rebound from a correction low was in late March, and substantial gains followed.
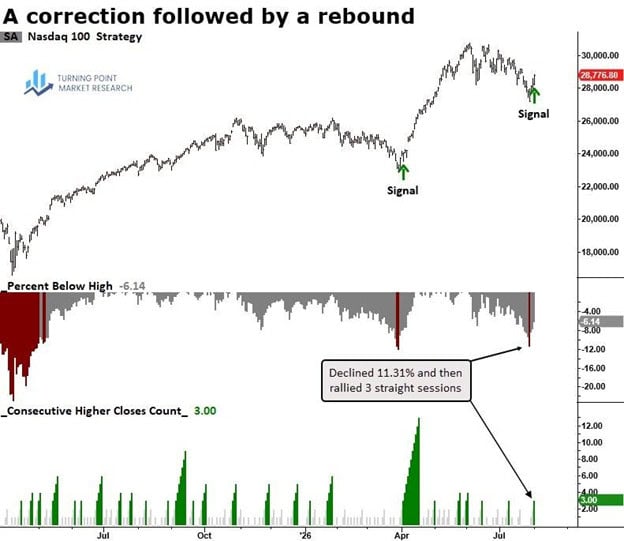
Our analysis identified 23 comparable instances since 1986, shown in the table below alongside additional metrics for context. The most notable feature of the current signal is the S&P 500’s proximity to its recent high, with the index down just 0.12%.
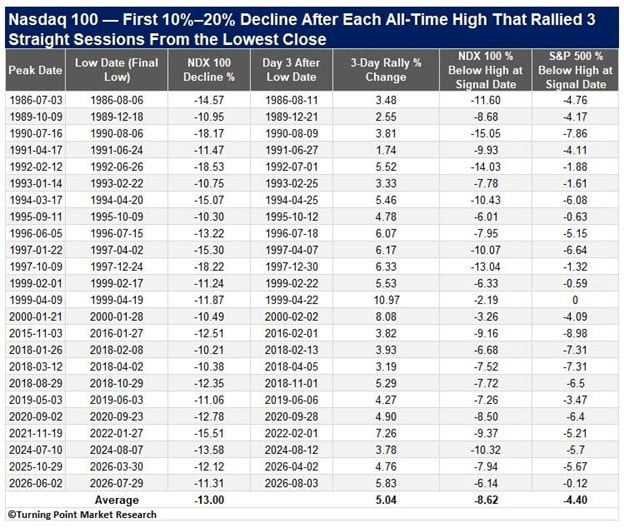
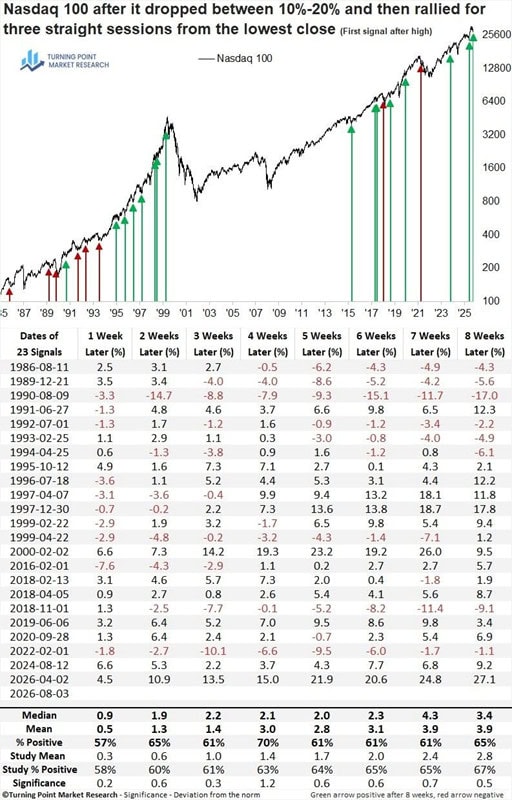
When these three-day rallies occurred following a correction, the Nasdaq 100 moved higher, although the results were more mixed compared to the baseline returns. The weaker outcomes were largely influenced by the 1986–1994 period, which was a challenging environment for technology stocks. By contrast, every Dot-com era instance was profitable eight weeks later, while the two signals during the AI era produced particularly strong results.
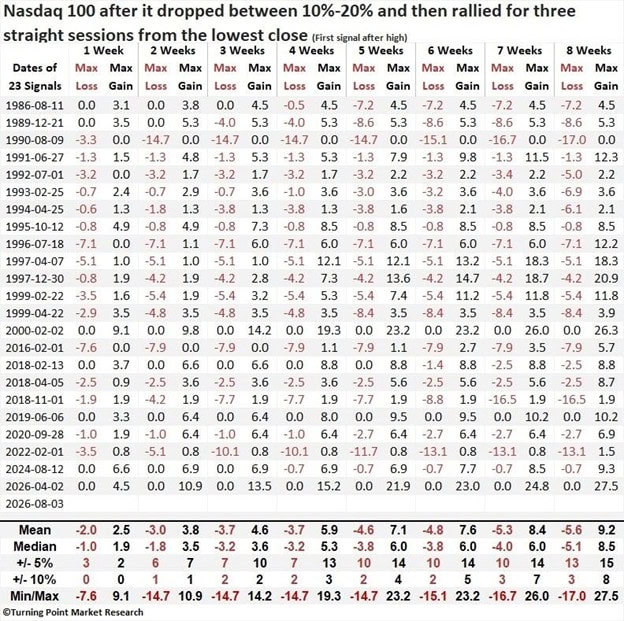
Over the following eight weeks, the Nasdaq 100 experienced a 10% maximum loss in three cases, compared with eight periods where it rallied more than 10%, suggesting a favorable risk/reward profile. The 5% threshold, however, produced a more balanced outcome.
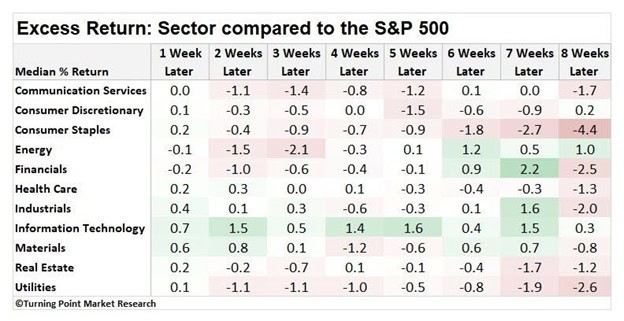
Applying the signals across S&P 500 sectors shows that technology produced the most consistent excess returns versus the broader index, outperforming across every time horizon analyzed.
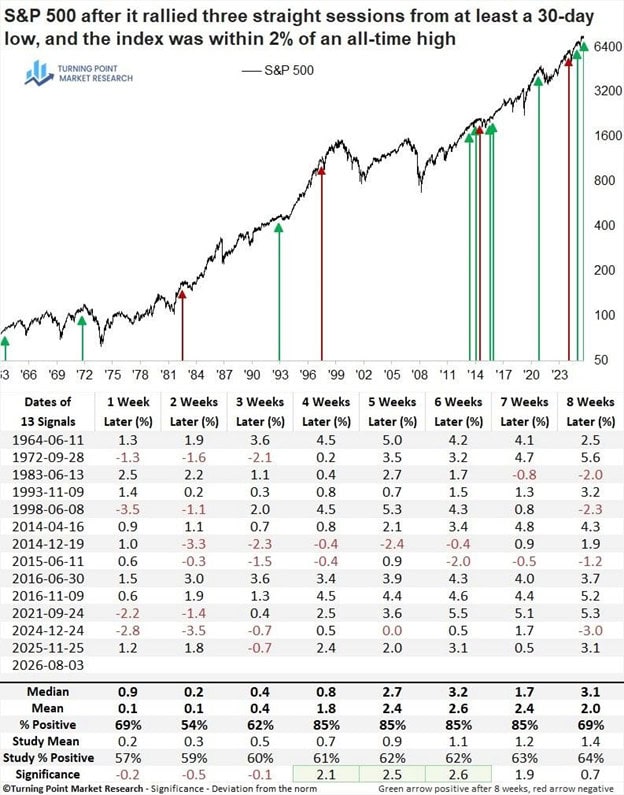
The S&P 500 also rallied for three consecutive days, although this advance occurred from a 30-day low rather than correction territory. A scan of similar three-day rallies occurring within 2% of an all-time high identified 13 prior precedents. Historically, these signals produced strong forward returns, suggesting the index’s current breakout may have further room to run.
What the research tells us…
The Nasdaq 100’s three-day rebound following a correction suggests the technology selloff may have run its course. The irony of market corrections is that they often create the fuel for the next advance, as investors who reduced exposure, ourselves included, are forced to reengage with leadership once momentum returns. We reduced cash to 11% today and will likely continue putting capital to work. Additionally, we will be monitoring our short-term Dual Trend systems for opportunities to reengage with AI-related stocks. After three decades studying markets, one lesson stands above the rest: respect what they are telling you. During periods like this, I often return to the wisdom attributed to John Maynard Keynes: “When the facts change, I change my mind—what do you do, sir?”