This is an excerpt from my May 2025 Long Pull Report for Macro Ops Collective members. We’ve been fortunate to capture most of this move in gold, as well as ride a few miners for some big wins (APM, MSA.V, and IDR, to name a few). It’s helped us generate ~28% YTD returns (as of June). We believe we’re in the early innings of a massive commodity/precious metals bull market. Moreover, the coming Market Regime is perfect for our tactical, Trifecta Lens trading approach.
If you’re interested in learning more about the Collective, our philosophy, and how we tackle markets, click the link below to join. Spots are filling up and we’d love to have you in there.
Alright, onto the piece.
It’s been seven months since I wrote a gold market update (read it here). So much has happened since then, and we still have significant PM exposure in the portfolio, so I wanted to share my thoughts on the space, how I’m thinking about our thematic exposure, and how this bull market compares to historical gold/miner bull runs.
Let’s get after it.
Gold: Short-term Mixed; Long-term Strong
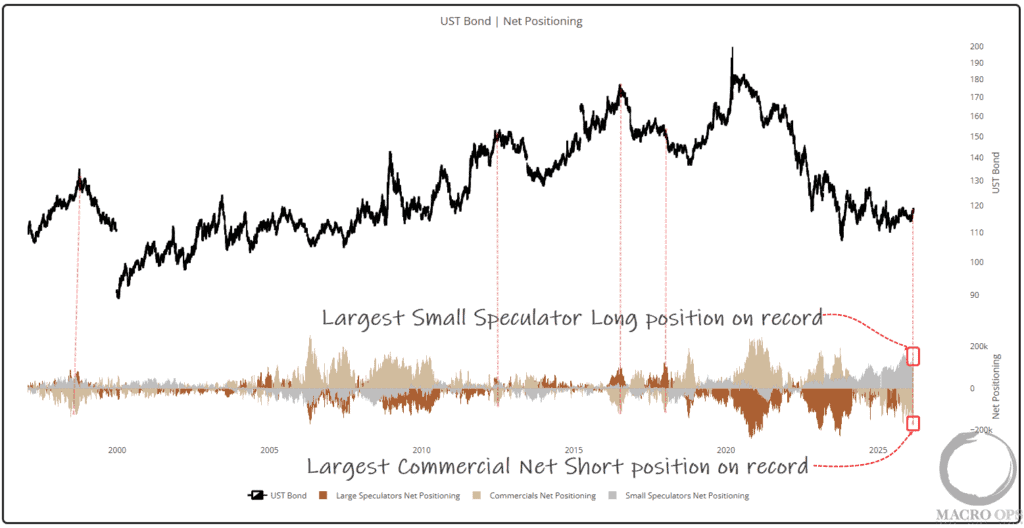
Here’s gold’s latest CoT data.
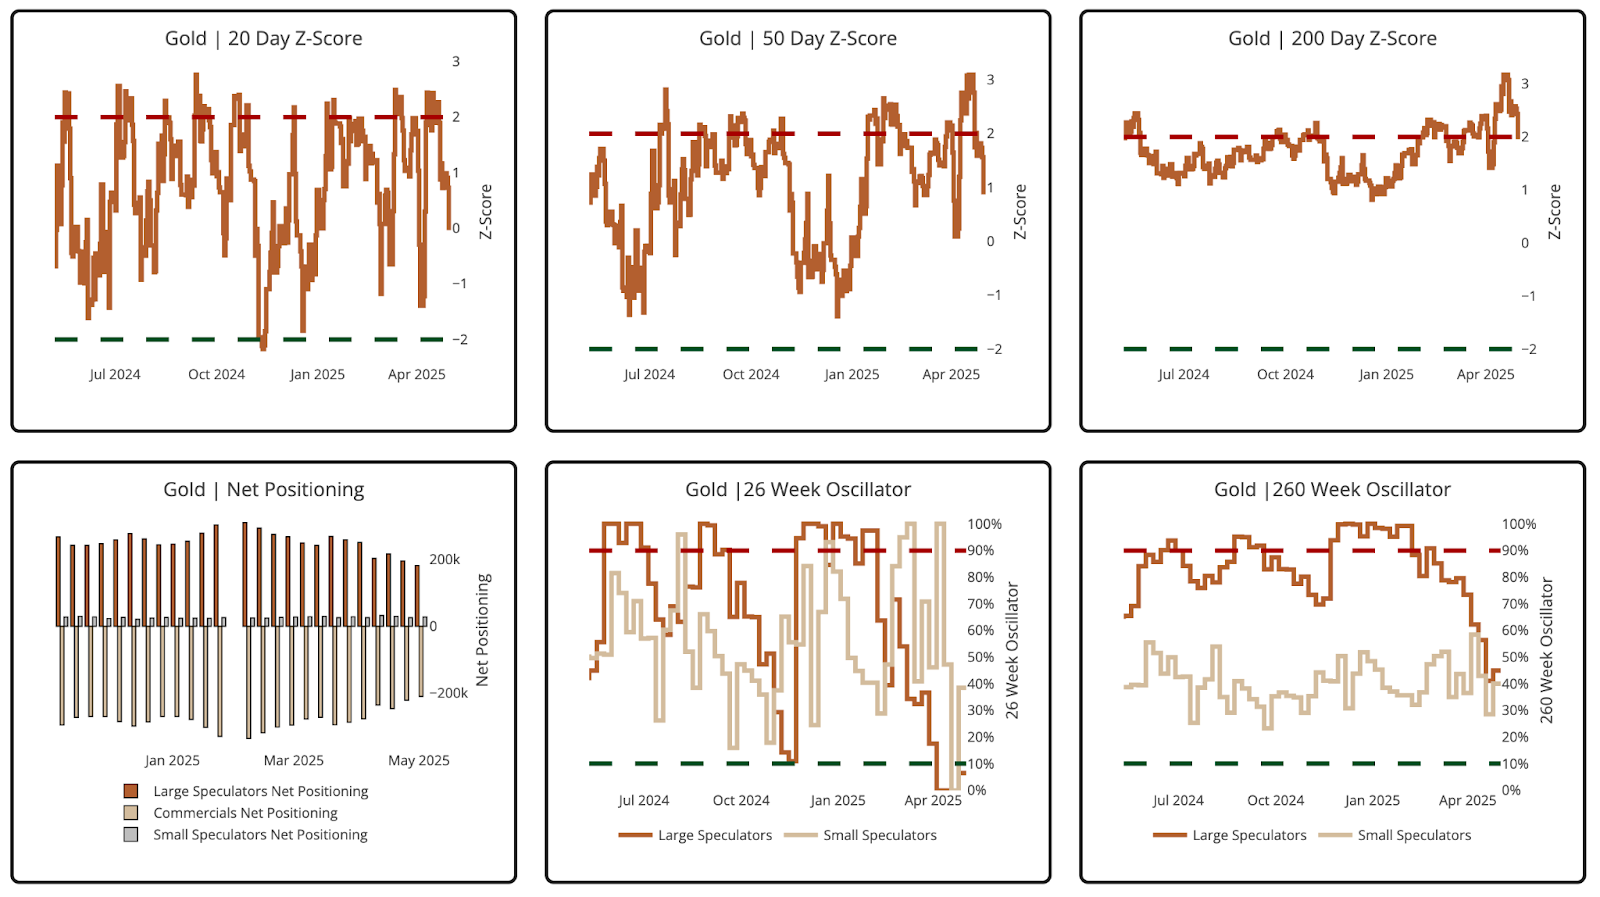
A few notes:
- The price remains overextended against the 200D MA, but relatively modest compared to the 20D and 50D.
- Large Specs have reduced their net long exposure from 310K contracts in February to 182K as of May 7.
- The recent consolidation around $3,000/oz puts gold back in Bullish Territory on the 26W Oscillator Index (<10%).
It’s a mixed bag. Yes, it’s overextended, and we’re in a Blended Bull Quiet/Volatile regime. But Large Specs aren’t that long, either. I don’t have conviction in either direction, and that’s okay.
Seasonality data also suggests we’ll trade sideways throughout the summer (see below).
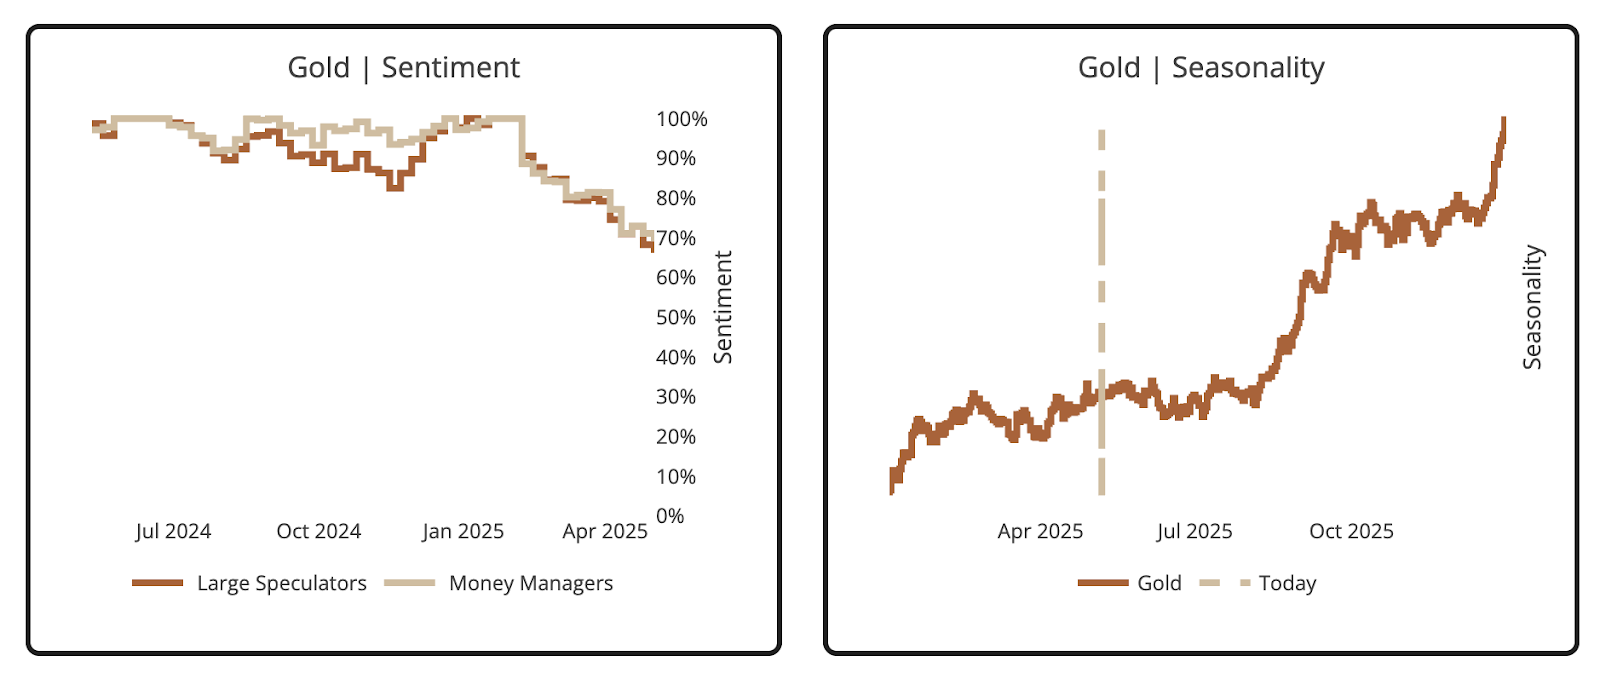
In a perfect world, gold trades sideways through July while the miners play catch-up (lol), before breaking out in Q3 and making a run for $4,000/oz. At least that’s how the tape looks today (see below).
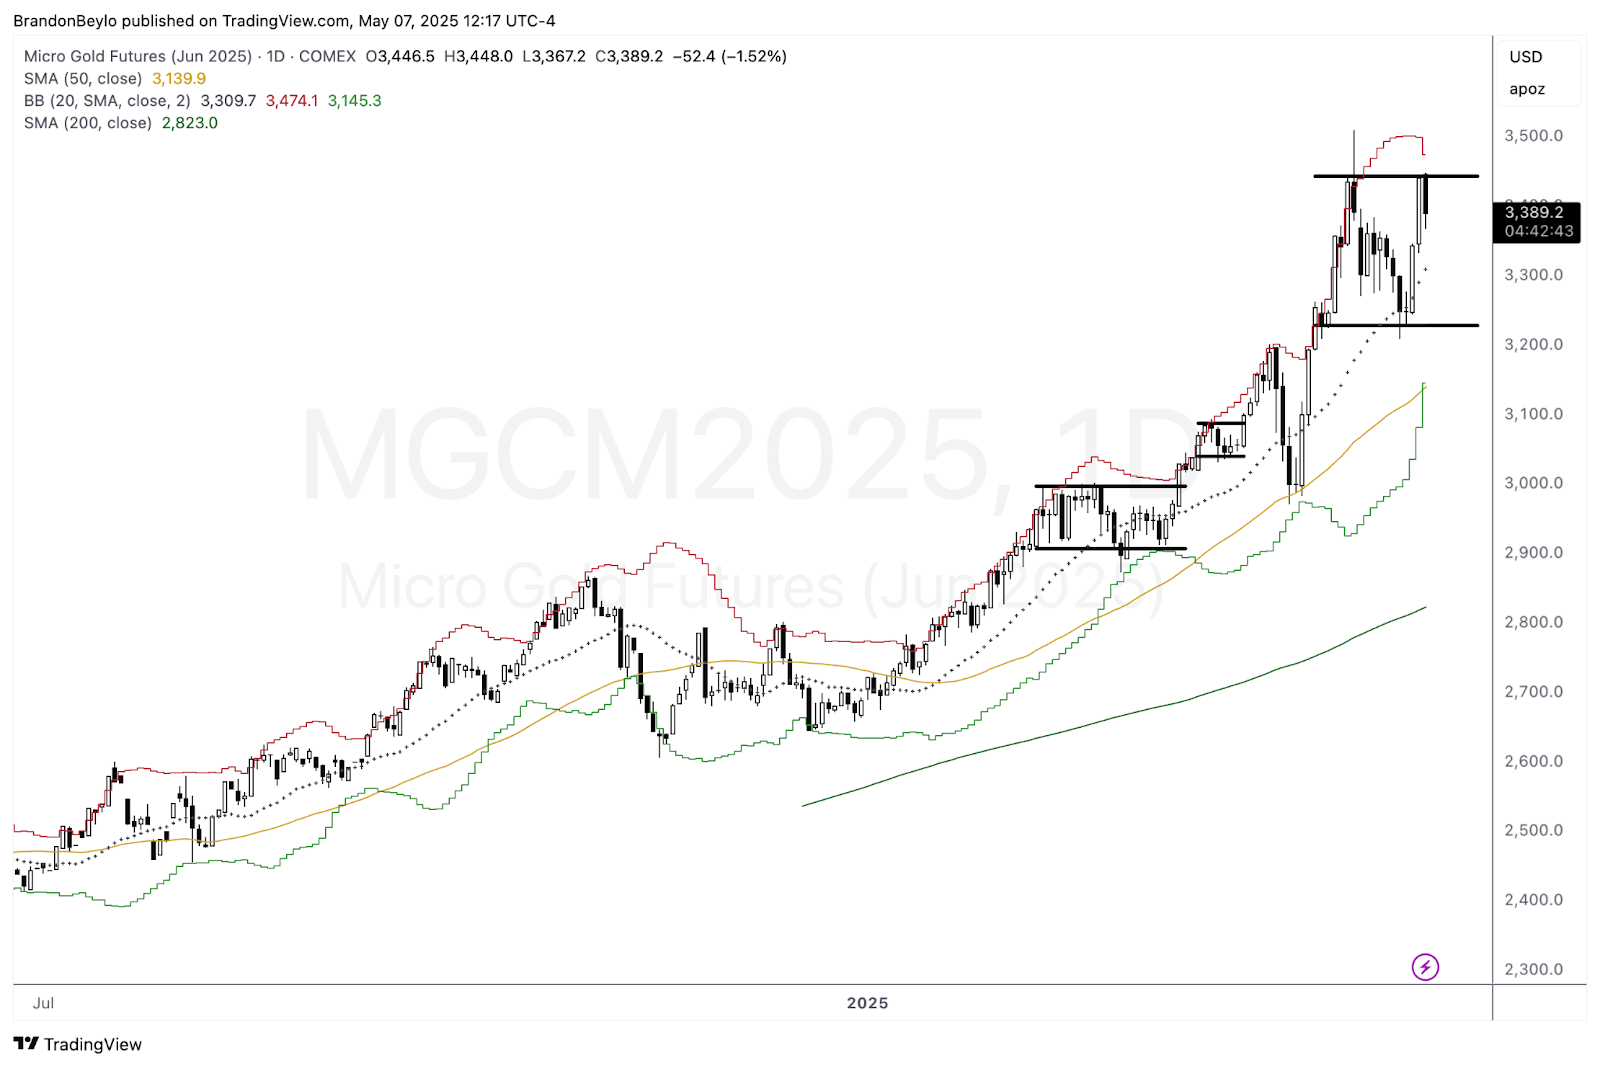
I’ll leave the mean reversion advice to Chris D, but this range looks optimal for selling rips and buying dips around a core long position.
What about the gold miners?
Gold Miners: A Quiet Bull Market
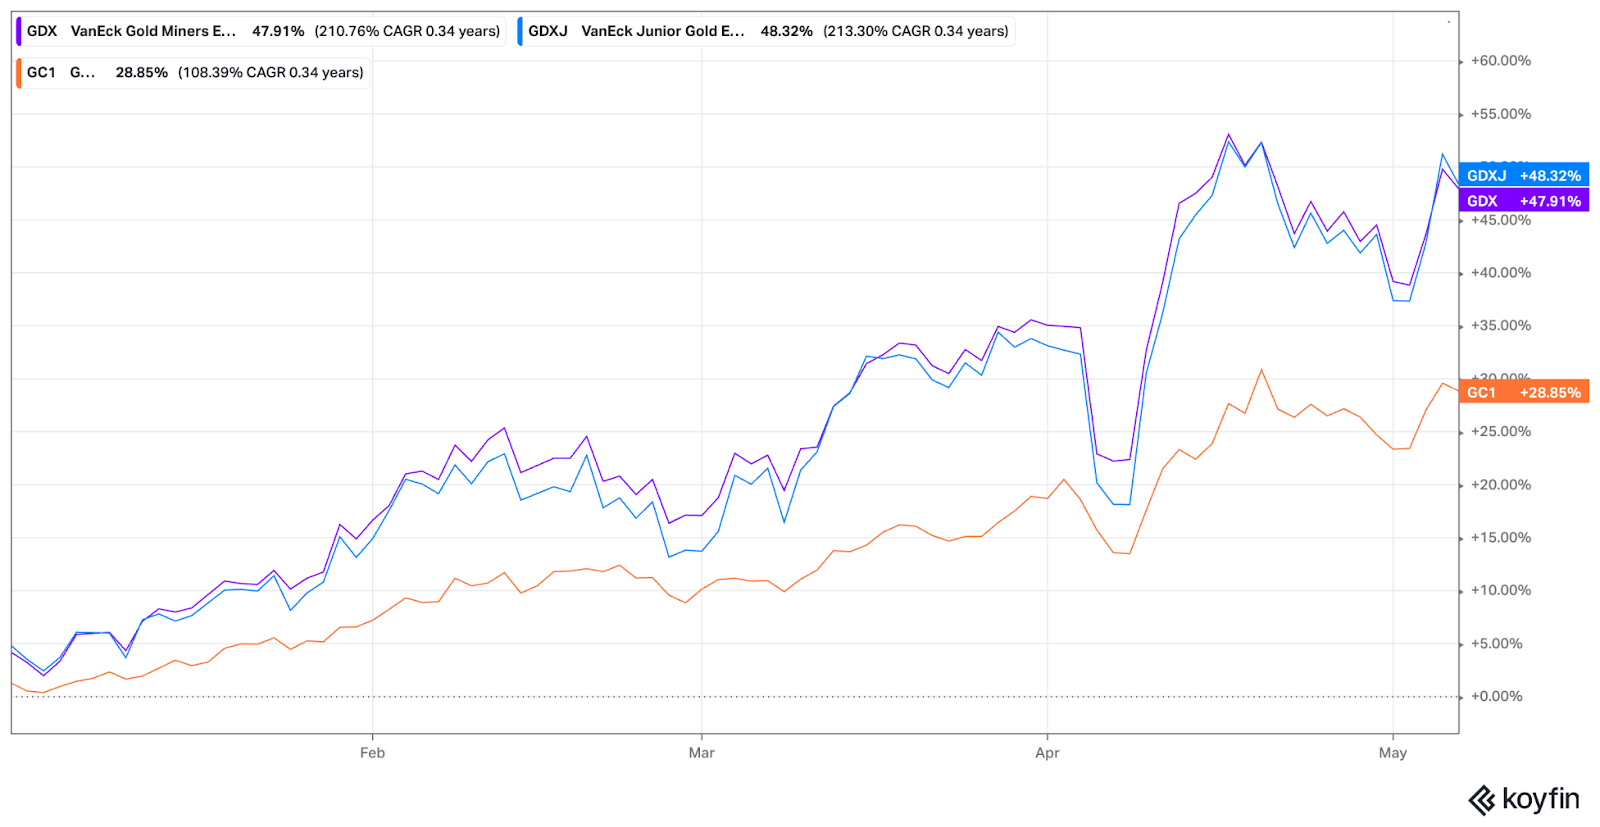
We’re finally seeing a bull market in gold miners. On a YTD basis, the GDX and GDXJ are up 48% and 48.32%, respectively, outpacing gold’s 29% return during the same period (see below).
And it looks like we’re still in the early stages of the move. Check out the GDX monthly chart below.
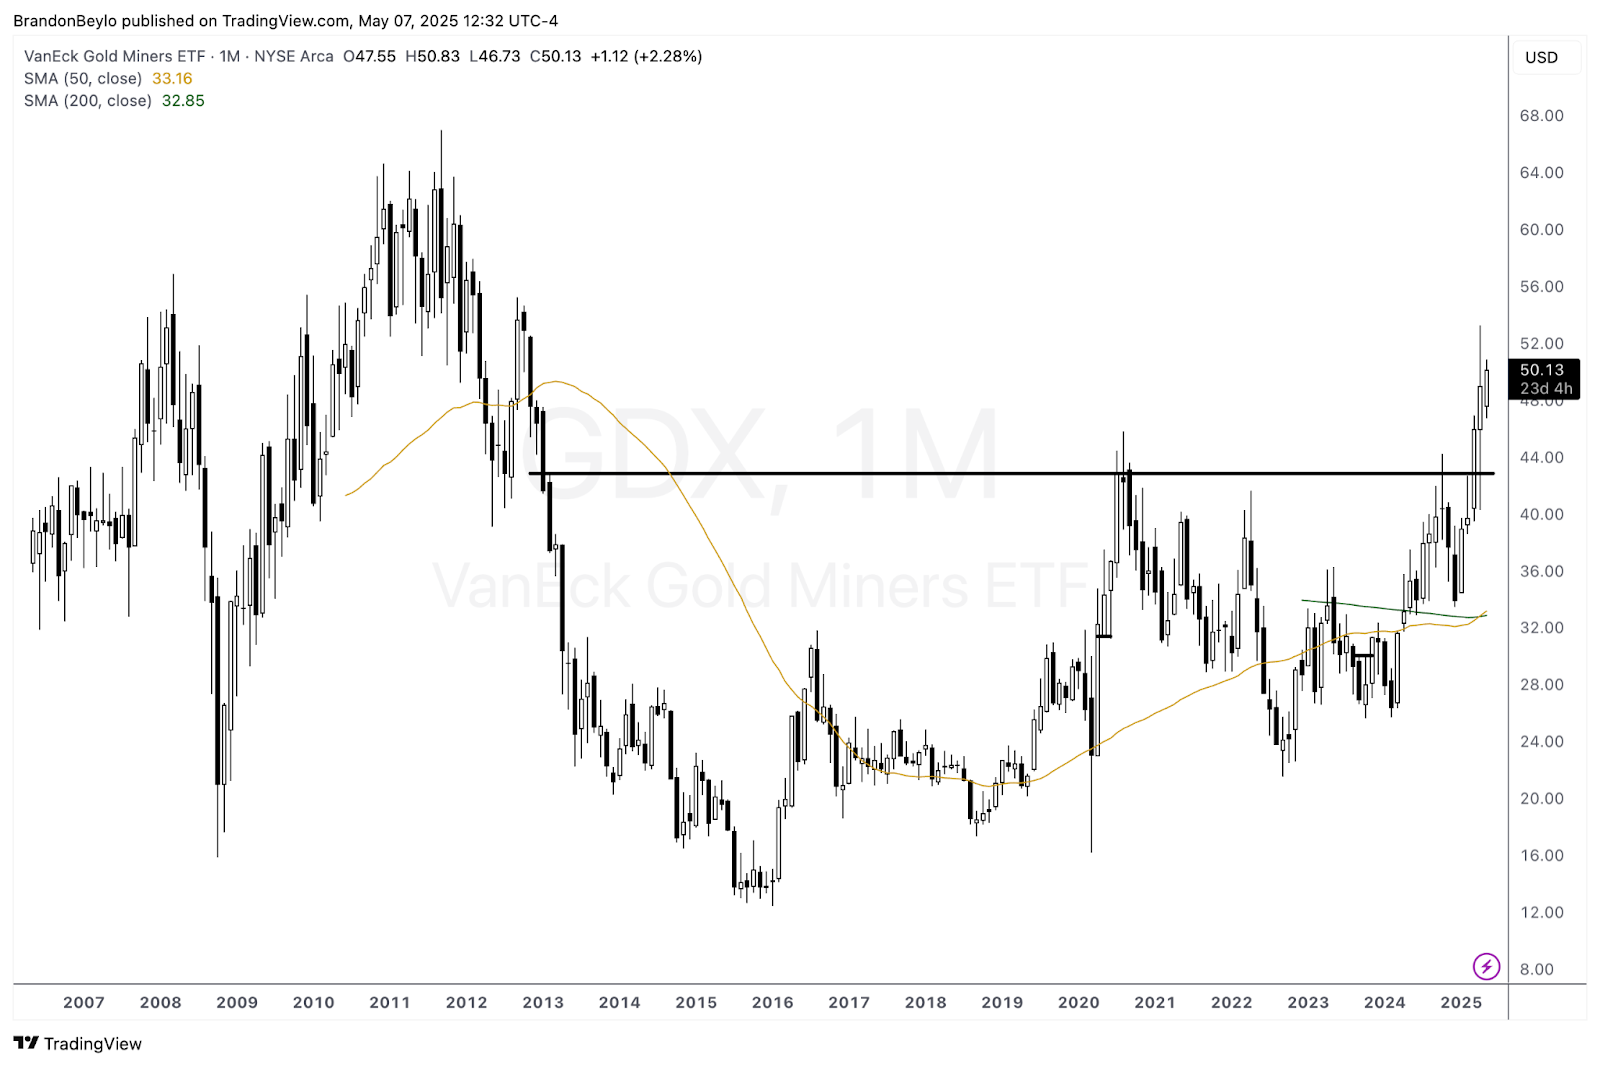
The confirmed cup-and-handle breakout has a measured move target of $73/share, or ~70% above today’s price.
Also, retail/institutions still haven’t participated in the move. Check out the rolling 1M Fund Flows data from Koyfin below.
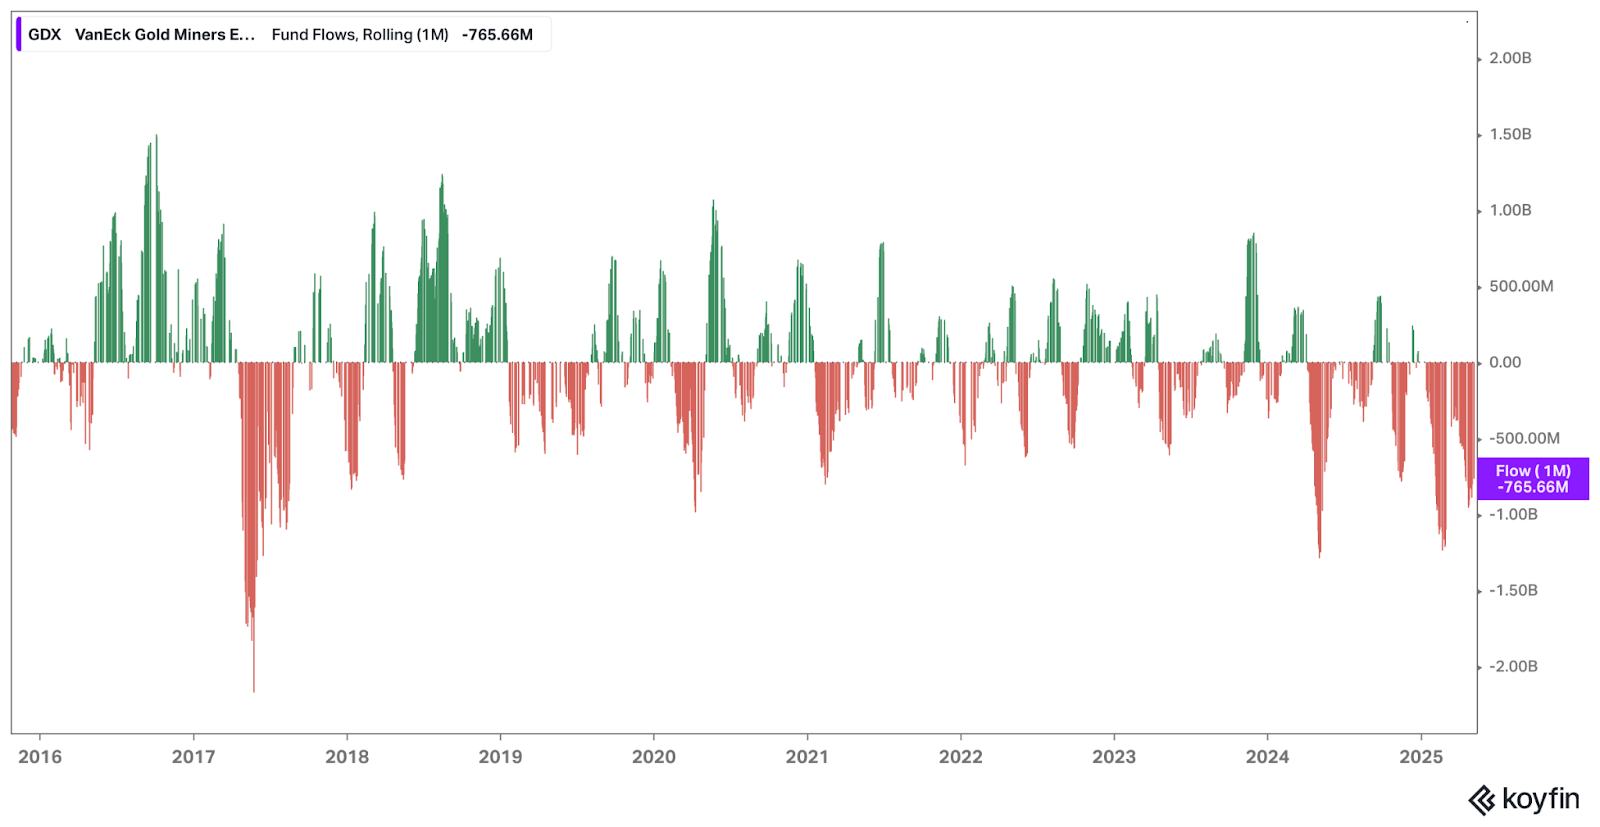
Imagine the price action if we get another 2016-style rush into GDX.
Then there’s the GDXJ, which has an even better long-term chart than GDX (see below).
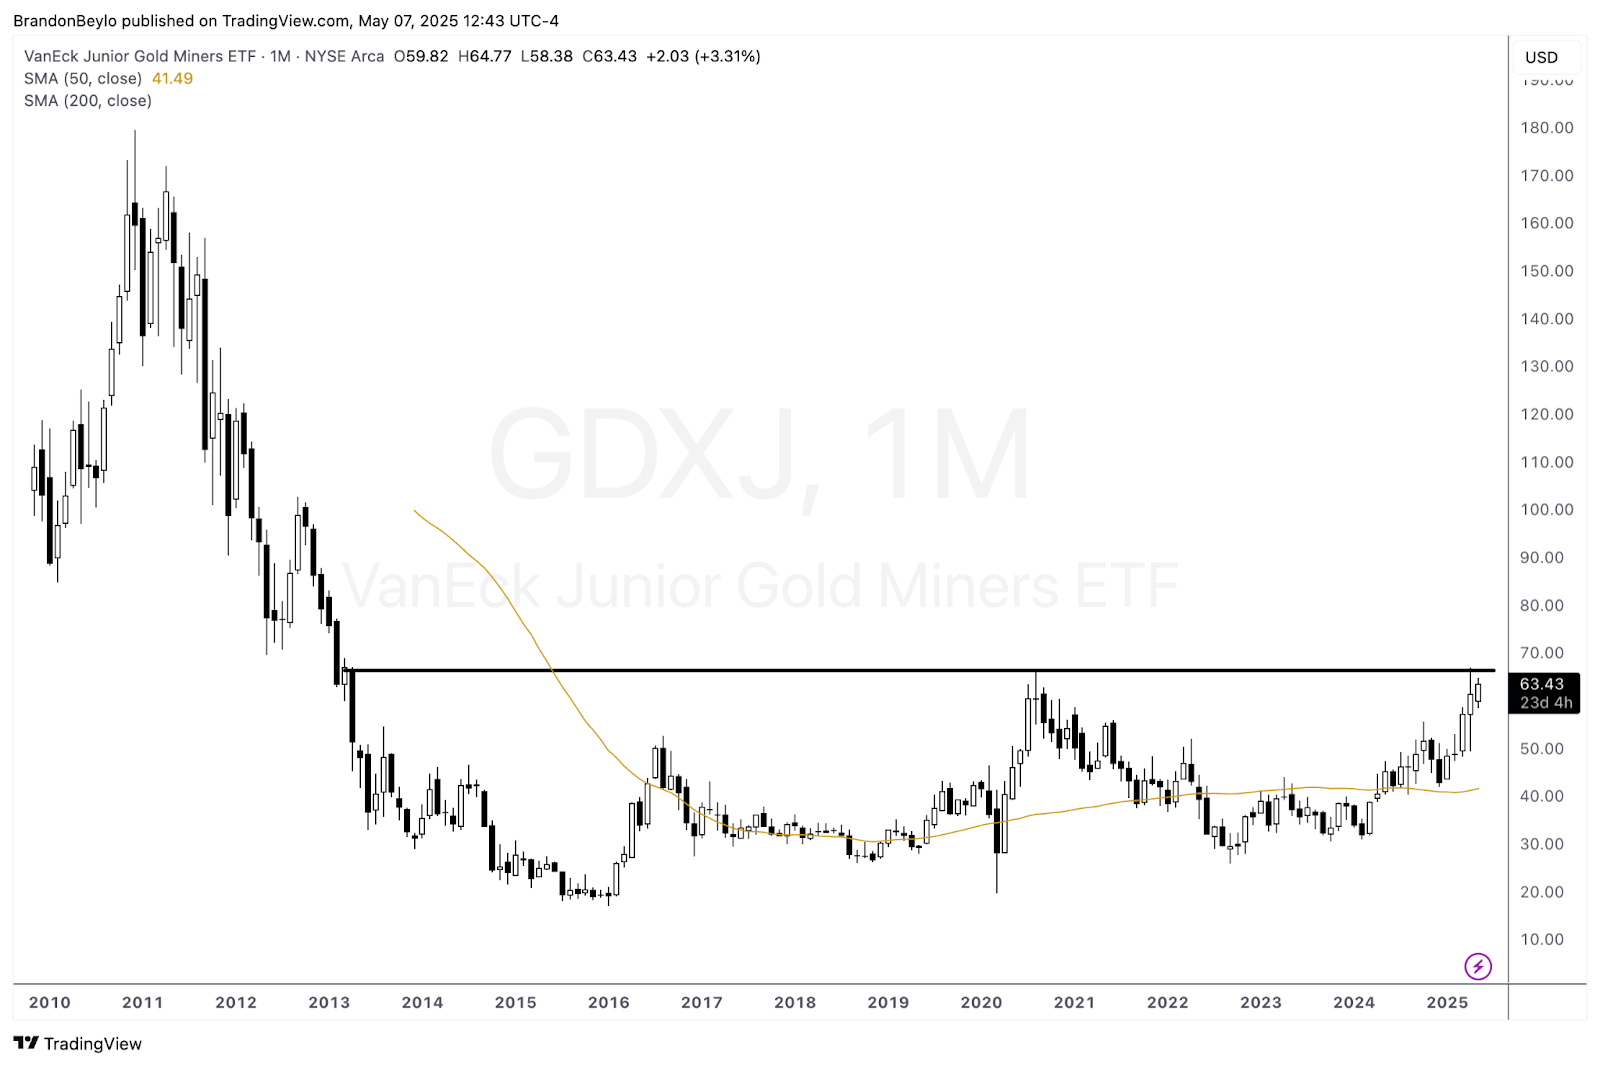
GDXJ has a measured move of $112.85/share or ~71% higher than the cup-and-handle neckline.
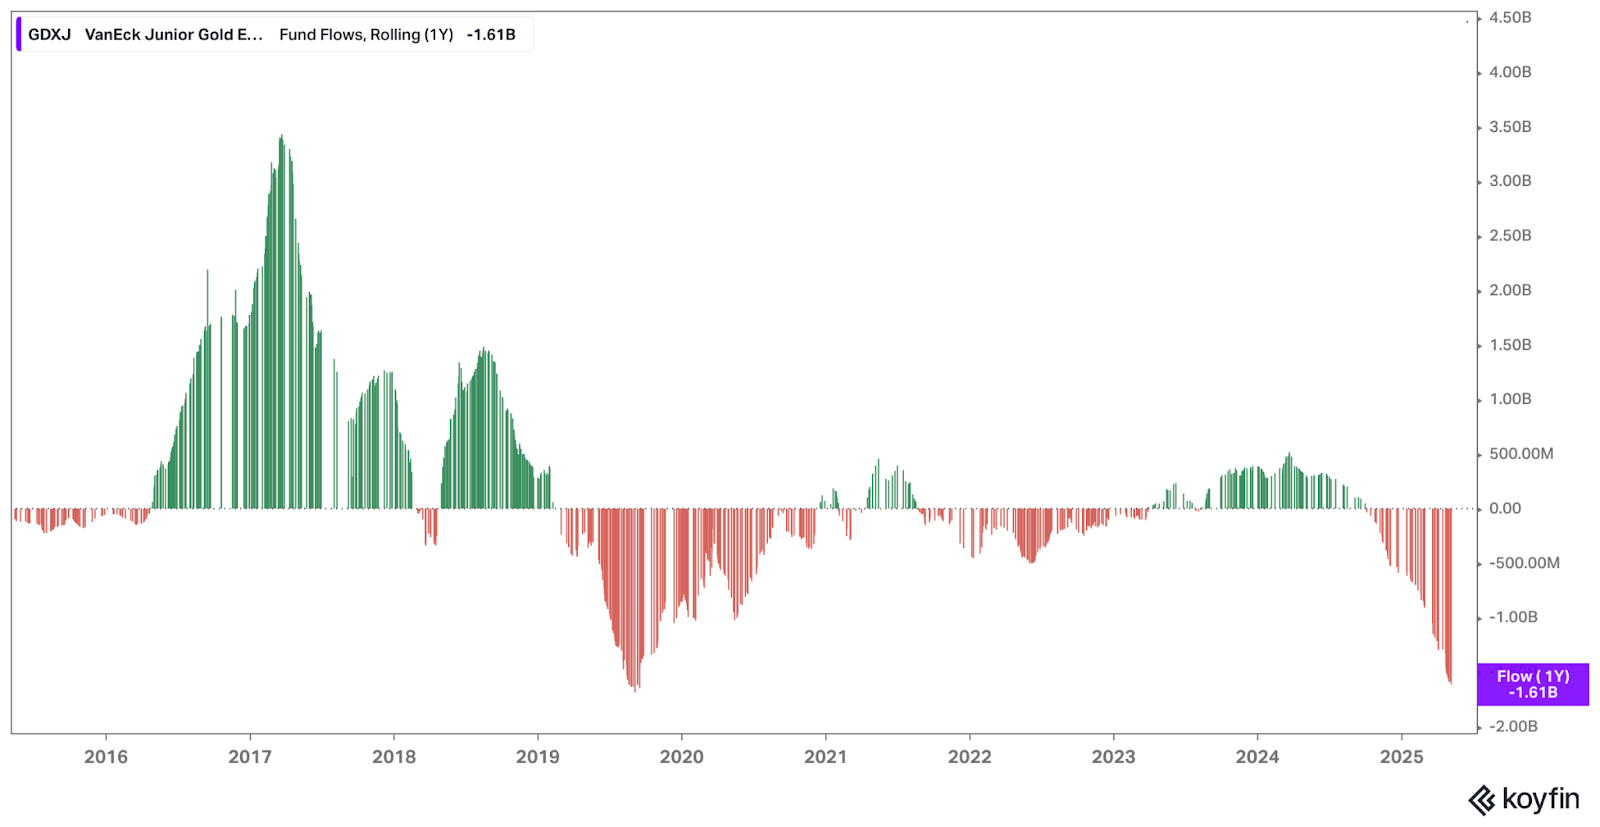
Fund flows are even worse for junior miners, too.
The Long-Term Setup Remains
The long-term setup in gold is strong. We have:
- A supportive commodity price at levels allowing massive free cash flow generation.
- Monthly breakouts in both GDX and GDXJ.
- Record-cheap miner valuations.
- Billions of dollars waiting to buy miners because it’s the only thing that’s worked lately.
Miners have underperformed gold over the past year, but that’s changing. Which got me thinking … how have prior gold bull markets developed? What’s the average gap between gold’s return and the miners?
Let’s end with an overview of the history of gold bull markets.
Gold Bull Markets: Studying The Lag
The TL;DR: Gold miners typically lag gold prices by 1-2 years in bull markets before beginning a period of significant outperformance. This pattern has been observed across multiple gold bull markets, though the current cycle has shown a more prolonged lag than historical precedents.
I examined three gold cycles:
- 1970s Bull Market
- 2000s Bull Market
- Current (2018s – ) Bull Market
Each of these cycles displayed similar characteristics.
First, in the 1970s and 2000s bull markets, there was typically a 1-2 year lag from the beginning of the gold bull market before miners began consistently outperforming.
Second, miner outperformance often accelerates after gold experiences a period of consolidation following its initial move. This makes sense because it gives gold producers time to digest the price move and benefit from the higher commodity prices through margin expansion and free cash flow generation.
Third, mining stocks tend to show their strongest relative performance during periods of broader market weakness or economic uncertainty. During the stagflationary 1973-1974 market, the BGMI rose 376% while the S&P 500 fell 34%. Again, this makes sense because investors always play the “what’s working lately” game and won’t invest in gold miners until they’re sure they’re outperforming everything else.
All this is to say that the lag between the miners and the spot price is normal, even if this cycle takes longer than expected. So here’s my game plan: stay patient, anticipate multiple 20%+ drawdowns, and hold my high-conviction names as long as technicals, sentiment, and fundamentals support my thesis.