[The] principal characteristic of a bear market is very sharp down movements followed by quick retracements… In a bear market, you have to use sharp countertrend rallies to enter positions. ~ Bruce Kovner
Click here to get the Dirty Dozen straight to your inbox every Monday morning
Good morning!
In this week’s Dirty Dozen [CHART PACK] we look at the very precarious spot in which the global economy now sits, comb through the balance sheets of corporates, countries, and households. Check out some positioning and flow data and finish with a look at US GDP projections. Let’s dive in…
***click charts to enlarge***
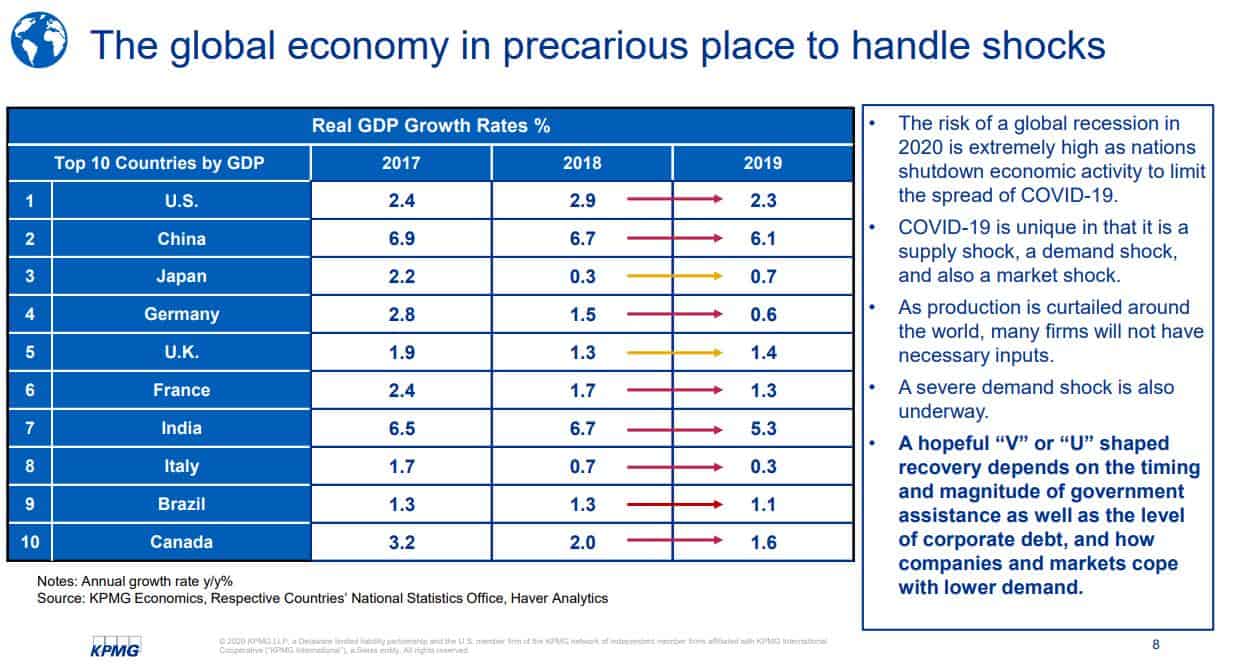
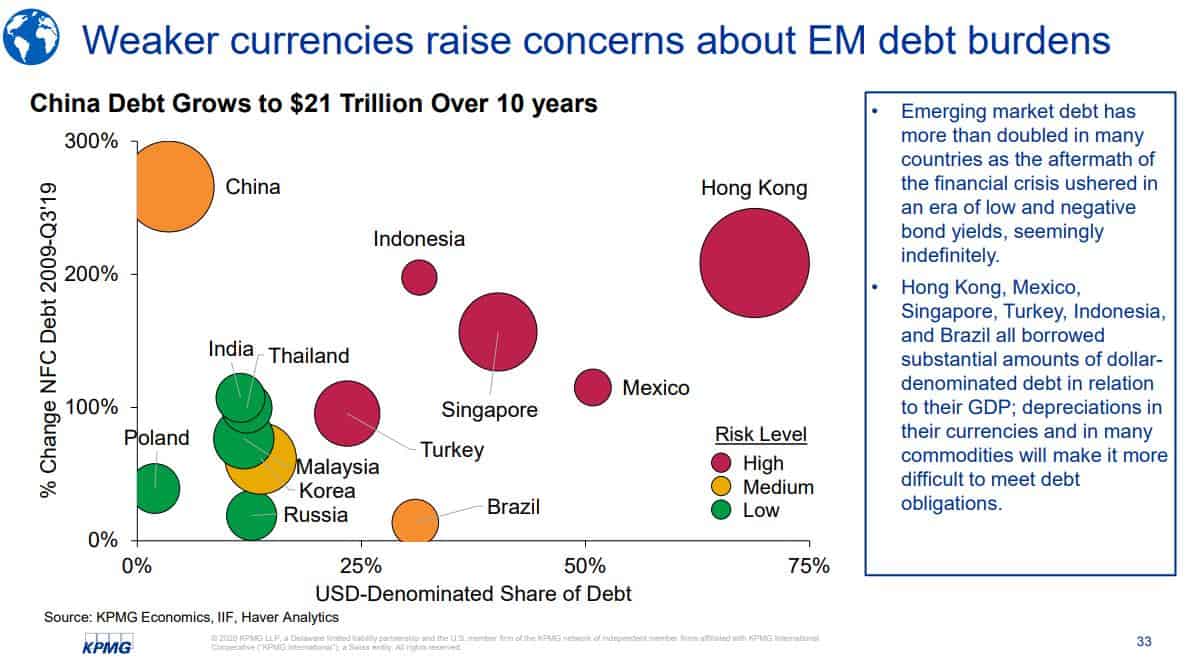
- KPMG published a great slide deck on the economic risks posed by COVID-19. Here’s the link to the deck and a few of my favorite slides below.
As the title of the chart states, the global economy isn’t exactly meeting this virus on a strong footing.
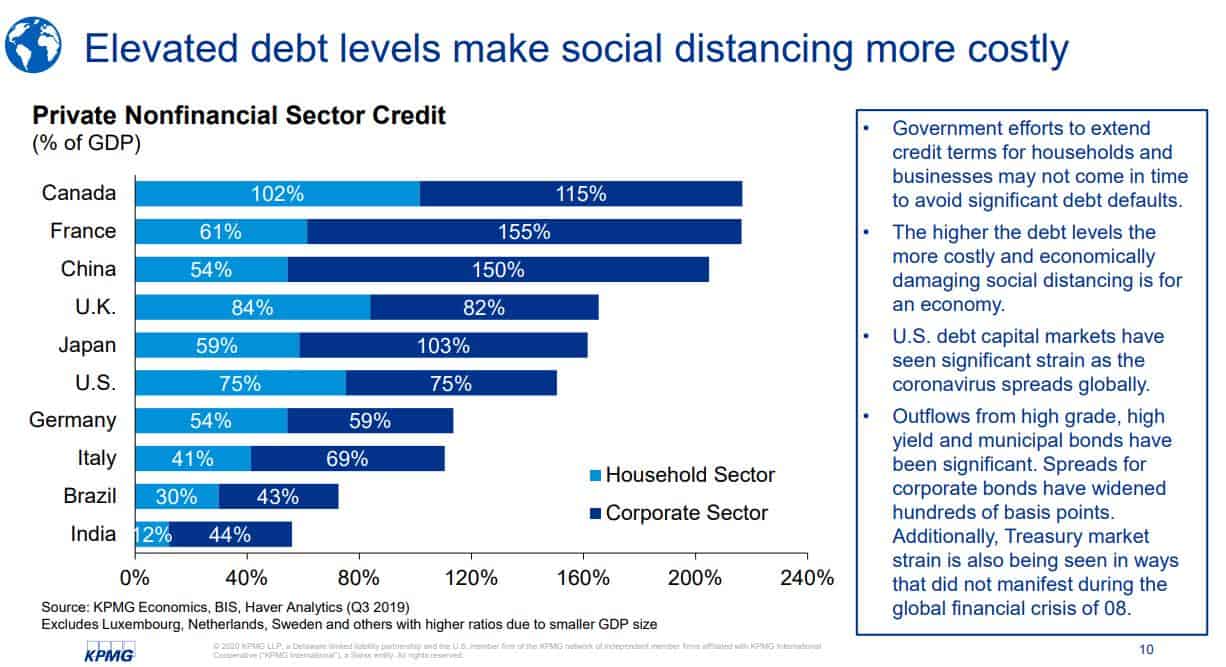
- The record levels of debt globally make this a particularly capricious time to have to deal with widescale shutdowns of the global economy.
- And it’s not just that we’re extremely leveraged but US households are also very cash poor, with nearly 40% of US adults unable to cover a $400 expense.

- The interconnection of over-leveraged asset poor balance sheets dramatically raises the risks of credit cascades in the near future. Watch out for Fallen Angels…

- Emerging markets are in an even weaker position where a risk-off environment is leading to capital outflows and lower local currencies against the US dollar, of which much of their debt is in. This is creating an EM doom loop where a falling exchange rate leads to more expensive debt leading to more outflows ad Infinium…
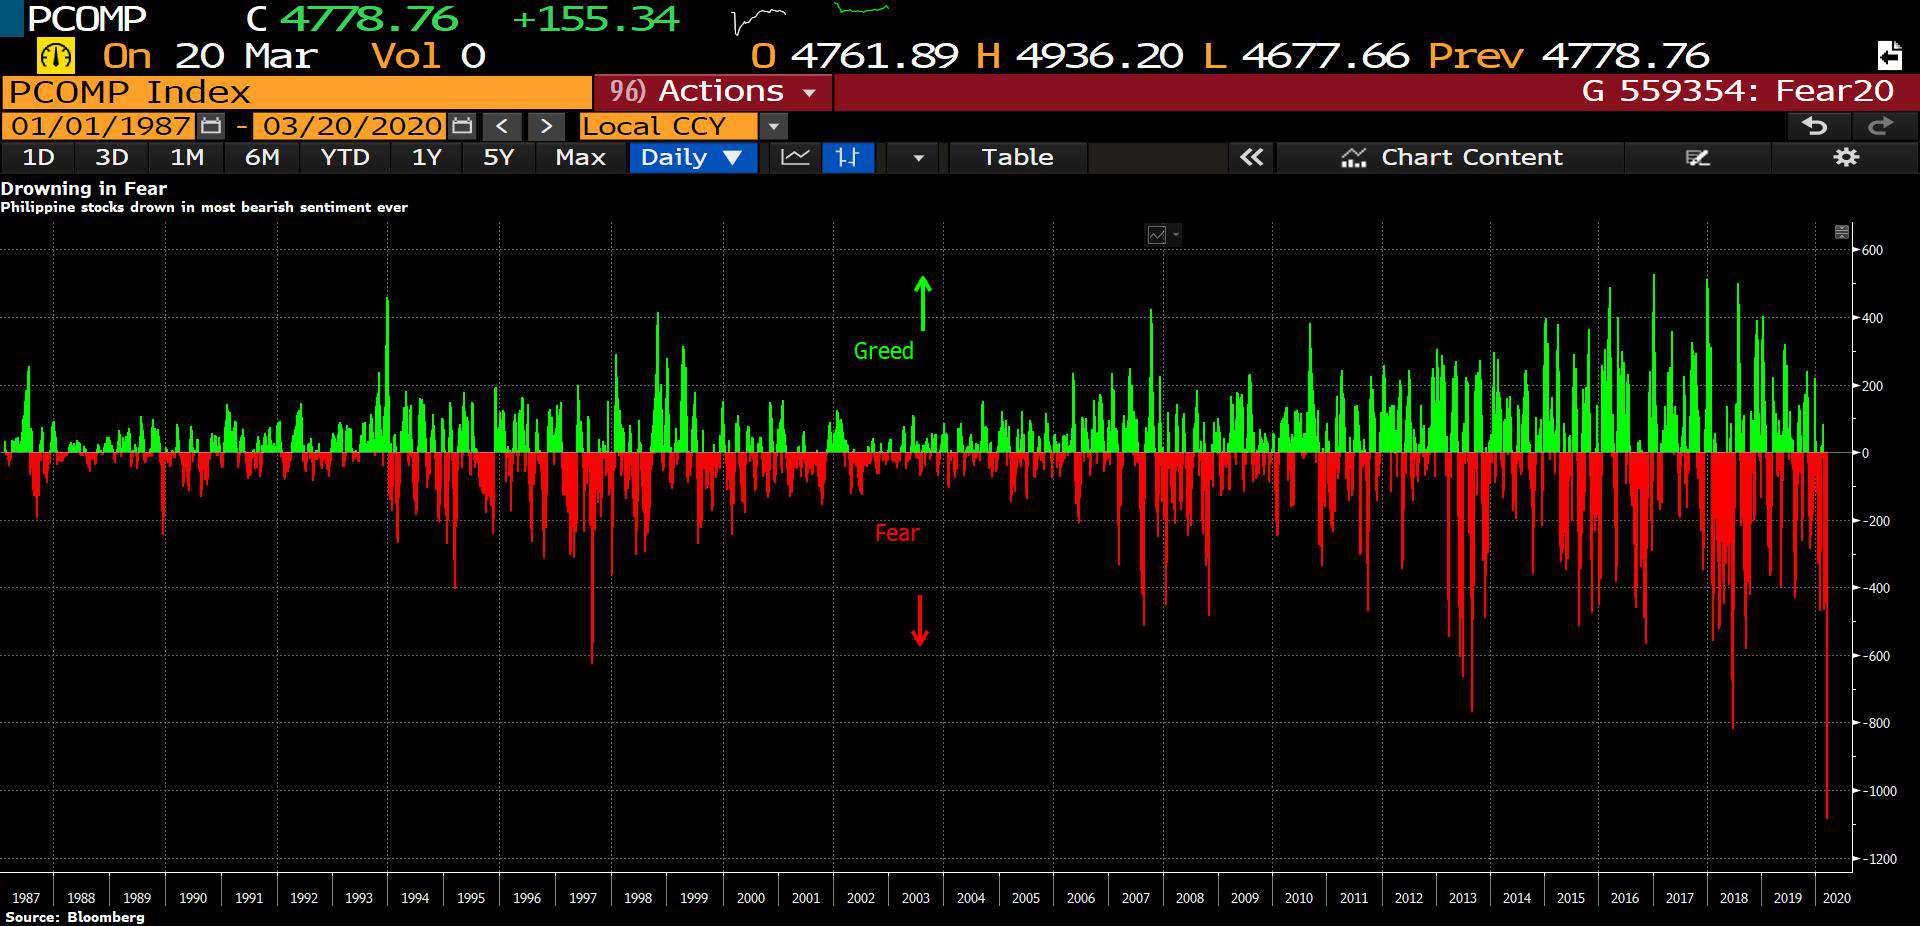
- EM outflows are hitting truly extreme levels. The chart below shows fund flows out of the Philippines index (chart via Bloomberg).
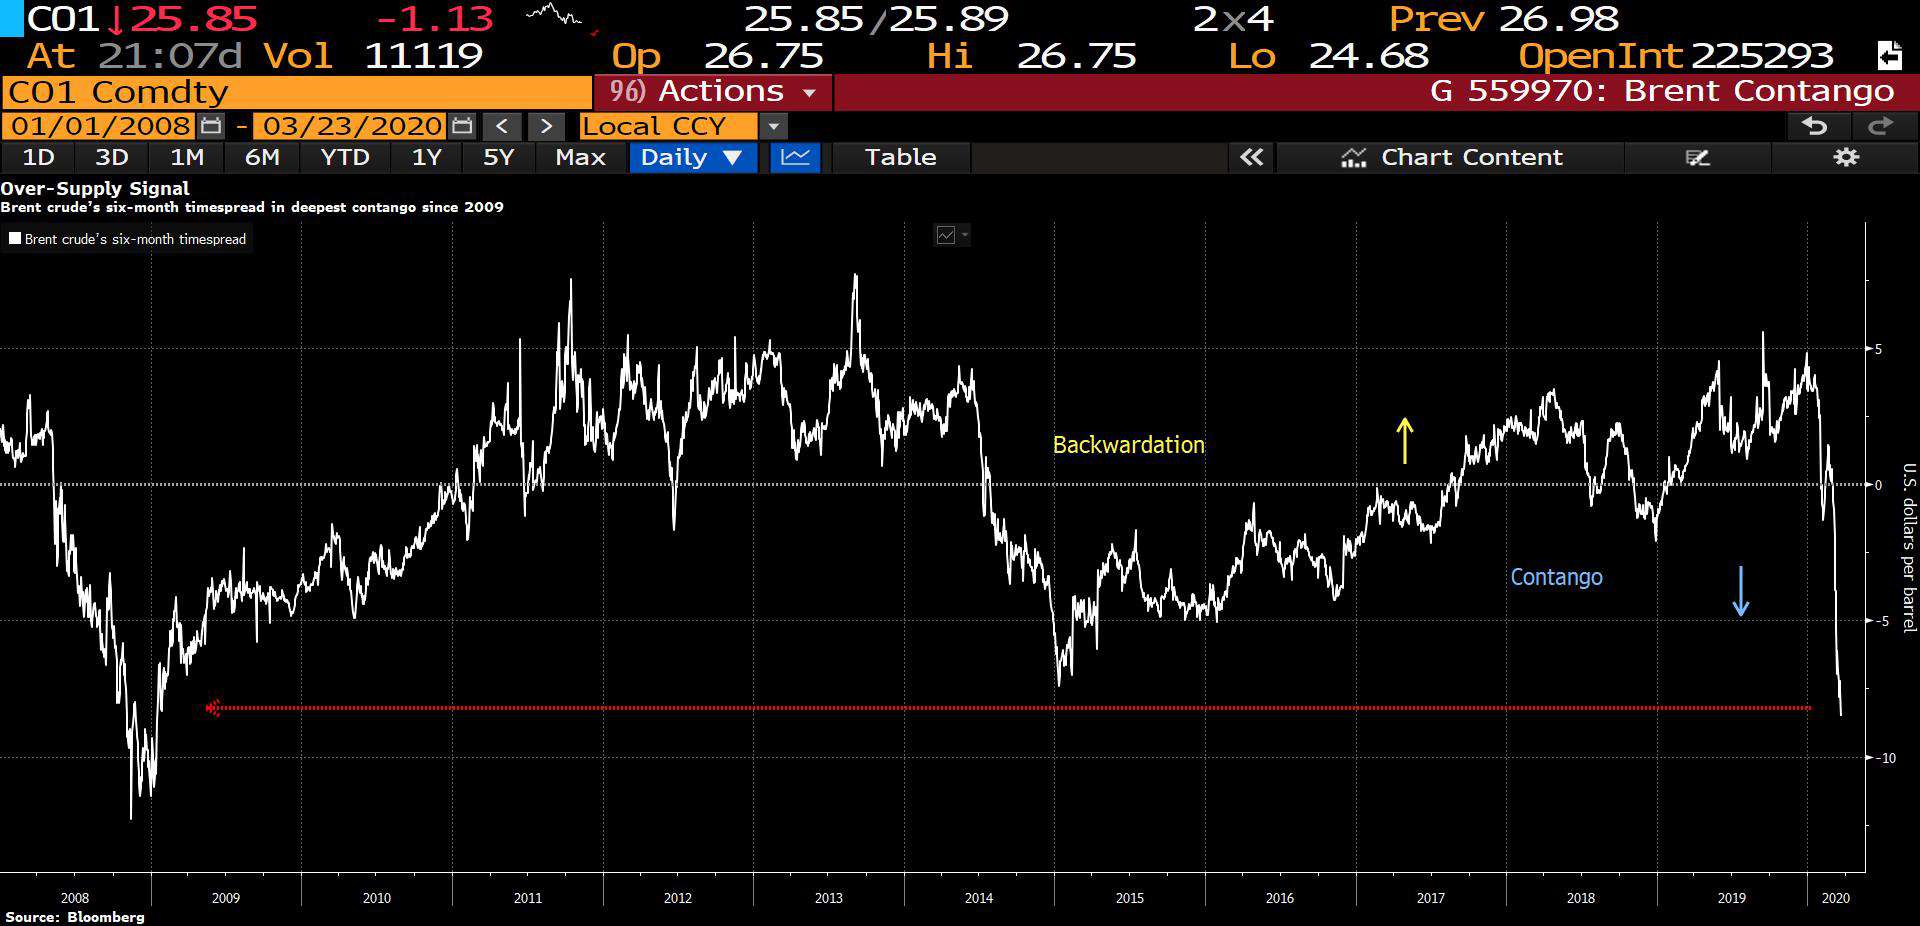
- With crude toeing the line with pricing in the teens, the Brent curve is now in its deepest contango since 09’. Give this read from our friend Kuppy over at the Adventures In Capitalism blog to find out what this means for tankers (hint: it means a lotta money).Chart via Bloomberg.
- Here’s the latest CoT positioning z-scores (chart via Bloomberg).

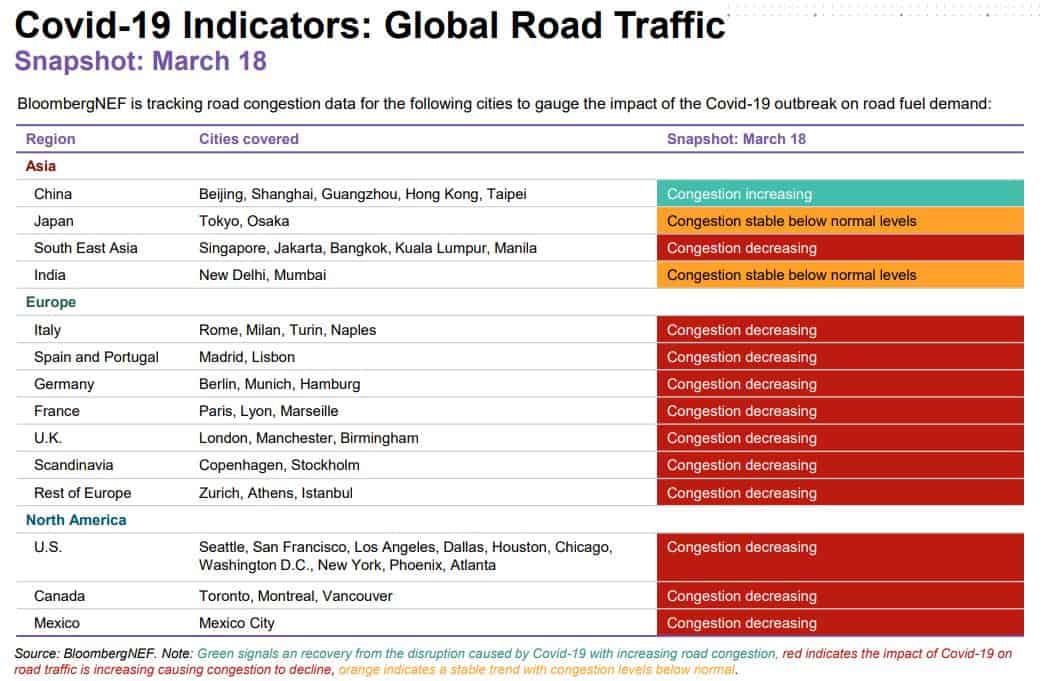
- The forced shutdowns across the world are driving traffic lower and hence oil/gas consumption (chart via Bloomberg).
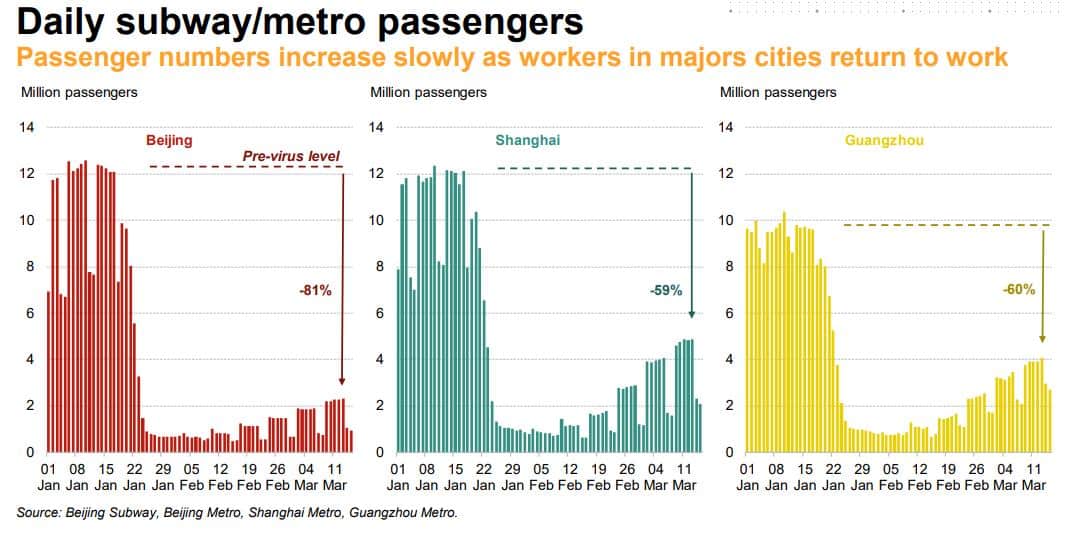
- The only bright spot is China who is a couple of months ahead of the rest of us in their response to the virus (chart via Bloomberg).

- But, there’s still a long ways to go before things return back to normal (chart via Bloomberg).
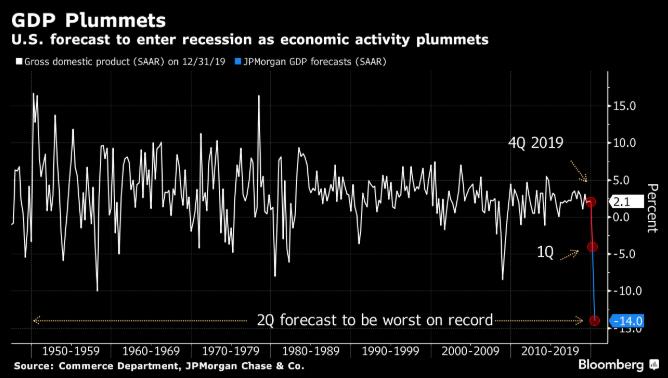
- JP Morgan’s GDP forecasts projects Q2 GDP in the US to be the worst on record. Goldman Sach’s forecasts QoQ annualized growth rates of -6% in Q1, -24% in Q2, +12% in Q3, and +10% in Q4, for a full year growth rate of -3.8% on an annual average basis and -3.1% on a Q4/Q4 basis.
Click here to get the Dirty Dozen straight to your inbox every Monday morning
Stay safe out there and keep your head on a swivel!