
The investment process is only half the battle. The other weighty component is struggling with yourself, and immunizing yourself from the psychological effects of the swings of markets, career risk, the pressure of benchmarks, competition, and the loneliness of the long-distance runner. ~ Barton Biggs
In this week’s Dirty Dozen [CHART PACK] we look at investment fads throughout the decades before discussing the *ahem* slight optimism over tech stocks… and then take a look at the valuation metrics for the broader market, talk about what Europe has given to investors over the years, take a peek at EURUSD, and end with a look at bonds, plus more…
Let’s dive in.
***click charts to enlarge***
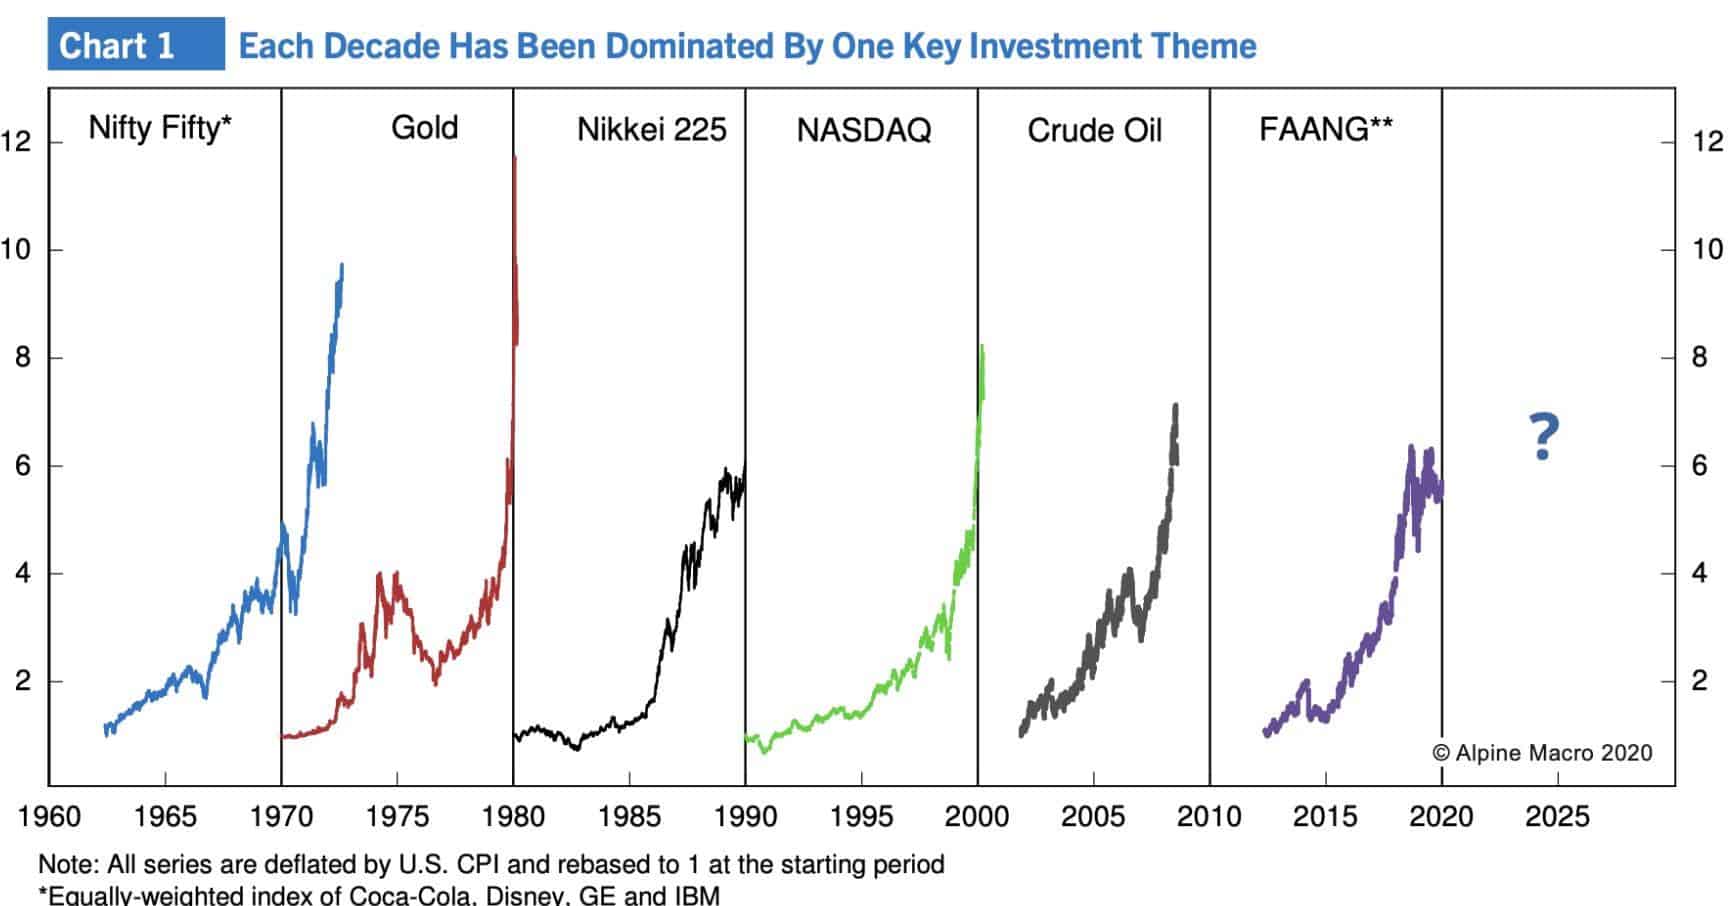
- Every decade has its trendy investment theme. In the 60’s it was all about the Nifty Fifty, then gold in the inflationary 70s, Japanese stocks in the 80s, tech in the 90s, oil in the 00s, and of course FAANG today. Will FAANG continue its dominance into the new decade or will we see a new theme emerge? Chart via Alpine Macro.
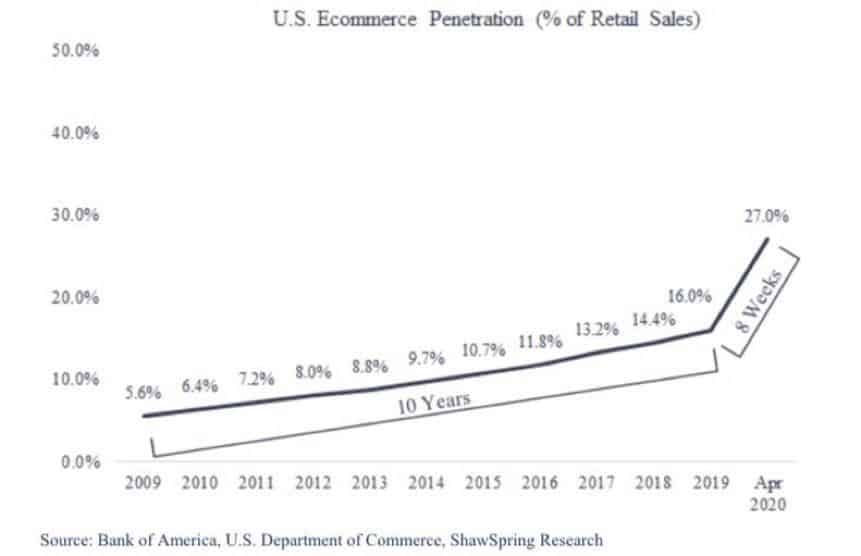
- The thematic has certainly received a helping hand from the pandemic which has forced everyone’s consumption to move to the virtual space. This chart from BofA shows the hockey stick growth in e-commerce as a % of Retail Sales.
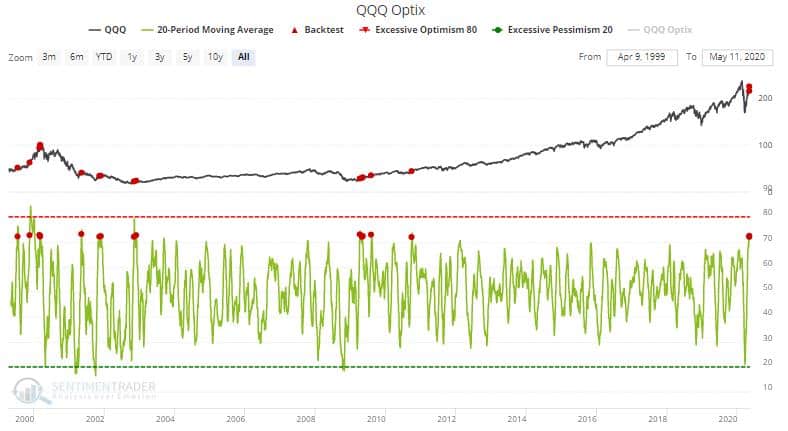
- Sentiment Trader shows that the trade has gotten a bit over its skis though… Their QQQ Optix indicator recently hit decade highs. ST notes that “In bear markets, this was a disastrous sign for equities. In bull markets, it either led to consolidations or pullbacks.”
- The extreme outperformance by these high-growth stocks versus their boring “value” peers has lead to what I assume is the mandatory end of cycle editorial pieces where we question the point of value investing.

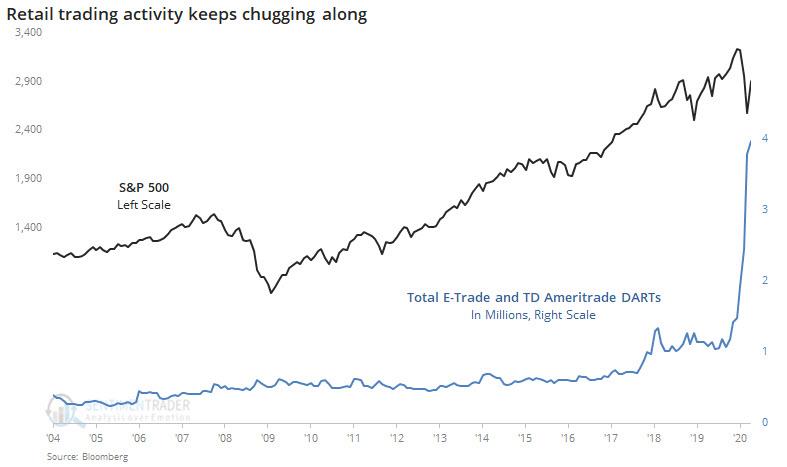
- After sitting out most of the cycle retail is finally getting into the game and doing so at record levels (chart via Sentiment Trader).
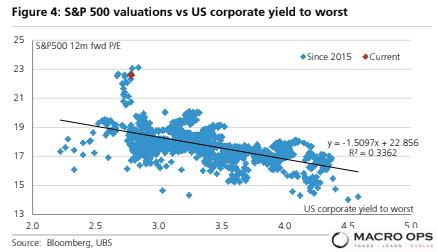
- The only long-term bull case I’ve been able to come up with for stocks has been that the risk premium on offer is fat (equities are cheap relative to yields) and honestly what’s the alternative? But, BofA points out that if you normalize ERP then stocks are pretty much dead in the middle of the ERP range they’ve been in all decade. BofA goes onto point out that “On a statistical basis, the 20.4x S&P 500 fwd PE puts the market over 1.5x standard deviations above the average of 15.4x and three-quarters of the way to the Tech bubble high of 25x.”

- And UBS writes that “A significant loosening of liquidity has driven re-rating of the market. But the rise in multiples is disproportionately high relative to the decline in real interest rates and credit spreads. We estimate that even if credit spreads were to go back to their tights, current equity market valuations are too high by around 3x. It is possible that the equity risk premium on offer rises in a non-linear fashion as rates approach zero, but current multiples look stretched even accounting for this.”
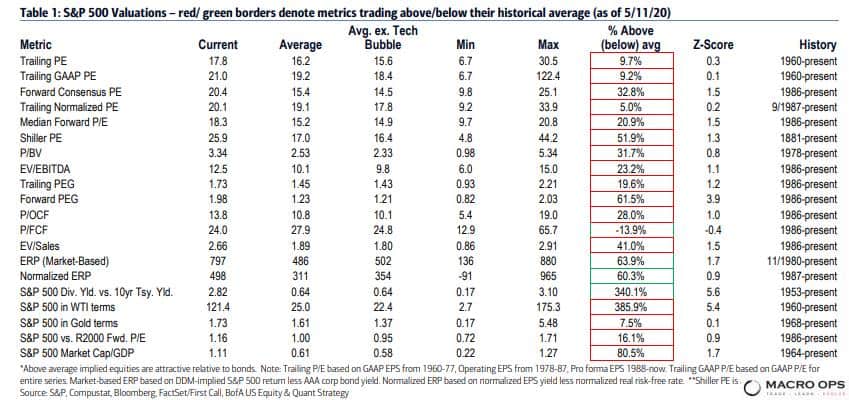
- BofA examined the SPX across 20 valuation frameworks to determine historical cheapness. Red boxes indicate where the market is “richer” than average.
- You would think that such high valuations would be reflective of stronger than usual fundamentals but, errr…. That’s not exactly the case. BofA shows that “the proportion of non-earners within the Russell 2000 is above levels typically seen heading into recessions (and near all-time highs reached during prior recessions) — and this was largely before the impacts of COVID-19/should only get worse”.

- If you bought European stocks back in 99’ at the introduction of the euro you’d be down 22% today which is better than the 87% you’d be down if you’d bought European banks over 20-years ago.

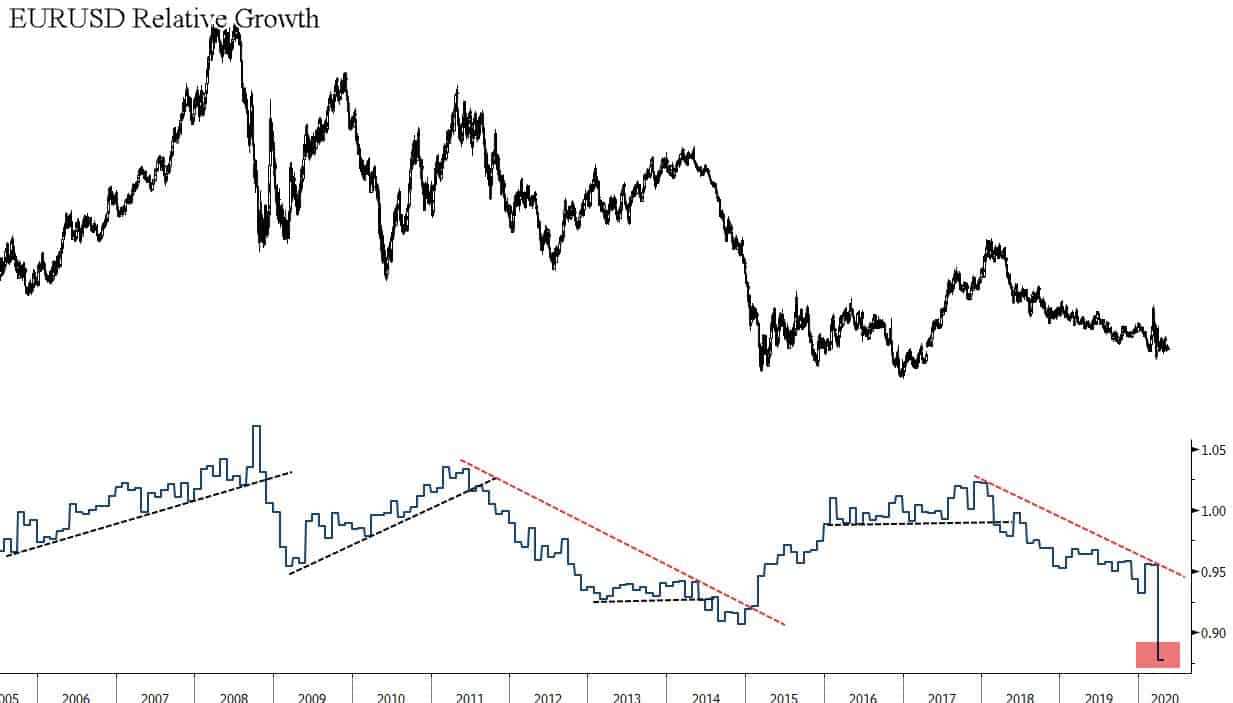
- I was hopeful that we’d see a tradeable bounce in EURUSD. But, alas, I think those hopes have been dashed. EURUSD Relative growth fell through the basement floor recently. FX is driven by speculative flows and speculative flows chase expected risk-adjusted returns which hinge on growth (higher relative growth = stronger EPS and higher yields). EURUSD has been coiling very tightly. Expect a big move soon.
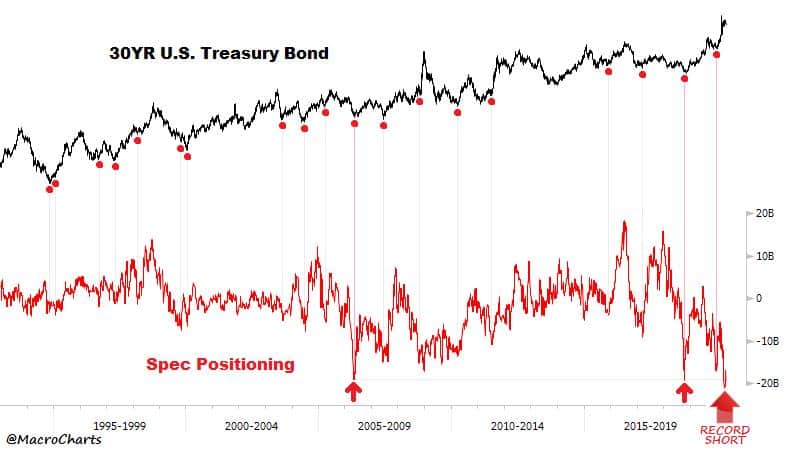
- I’m fairly bearish on US stocks over the next 12-months. Luckily, there’s plenty of other markets to trade. One of my favorite trades at the moment is to be long bonds. This chart from @macrocharts shows that spec positioning is giving us plenty of fuel for the move higher. Also, all my bond indicators started flashing another buy signal last week. Plus, the tape looks strong.
Stay safe out there and keep your head on a swivel.


