People need to have a perceptual filter that matches the way they think. The appropriate perceptual filter for a trader has more to do with how well it fits a trader’s mental strategy, his mode of thinking and decision making, than how well it accounts for market activity. When a person gets to know any perceptual filter deeply, it helps develop his or her intuition. There’s no substitute for experience. ~ Charles Faulkner
In this week’s Dirty Dozen [CHART PACK] we look at pandemics throughout history, bombed-out earnings expectations and what indicators to track to indicate a bottom is in. Then we talk how the bull quiet regime in the SPX is being driven higher by poor sentiment, cover the new highs in gold miners and end with a dirt-cheap retailer gunning for a turnaround, plus more…
***click charts to enlarge***
- Deutsche Bank recently published a macabre report comparing the current pandemic to all those throughout history. DB writes that “For covid-19 to become one of the 20 most severe pandemics in history on this measure, global fatalities would have to rise from the 178,000 today to just over 1 million.”

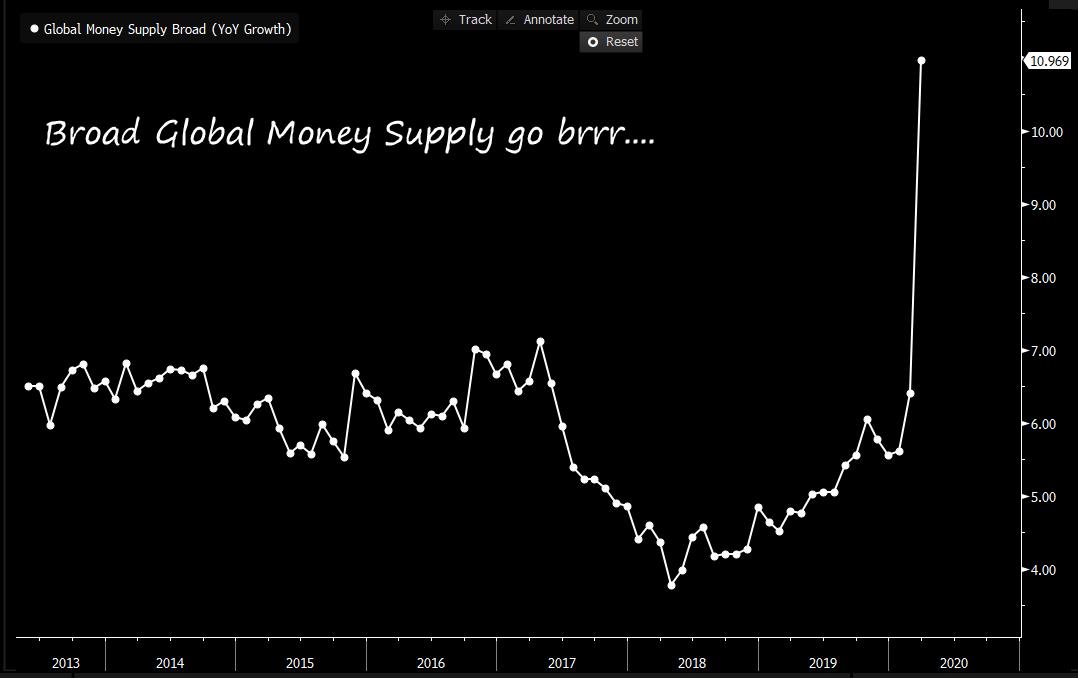
- The long-term equity supply and demand model looks like this: Demand = money stock (cash + credit) / Supply = total market cap (number of shares + the price at which they trade). If you’d like to read more on this topic, give this post I put together a while back. This is why bears should look at the chart below and pucker up a bit. The question is will this increase in demand more than offset the inevitable increase in equity supply?
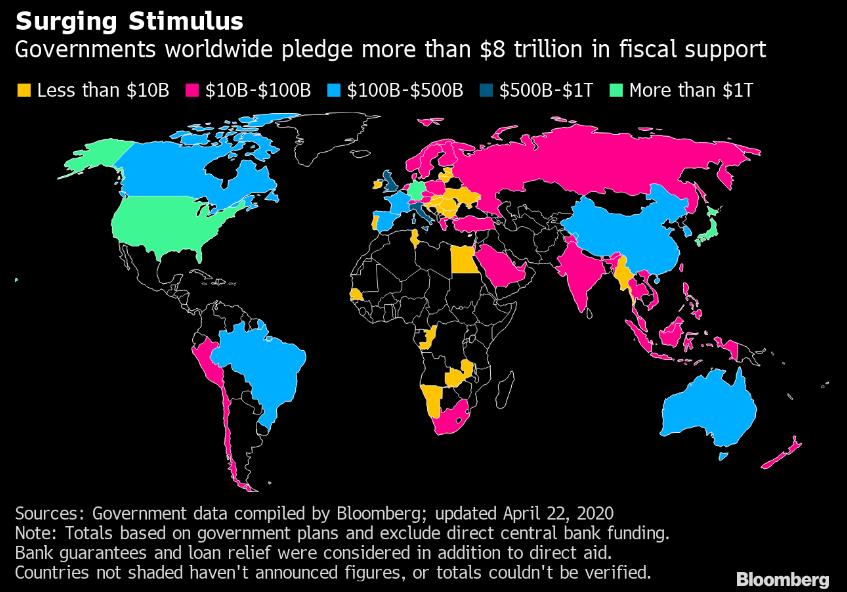
- Bloomberg writes “As governments dedicate more than $8 trillion to fight the coronavirus pandemic, a further widening in the gap between rich and poor countries threatens to exacerbate the global economy’s pain. Wealthy nations have delved deep to cushion the blow, but many African and Latin American economies have failed to reach even a few billion dollars in fiscal aid.”
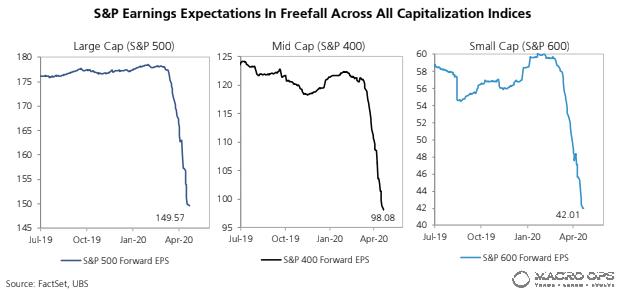
- Earnings follow growth and economic growth has fallen through the basement floor. This chart from UBS shows S&P earnings expectations across the indices.
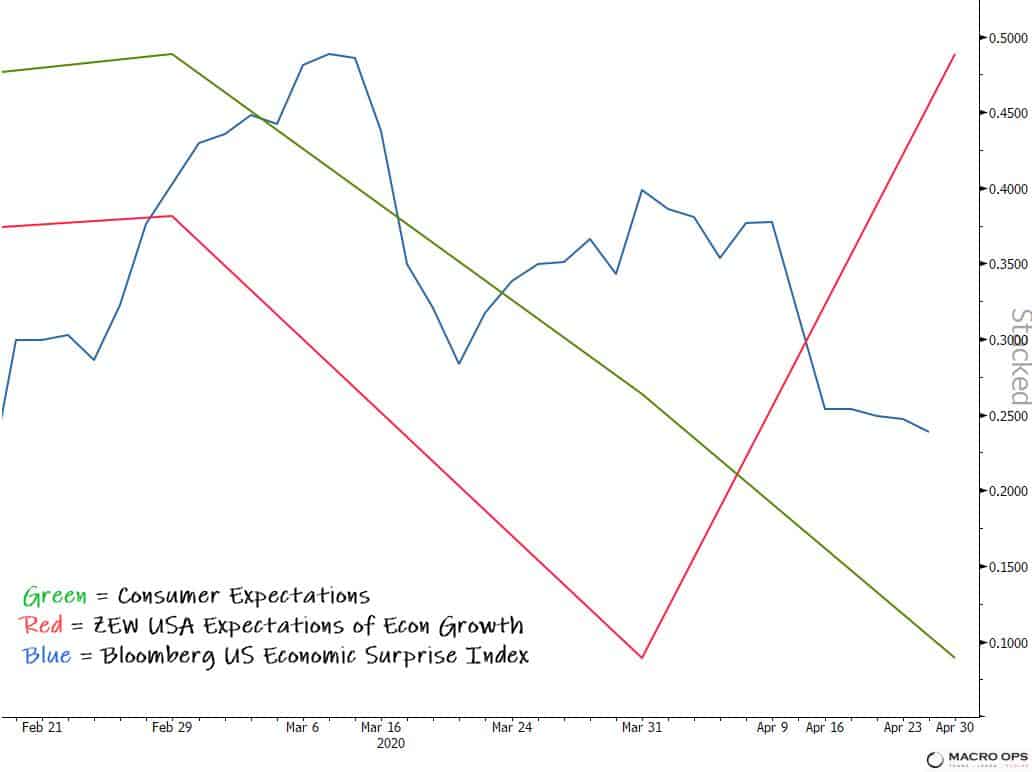
- From that same report, UBS points out that EPS tends to trough following a bottom in these three series (1) Consumer expectations (2) ZEW USA growth expectations and (3) Bloomberg’s economic surprise index.

- Here’s what those three indicators are doing right now… 1 for 3 so far for the bull case.
- My target for the current market rally has been 3,000-3,1000 on the SPX since I turned bullish on March 24th (link here). I think we get there within the next two weeks. That level also coincides with the 200-day moving average (blue line below) and a 0.618 fib retrace.
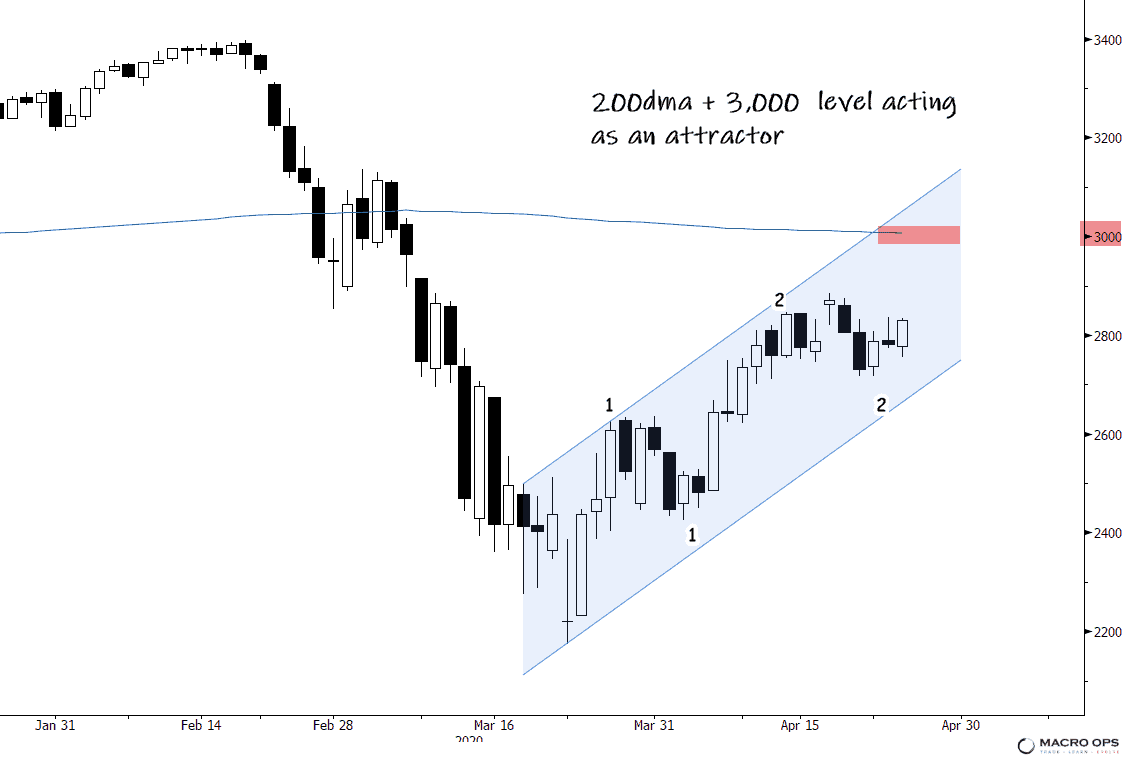
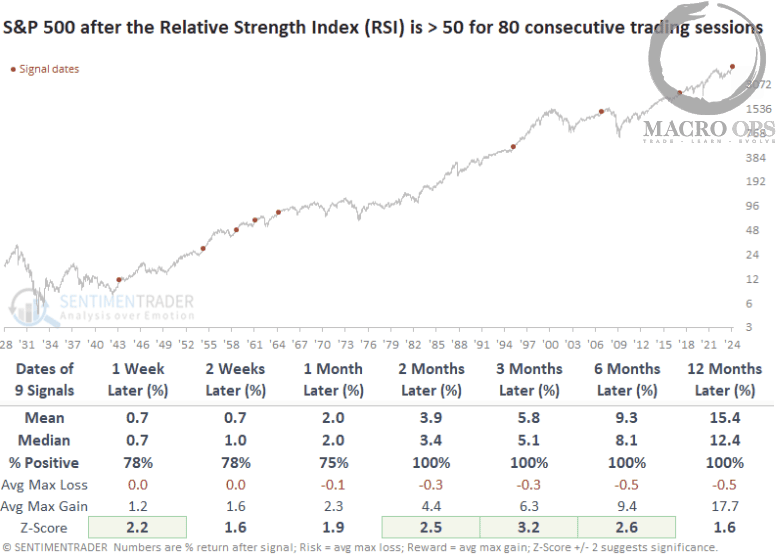
- This rally has been fueled by stretched technical conditions along with bearish consensus/positioning. The fact that AAII Net Bull-Bears hit new lows last week means that there’s plenty of room to run higher.

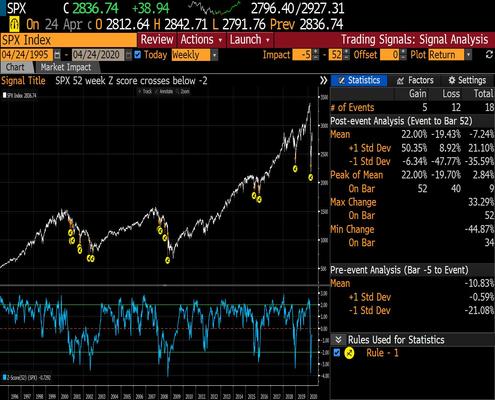
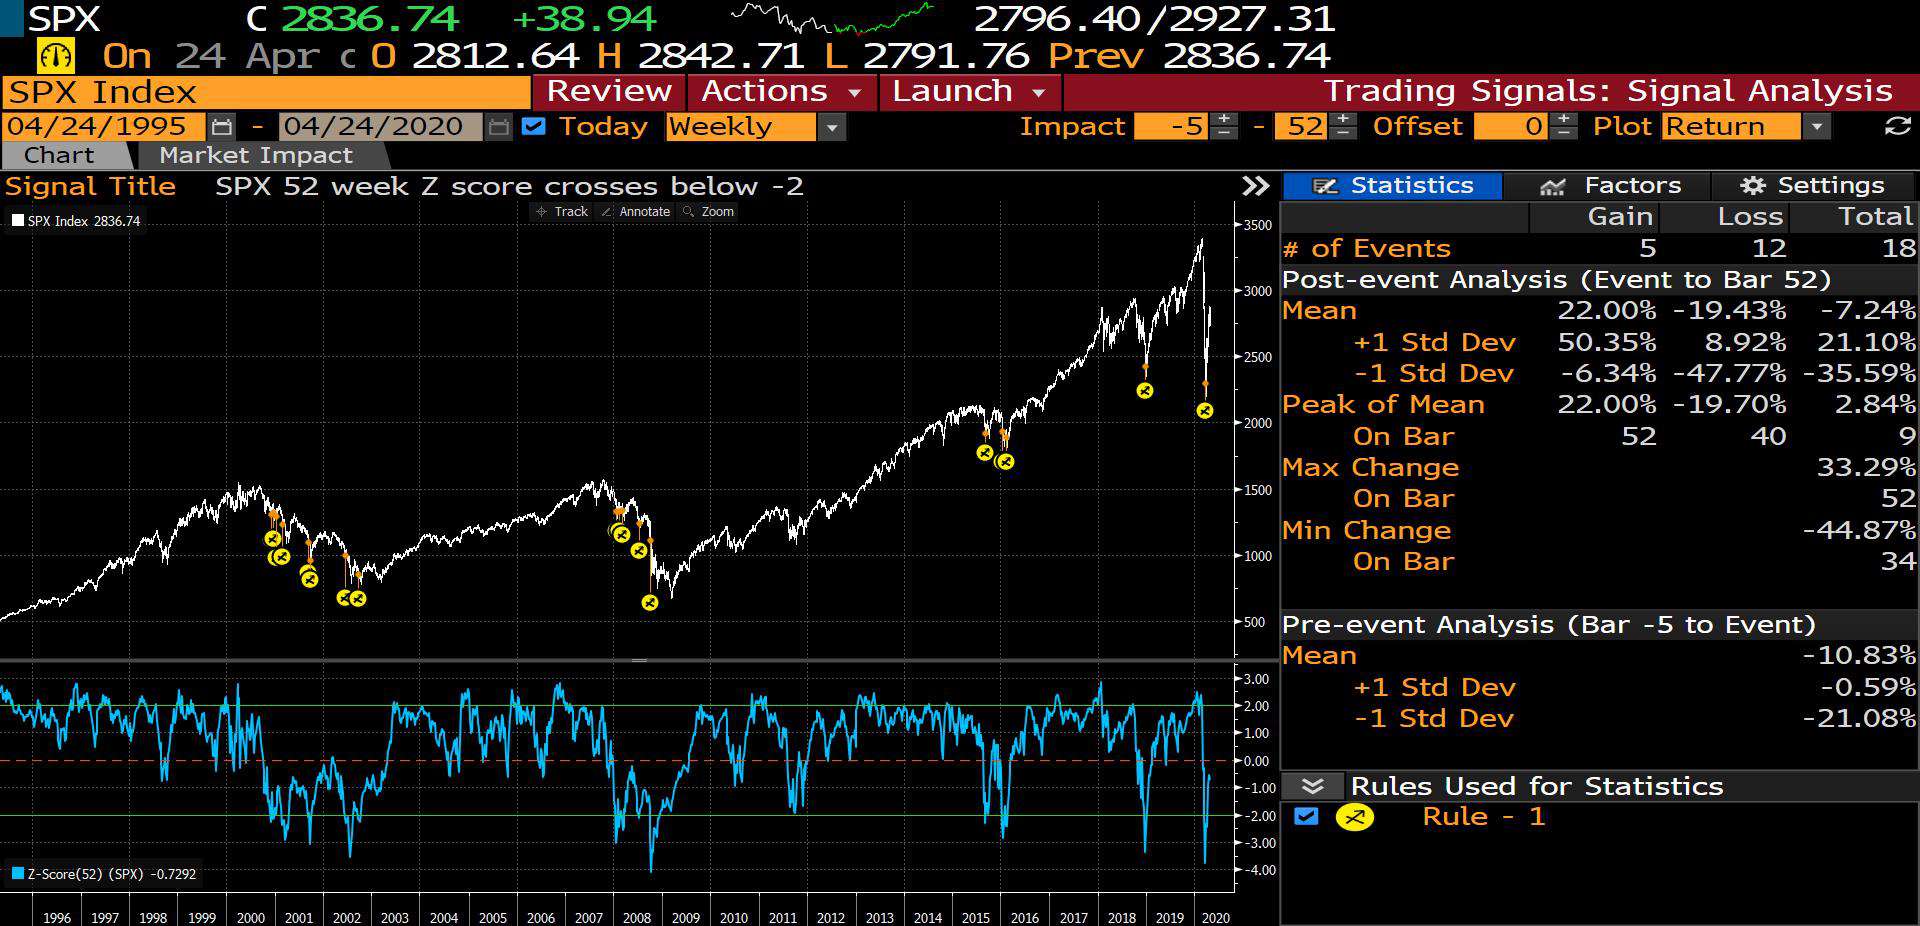
- The chart below shows each time the market has hit 2std oversold over the last 25 years (marked by yellow circles). There’s been 18 such events. Only 5 have gone on to recover to new highs over the following year while the other twelve times saw follow-on losses averaging 19%. The second chart shows the following 12-month path with the yellow line marking the average of the 18 instances.

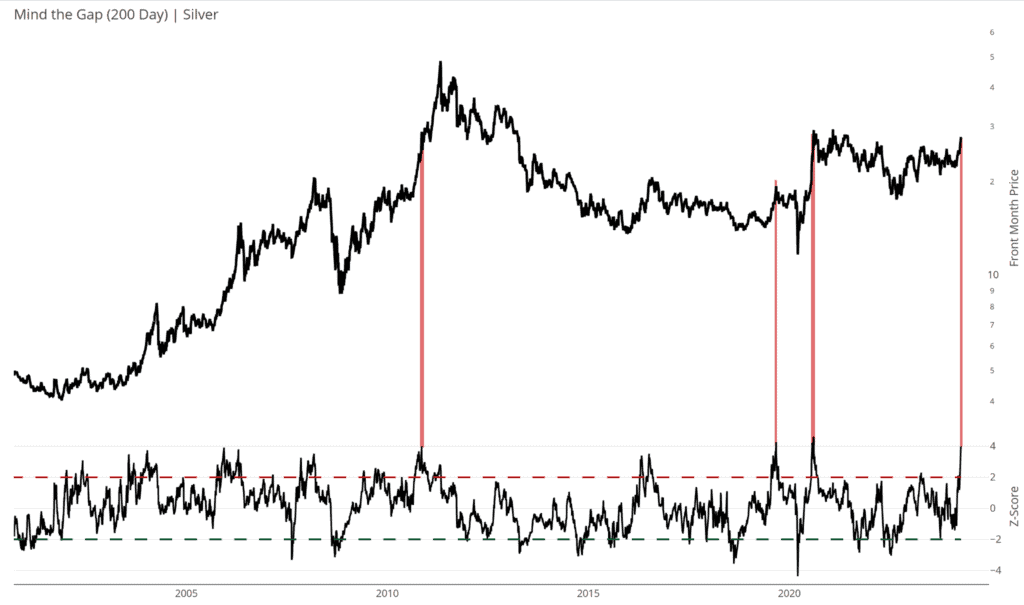
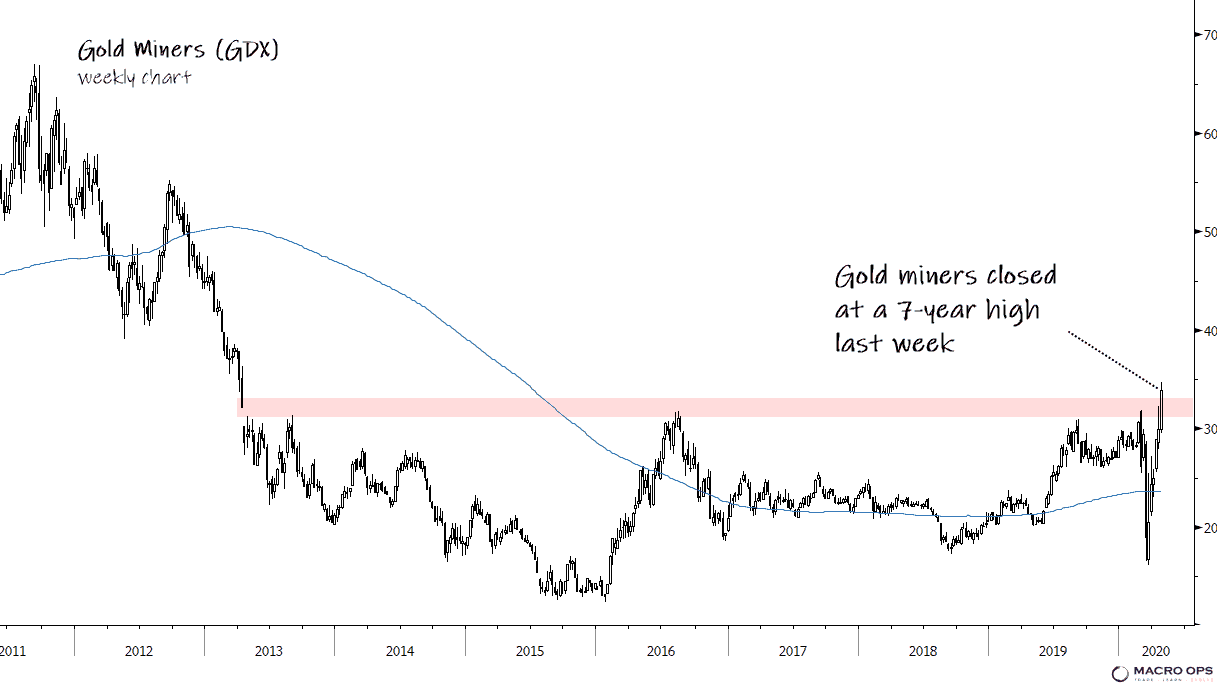
- The gold miners ETF (GDX) closed at 7-year highs last week. And it did so to what I feel like is little fanfare. That could be my bias but I feel like maybe the gold bulls have been quieted by numerous false starts over the years, which makes me think this one has legs. To catch up on the bullish gold case read this post here.
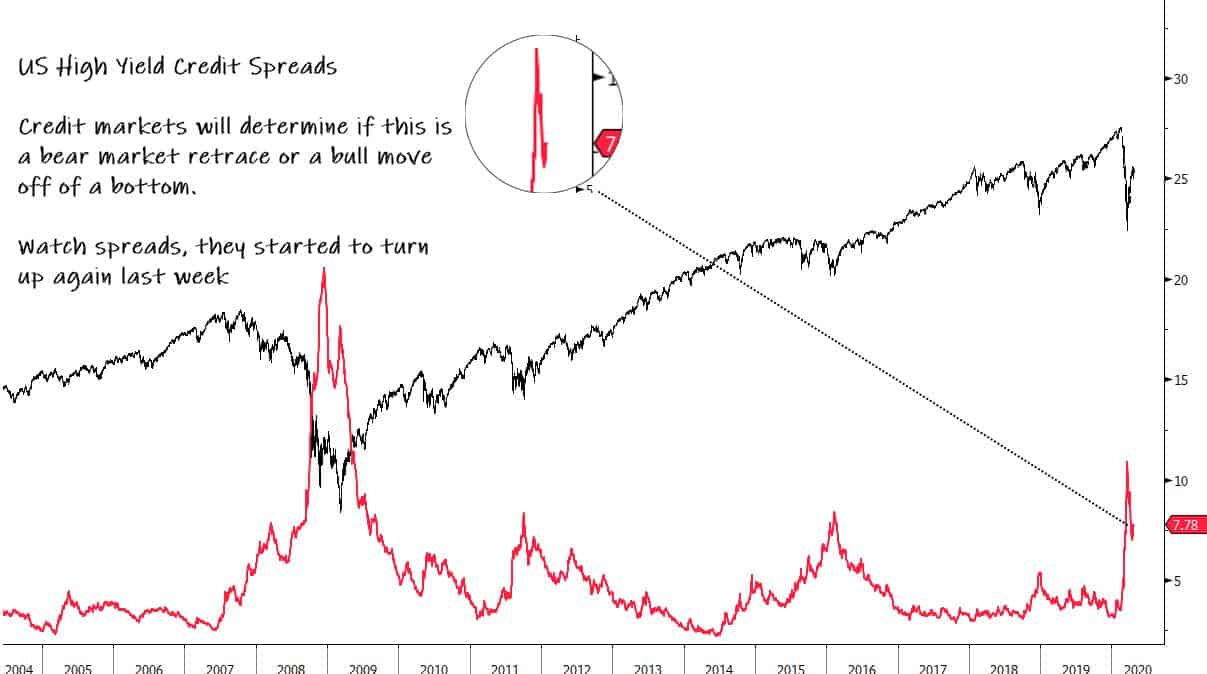
- In the hierarchy of markets, credit sits near the top, just below industrial metals. That means that when credit is making moves you need to listen, especially if you’re holding stocks. US high yield credit spreads hit a cycle high last month and have since recovered somewhat. But, they began to turn up again last week. This could be a blip or the start of another move. Only time will tell but make sure you’re paying attention.
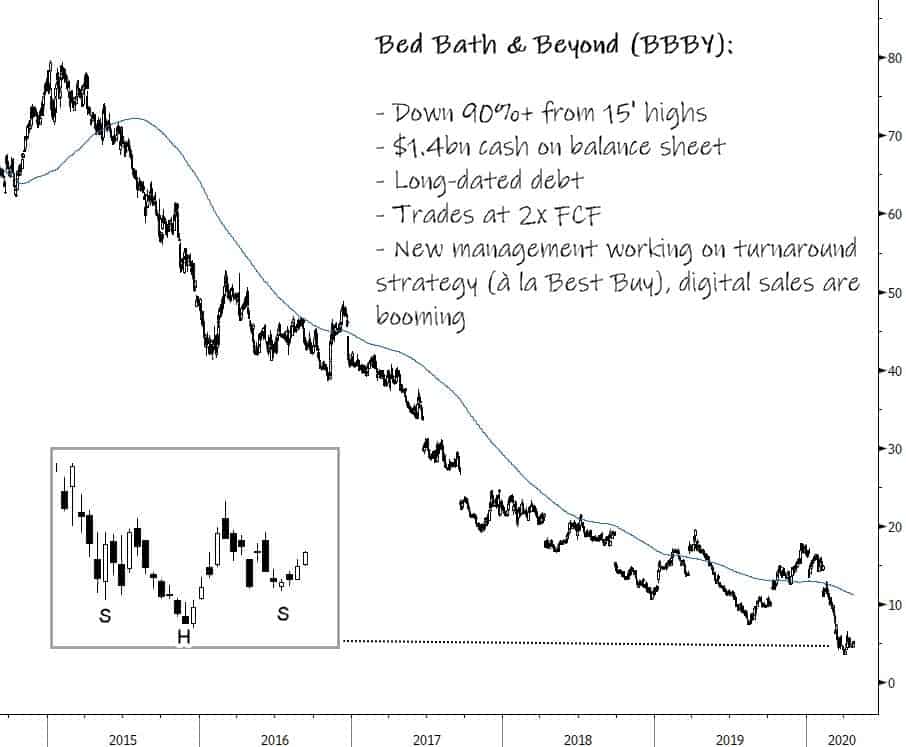
- There’s a lot of cheap stocks on sale right now. Many of them for good reasons, some of them not so good. Bed Bath and Beyond (BBBY) might be one of the latter. It’s a company we’re digging into at the moment and there’s a lot to like. It’s incredibly cheap. Has a new sharp management team with aligned interests. Lots of cash on the balance sheet to help weather the storm. And the majority of its debt is extremely long-dated.
Stay safe out there and keep your head on a swivel.