You don’t really trade the market. You trade your beliefs about the market. ~ Van Tharp
Click here to get the Dirty Dozen straight to your inbox every Monday morning
Good morning!
In this week’s Dirty Dozen [CHART PACK] we look at current estimates of the severity of the coming recession, look at how those compare to past downturns going all the back to the 1700s, check-in on liquidity and sentiment before diving into the oil glut and what it means, plus more.
***click charts to enlarge***
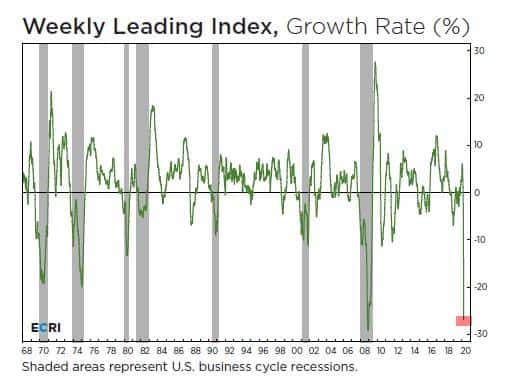
- The ECRI’s US Weekly Leading Index has been in free fall for 9-weeks. The index, which is a composite of high frequency data points, including: money supply data, stock prices, an industrial markets price index developed by the organization, mortgage applications, bond quality spread, bond yields, and initial jobless claims. ECRI commented on the WLI in a recent post writing
“A recession’s severity is measured by its depth, diffusion and duration, or what we call the 3Ds. In terms of depth, this recession looks extreme, and will likely be the deepest in living memory. It’s also exceptionally widespread in terms of industries affected, so in terms of diffusion, as well, it’s a severe recession…Historically, the vigor of a recovery – at least in its first year – has been proportional to the depth of the preceding recession. But this time around, a sustained “V” shaped recovery is improbable.
“Sure, it might start with a little bit of a “V” as existing businesses get employees back to work. But so many small and medium size firms are going out of business that it might actually require rebuilding rather than restarting business relationships to really get things going. In any case, people may not be so eager to get out there to restaurants and entertainment venues and mingle – not until they feel safe. That could take a while, and will hamper the services side of the economy.”
I concur.
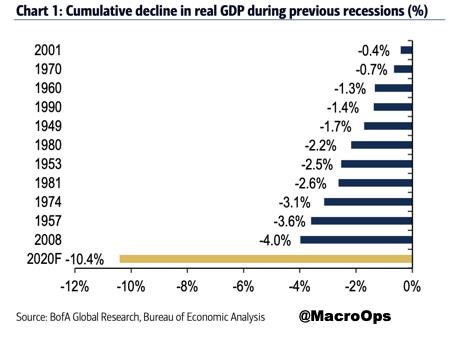
- BofA covered the drop in real GDP they’re expecting in a note last week (emphasis by me):
“This degree of weakening in the economy should translate to a significant amount of job cuts which will happen over the next two months. We think that between 16 and 20 million jobs could be lost, sending the unemployment rate to a peak of 15.6%. We also think there will be additional stimulus. The CARES Act is the first step but will likely be augmented by other policies.
“We think that total stimulus will likely equal between 15% to 25% of GDP, in total. We could see additional spending in short order. This will leave growth down a cumulative 10.4% in this recession, exceeding the prior post WWII record of 4% in 2008. This translates into a roughly $2tn annualized decline in GDP (Chart 2). The shock is unlike anything we have experienced before with part of the economy effectively put into an induced coma.”
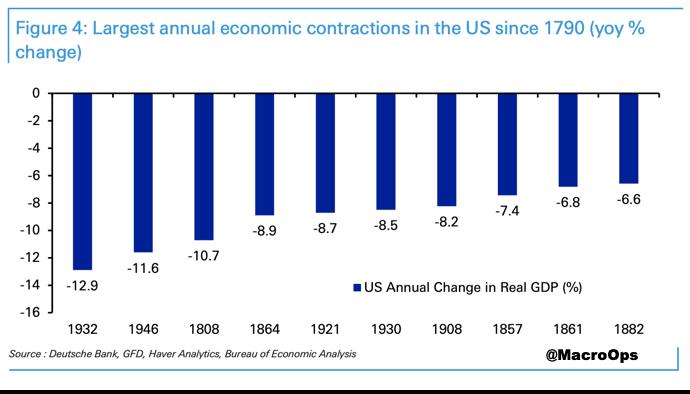
- To give this a little more historical context, here are the largest annual economic contractions in the US going all the way back to 1790 via DB.
- There’s a few things we need to keep in mind as we move forward into this sharp contraction (1) the market is forward-looking. It discounts future growth so what is happening now and a few months from now is already baked into the price (2) the economy is not the market. Stocks, can and do, often move in counterintuitive ways as Druckenmiller likes to point out and (3) the duration of this slowdown is the most important variable here. It’s also the one we have the least visibility on at the moment.
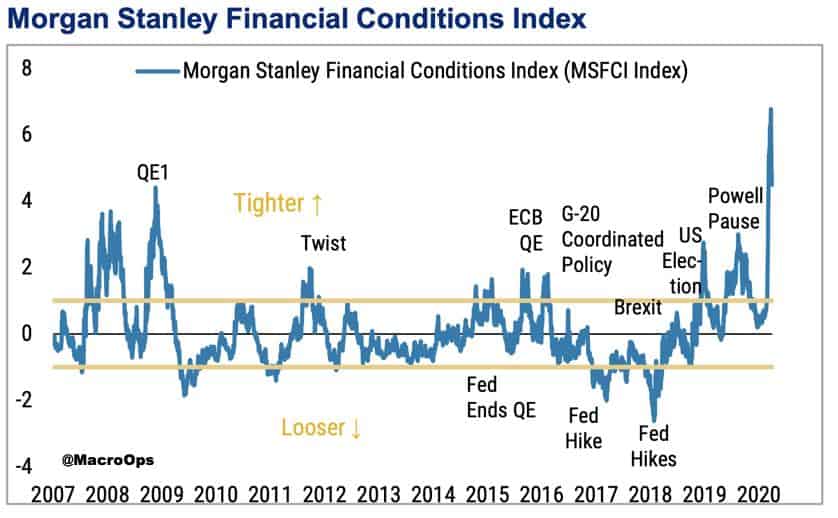
One bright spot for risk assets is that financial conditions are the easiest they’ve ever been according to MS’s FCI **Sarcasm**.
- I’ve been pointing out over the last two weeks that we’re likely to see a bounce. We’ve already gotten a bit of a retrace and now the question is whether we’ll see any followthrough. If this were a more normal environment (ie, there wasn’t a virus shutting down half the world) I’d be positioning more aggressively for a short-term bounce. But, I’m not fully sure of whether the standard technical toolkit works in this environment, so I’m focusing less on equities and more on other markets where I think the opportunities are more asymmetric.
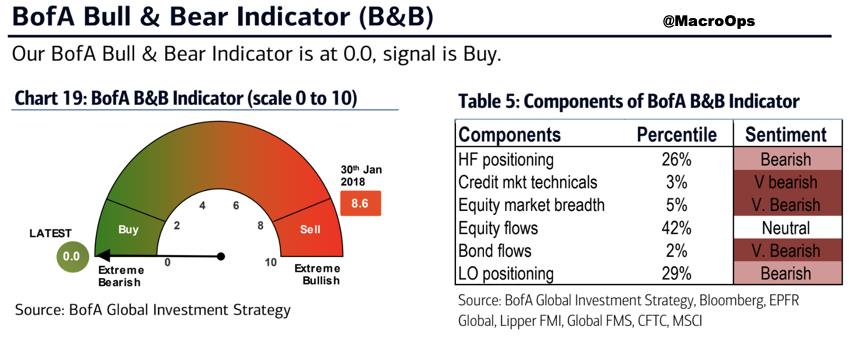
Sentiment and positioning are making extremes. BofA’s Bull & Bear Indicator hit 0 last week. A level reached only a few other times.

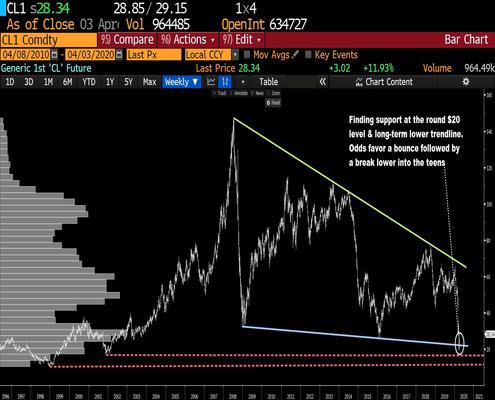
- One of the markets I’m paying close attention to is crude. Below is a weekly chart of WTI crude oil futures. Price bounced last week after hitting the $20 round number which also happened to be at its lower channel support line. It bounced as expected and we could see a little more upside but the odds favor a break of the $20 level and a move into the teens…

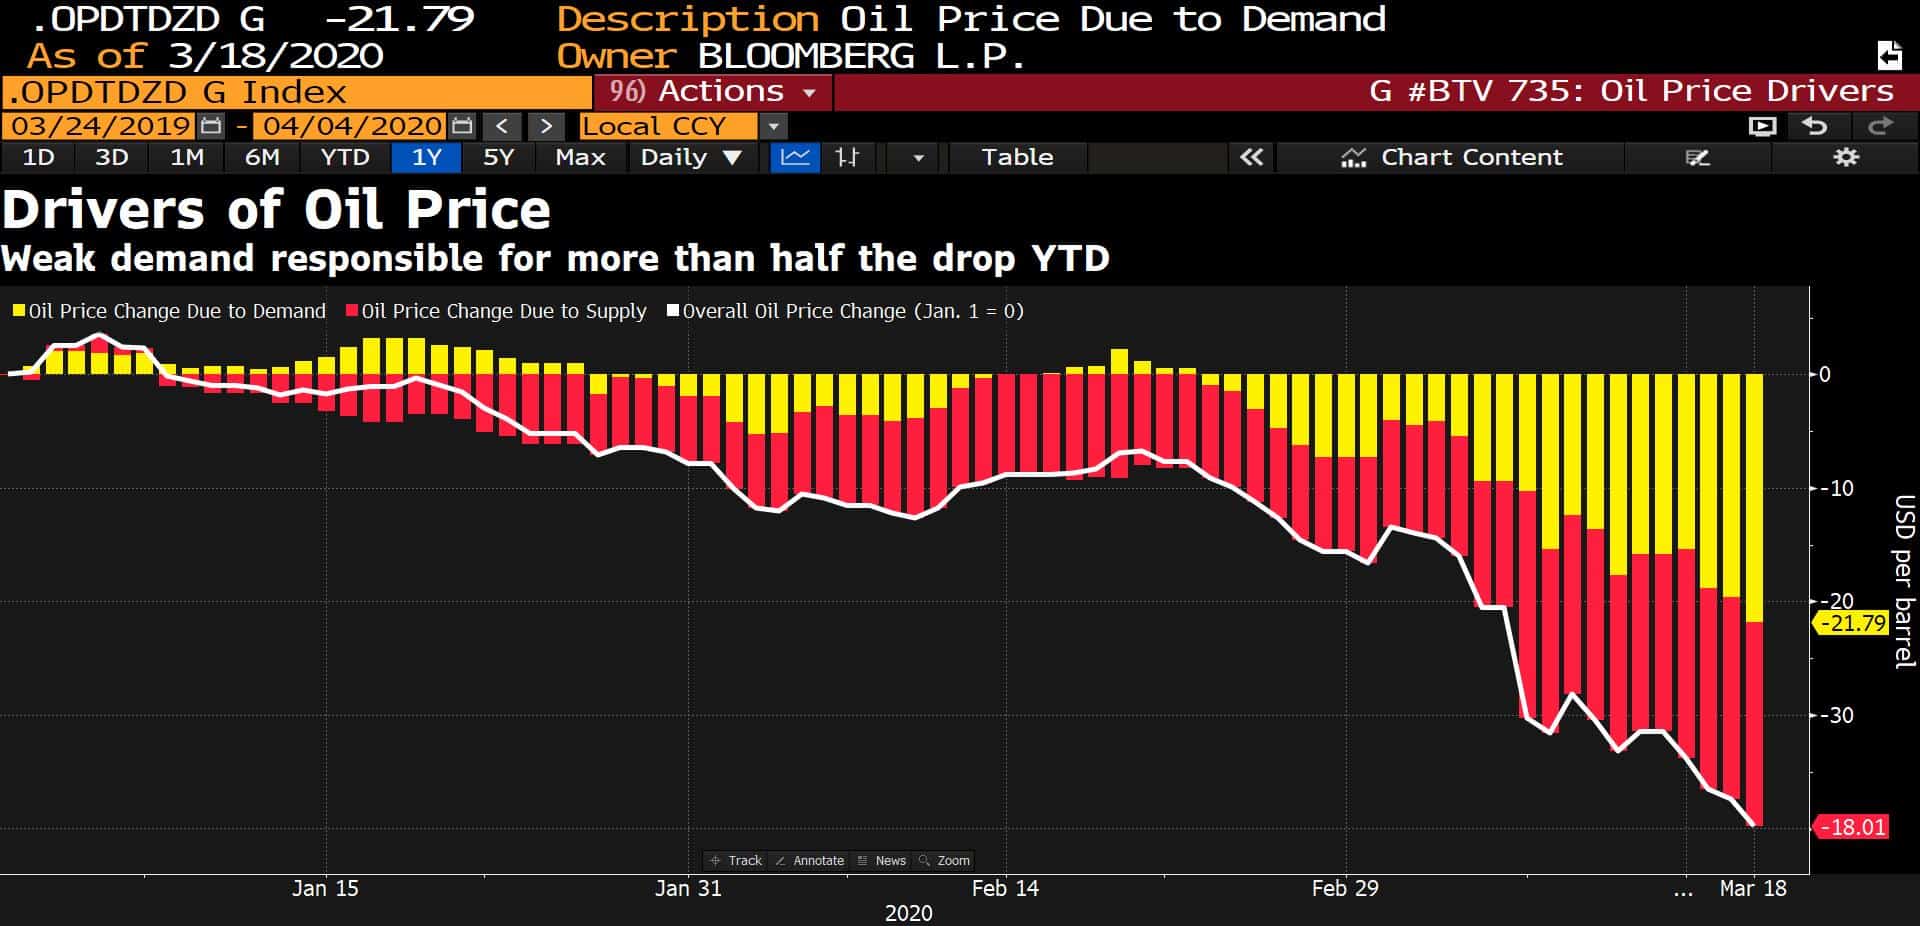
- A lot of fuss is being made over the Saudi/Russia price war and talk of a potential — though incredibly unlikely imo — collective production cut, but it’s the large drop in demand that is really driving the supply glut, as this chart below shows (chart via BBG).
- BofA’s commodity team recently talked about the significance and severity of this fast building supply glut in black gold, saying (emphasis by me):
“There is no amount of agreed cuts in supply that can offset the tsunami of physical crude in the market. This has started the debate on storage as the limiting factor on price. While our commodity team coined the term ‘supercontango’ to describe the expected collapse at the front of the curve, no one predicted the scale of the oil market imbalance that is now expected to push oil prices below cash costs.
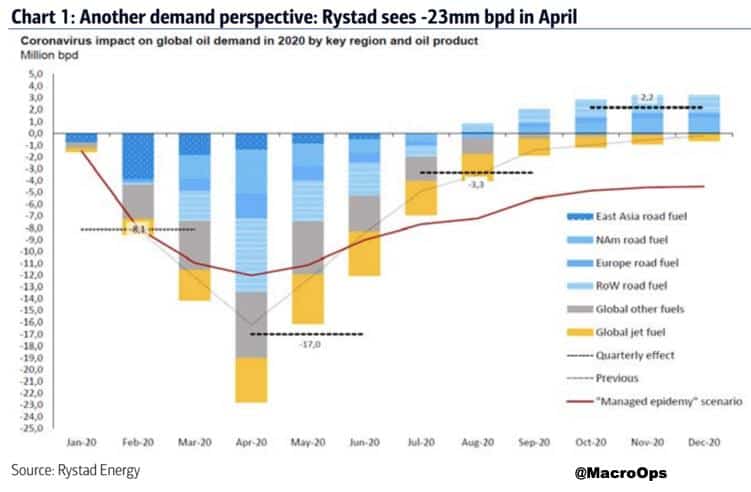
“This is already happening as although benchmark prices stand at $20 – $25 per barrel for WTI and Brent, realized prices in key producing areas of the US / Americas are already significantly below these levels . Between them, Russia and Saudi produced 20mm bpd before the production deal fell apart on March 6th. At that time Saudi saw COVID-19 as a threat to demand with OPEC calling for additional production cuts of 1.5mm bpd. Russia’s position was that it needed more time to study the impact. Though we are under no illusion that Russia expected this scale of a collapse in demand. But with demand now expected to decline by >25mm bpd there is no amount of production cuts that would offset a storage led collapse in oil prices.”
The play here? Tanker stocks: TNK, EURN, DHT, STNG
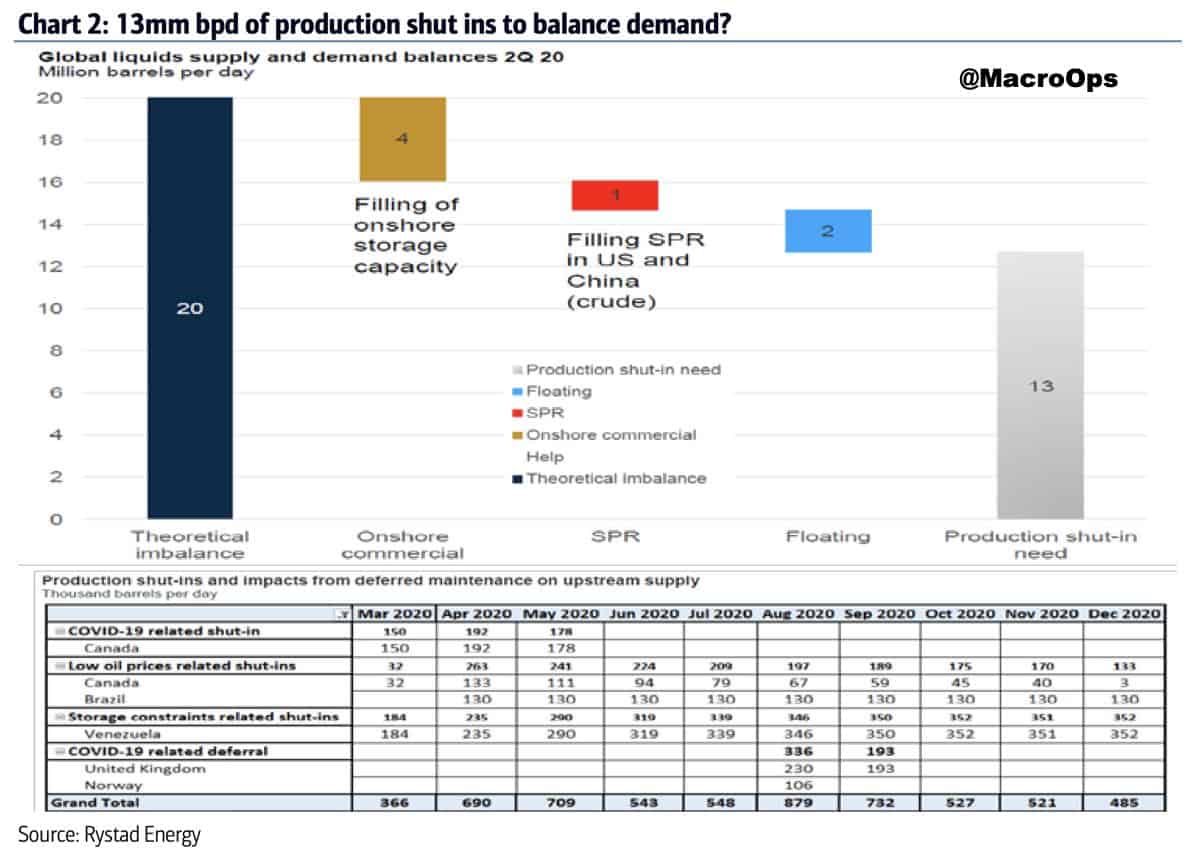
- From that same report, BofA goes on to note that “Per our discussions with Kayrros, global storage capacity is estimated at just ~2/3rds full. That may be true – but we suggest the forward curve points what is expected to happen next, with regional prices a lead indicator of what can be expected across the industry: spot oil prices that are forced below cash costs to force production shut-ins. Discussions with Rystad suggest the scale of shut-ins may need to be as high as 13 mmbpd, with less than 1mm bpd announced, by global producers to date.
- And more from BofA, “There are no precedents for the demand destruction expected to come (>20mm bpd). Within the energy sector refiners are the supply response, and are slashing operating rates to a minimum, which is having severe repercussions across the oil patch. While it’s true that E&P’s have already cut capex, the production response (3-6mths) won’t be fast enough to achieve market equilibrium. The cuts required will need to be deeper with the only option to shut down existing production.
“But shut-ins more than a few hundred thousand barrels is an unprecedented situation, which will have its own chain of events (for context only 100,000 b/d’s were shut-in during the 2014 downturn.) It’s not clear how shut-in’s will play out, but in North America, ‘stripper wells’ (500mbd – 1 million bd) and Canadian oil sands (and particularly crude by rail) are the weak links with operating costs in the $15-20/bbl range, and are therefore the first places to consider.”

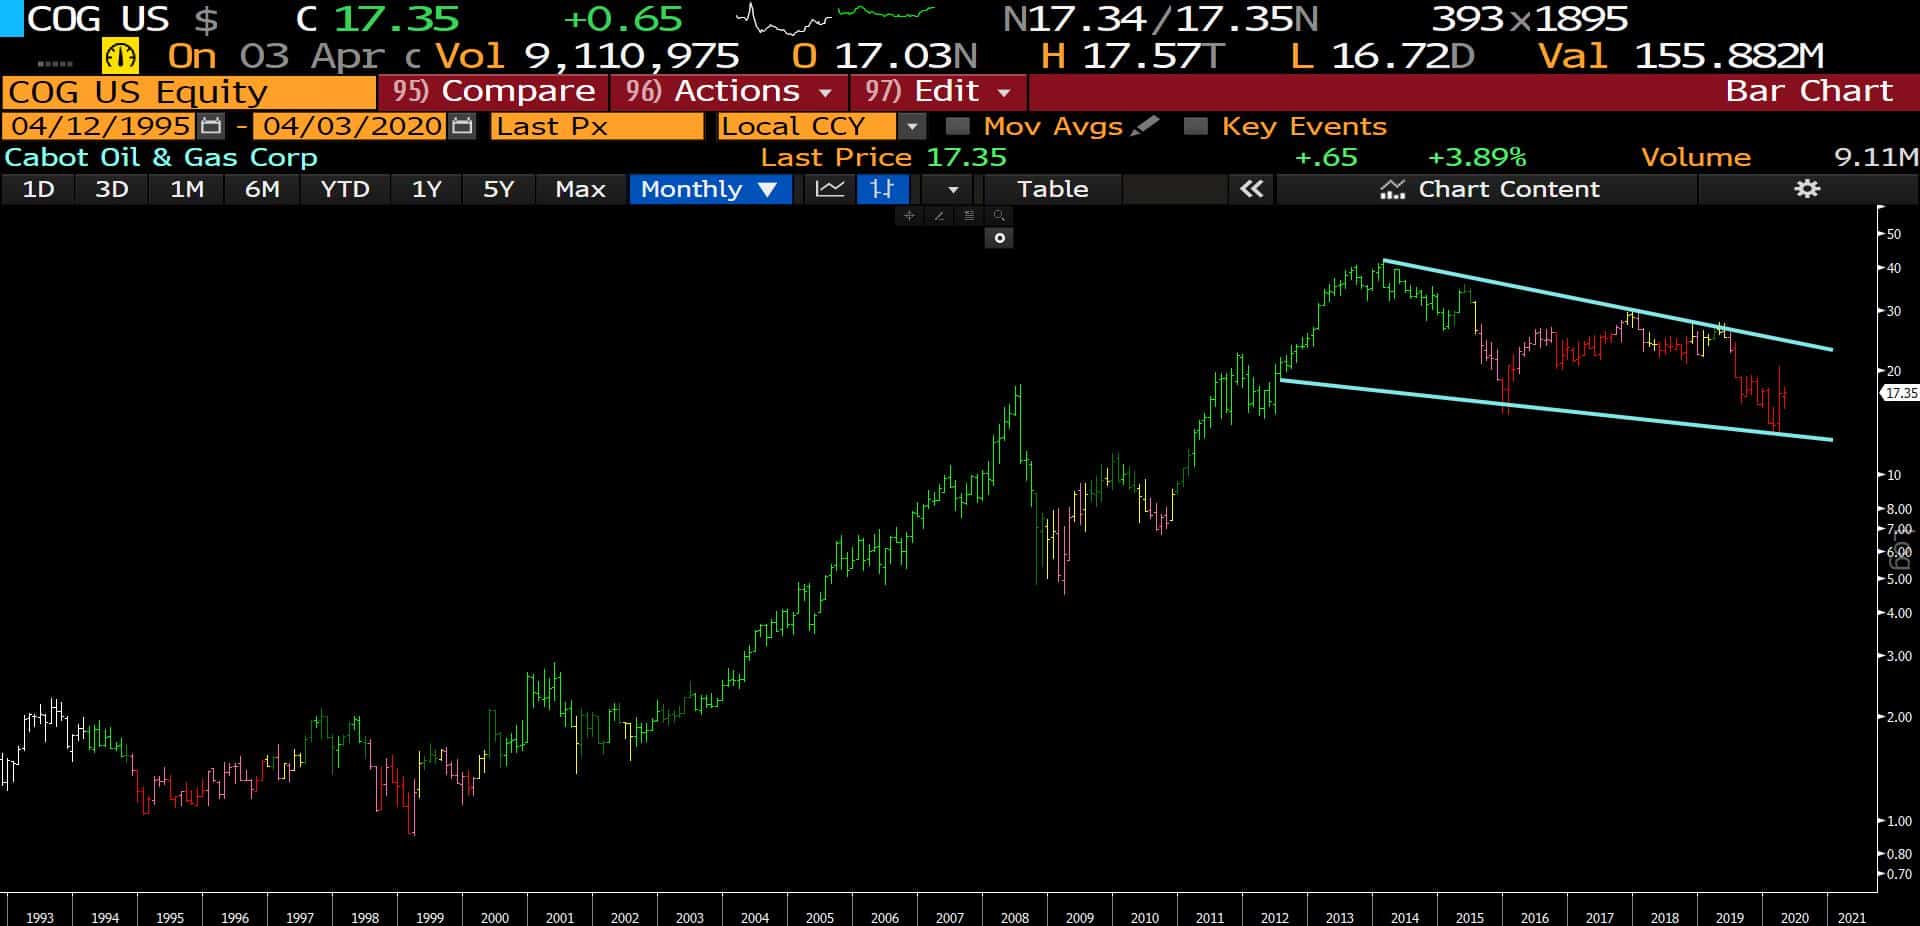
- It’s too early to start buying the likely survivors of this washout but it’s not a bad idea to put together a list of those with strong balance sheets, good assets, and low production costs. These plays will pay out big once the dust begins to clear and we move into a new world of constrained supply.
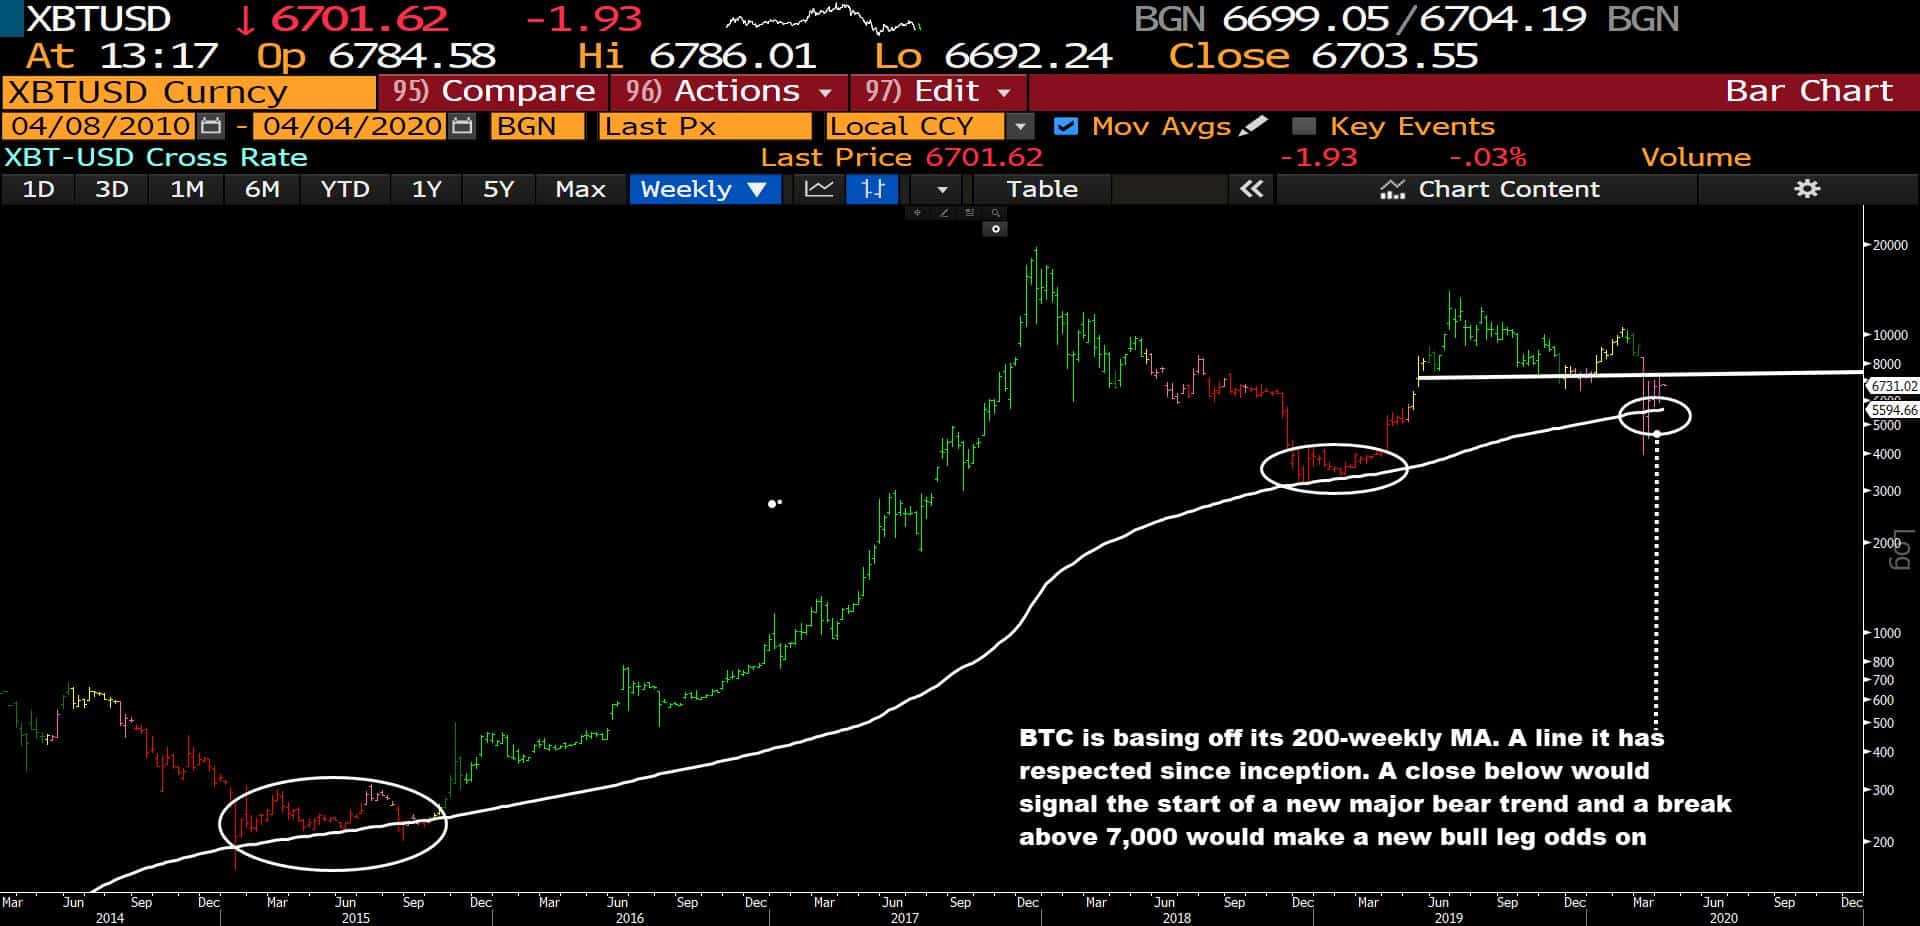
- Bitcoin (BTCUSD) is at a critical technical inflection point. The below chart is a weekly. The price is currently consolidating on its 200-week moving average (white line), a line that it has respected in the past. It’s also being squeezed by significant resistance in the 7,000-8,000 level (horizontal white line). A break above/below either is likely to signal the start of a new major trend. I lean bullish…
Click here to get the Dirty Dozen straight to your inbox every Monday morning
Stay safe out there and keep your head on a swivel!