All men dream: but not equally. Those who dream by night in the dusty recesses of their minds wake in the day to find that it was vanity; but the dreamers of the day are dangerous men, for they may act their dreams with open eyes, to make it possible. ~ T.E. Lawrence
Good morning!
In this week’s Dirty Dozen [CHART PACK] we walk through positioning indicators for the equity market and check out the worst 5-day fund flow streak for an ETF in over a decade. We then look at some dollar charts that suggest a short-term bottom in the USD may be near while the longer-term outlook doesn’t look so hot. We then end on a positive note for the broader US macro picture.
Let’s dive in.
***click charts to enlarge***
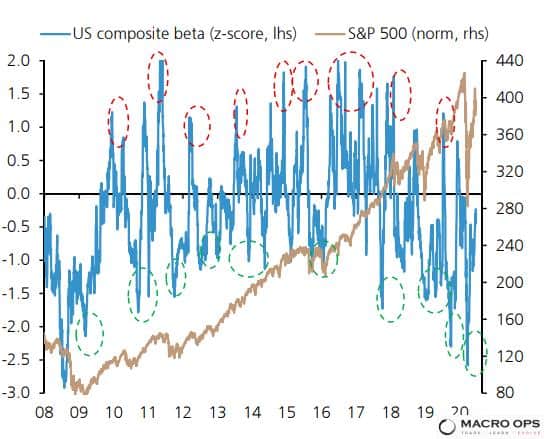
- UBS’s US Composite Positioning indicator, which measures the active manager positioning using a “proprietary database of over 930 MFs with AUM of $5.5trn across US equity MFs and allocation funds”, shows that the big players, on the whole, are under positioned risk. Though they’ve been aggressively working to correct this over the last couple of weeks.
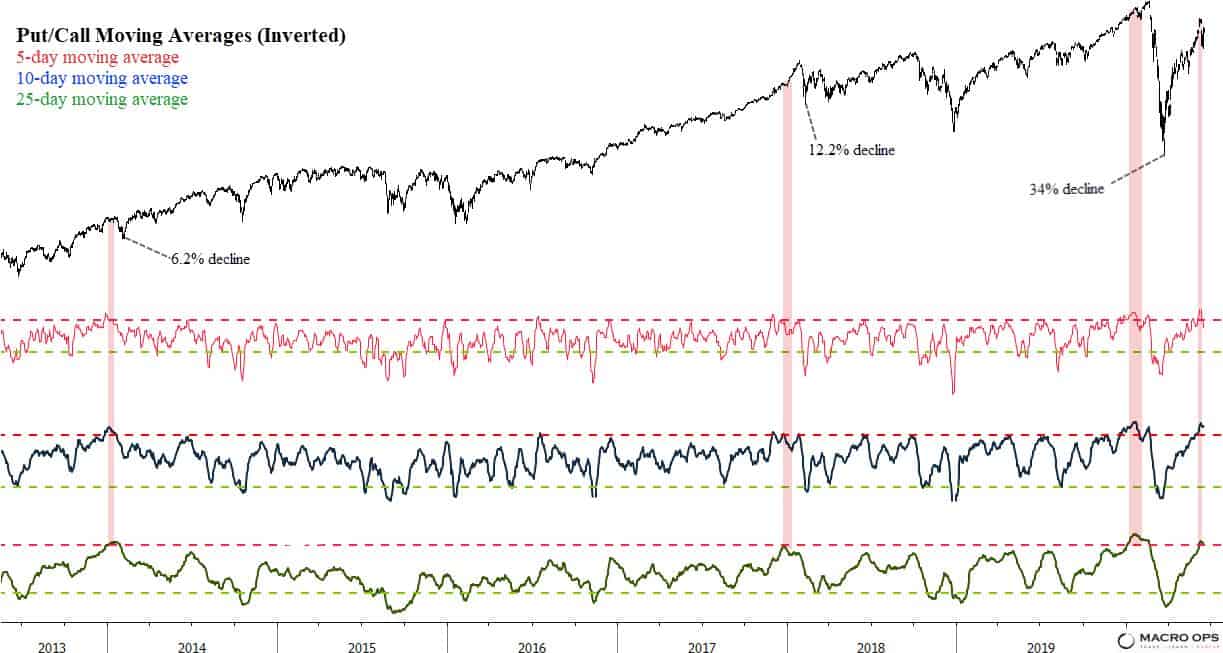
- But that under-positioning has been somewhat balanced out by the speculative fervor that shows in the options market where Put/Call Ratio MAs (inverted) are at levels that create fragility and tend to preceded decent-sized corrections. One major reason why the odds favor a continuation of the move lower this week.
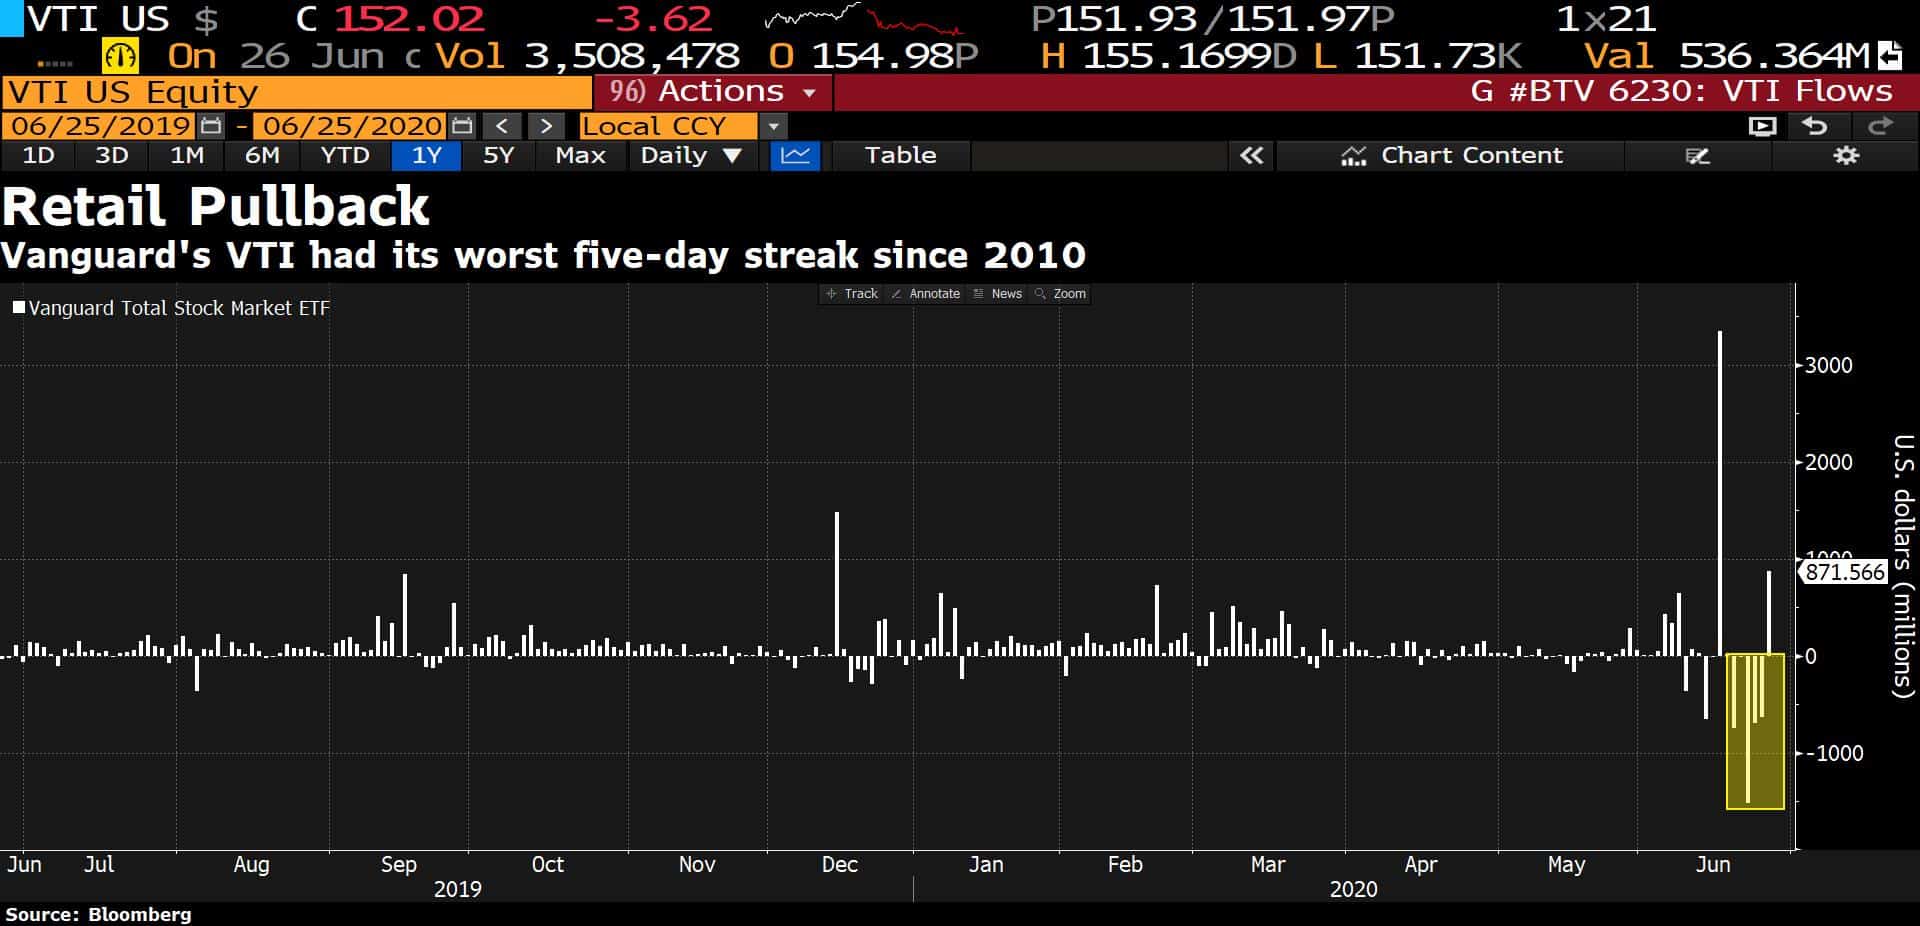
- Vanguards Total Stock Market Index (VTI) saw its largest 5-days of outflows in over a decade last week. Hmm…
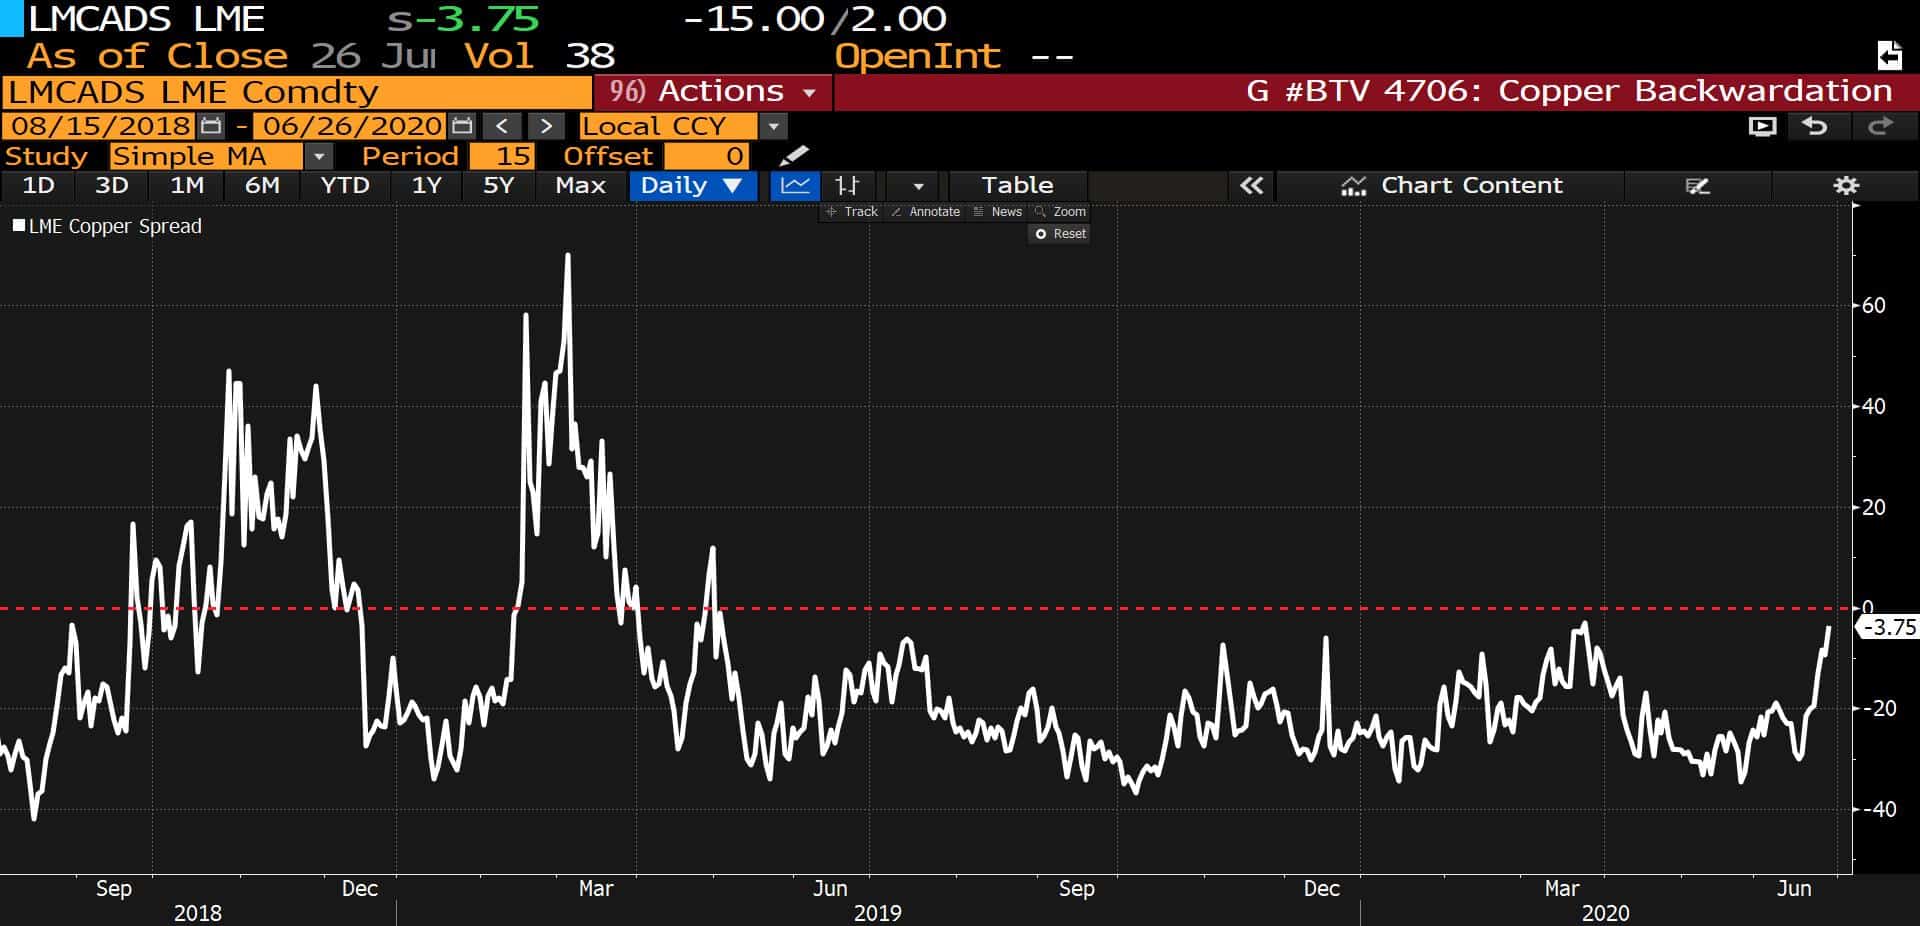
- Copper is the market you want to follow for sniffing out early trends in global growth. A promising sign on that front is that the cash market / 3-month copper curve is close to flipping into backwardation. This implies a tightening market and likely higher copper prices ahead (chart via Bloomberg).
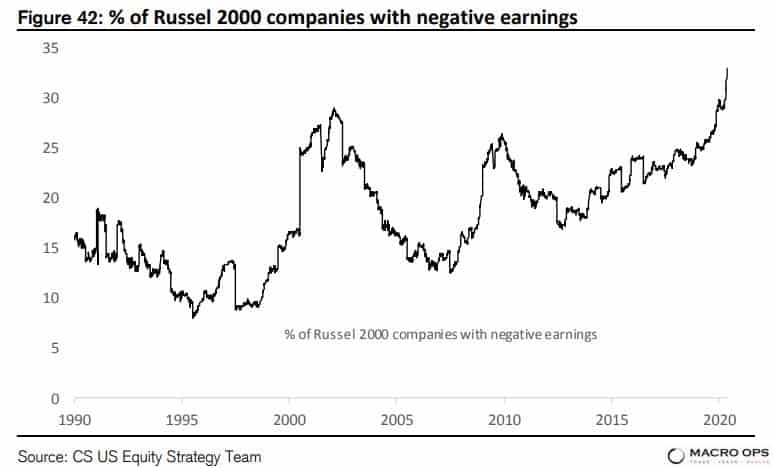
- According to CS 42% of Russel 2000 companies have negative earnings. That’s the highest on record. Now, there are two ways to look at this (1) wow, this is really bad or (2) huh, this is maybe as bad as it can get and perhaps a bottom is near for small-caps? I don’t yet have a strong side.
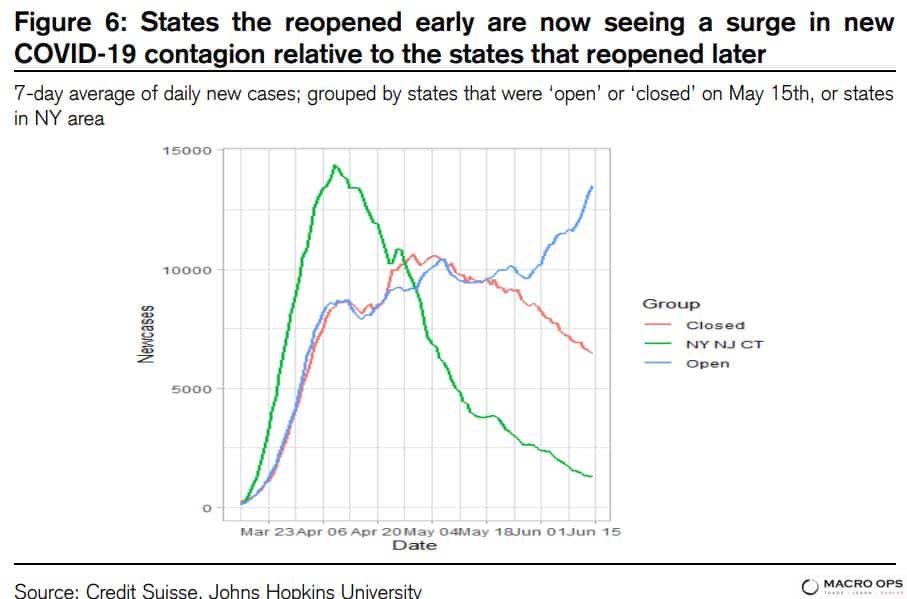
- This other chart from CS shows the differences in COVID trends between those states that opened early and those that didn’t. I get the sense that that COVID and the lockdown risk narrative might be coming back to the fore.
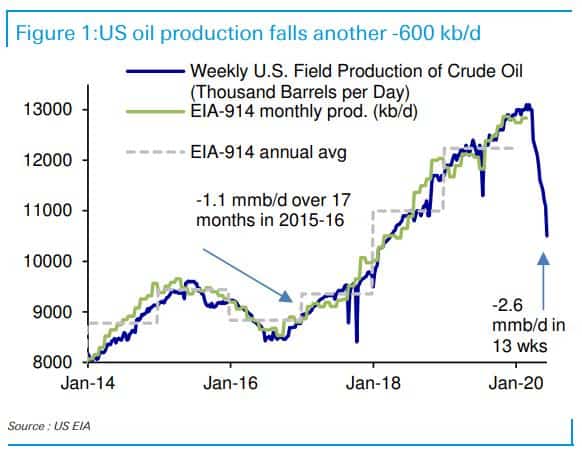
- In a recent note, DB pointed out the tightening supply dynamics in the oil market. They wrote “US oil production dropped by a very large -600kb/d this week equalling the 3 April decline, while the oil-directed rig count also fell by a further 10 rigs. Oil production from the US has now given up two full years of gains.” That’s quite significant…
- Here’s some good news. More US companies have been offering a brighter financial outlook than a gloomy one as the quarter comes to a close (chart via Bloomberg).

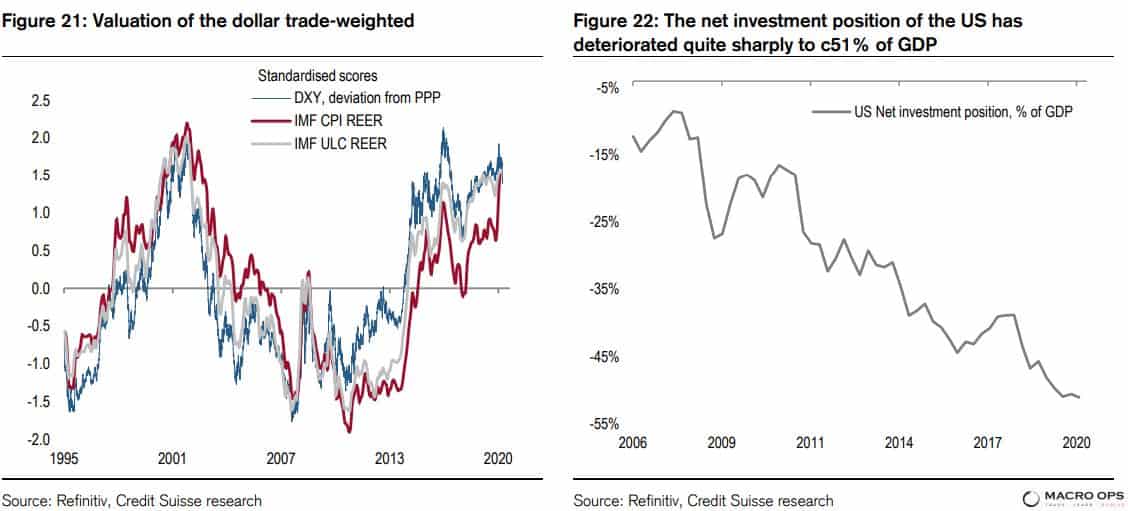
- Last week CS made the bear case for the dollar, pointing out its 1.5stdev overvaluation and the deterioration of the US’s net investment position over the last decade and a half.
- While I am sympathetic to the bearish USD case over the longer-term. I’m becoming quite concerned that the opinion is nearing a consensus — at least at the IB level, if not the broader market (yet). Plus, positioning is nearing levels that have marked short-term bottoms for the DXY in the past (chart via UBS).

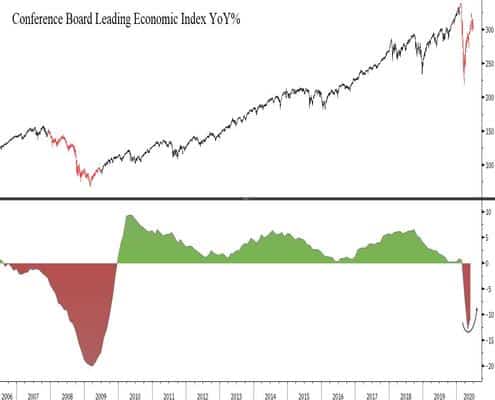
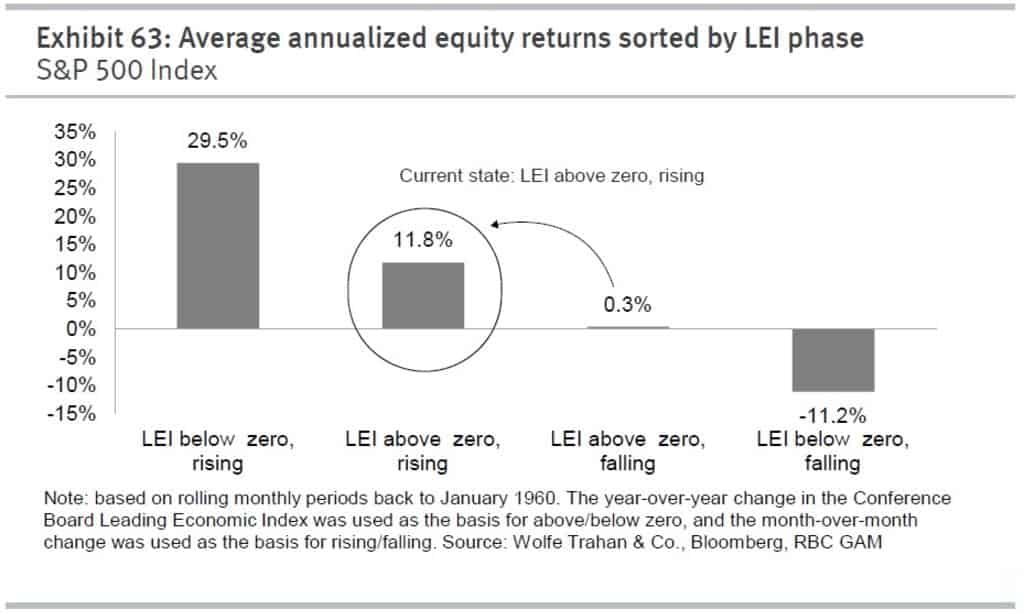
- The Conference Boards Leading Economic Index YoY% recently turned up from its lows. Now, it’s too early to say whether this is a change in trend or just a bump along the road lower. But…

- If it is a change in trend then that’ll bode very well for the stock market. Because, when the LEI YoY is below zero and rising, the equity market tends to have its best average annualized equity returns — averaging 29.5%, which isn’t too shabby.
Stay safe out there and keep your head on a swivel.