Being a great trader is a process. It’s a race with no finish line. The markets are not static. No single style or approach can provide superior results over long periods of time. To continue to outperform, the great traders continue to learn and adapt. ~ Jack Schwager
In this week’s Dirty Dozen [CHART PACK] we look at more signs of STRONG BREADTH, then we take a gander at improving economic surprises and what they may mean. We follow that up with some talk about small-caps and materials outperformance, cover the deep value on offer in Europe, and end with an energy name that has a nice looking tape.
Let’s dive in.
***click charts to enlarge***
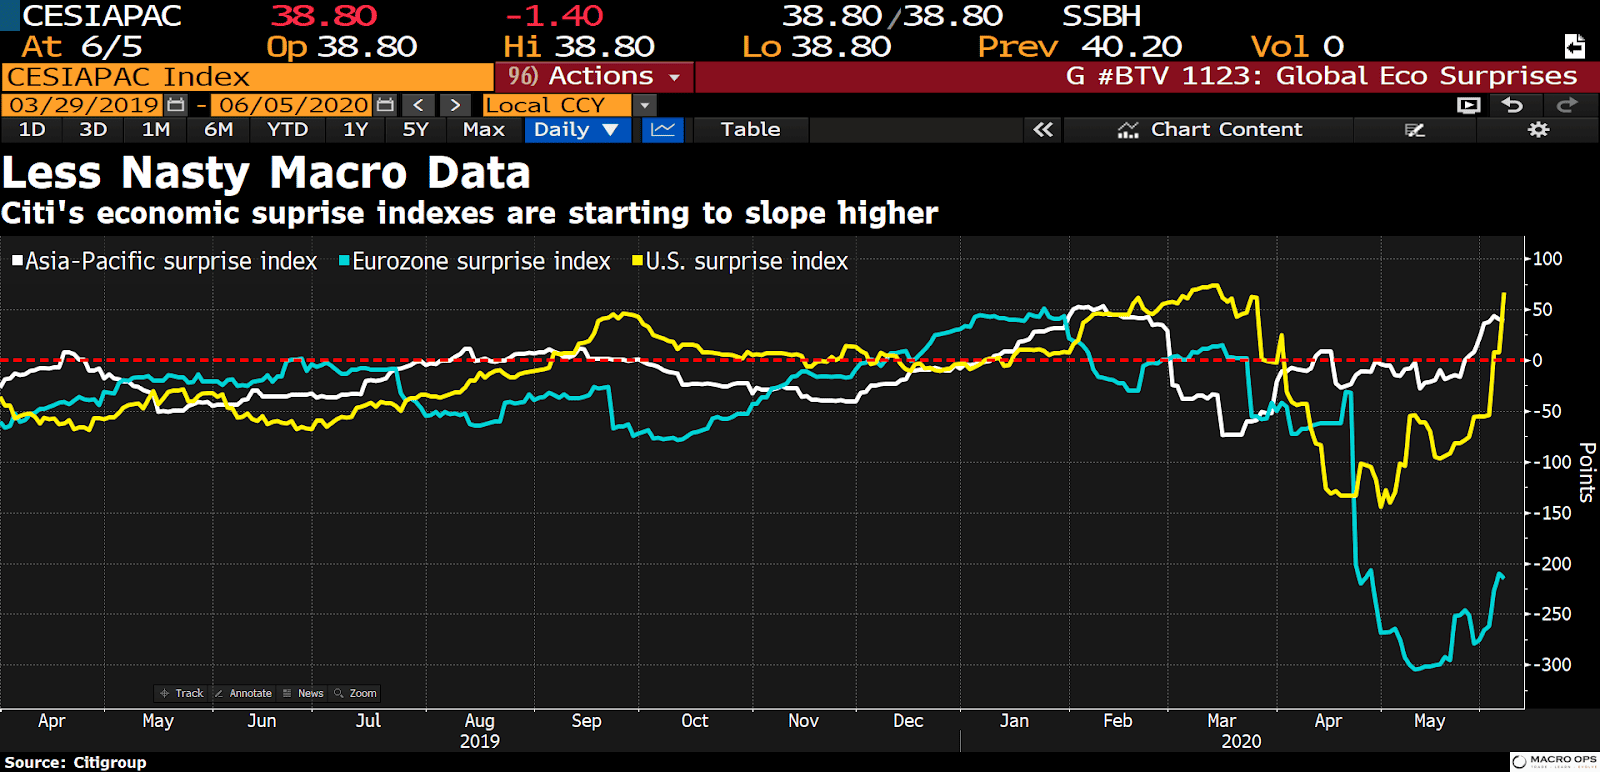
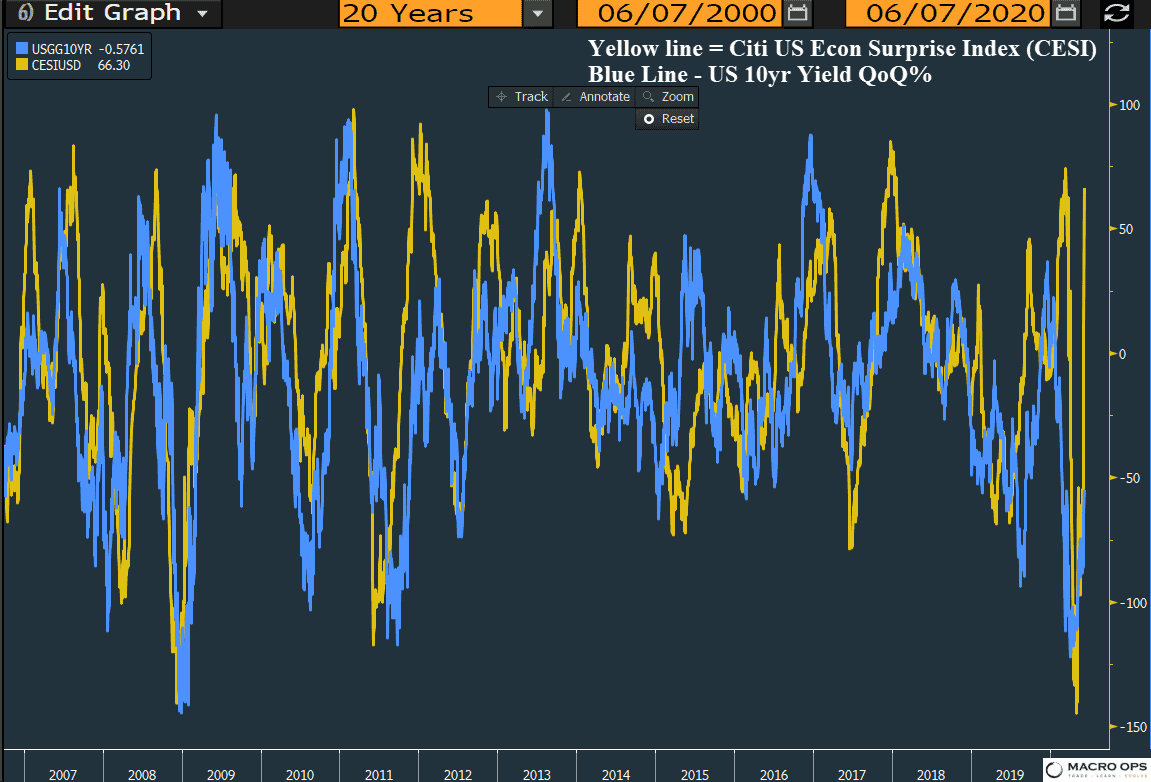
- Citi’s Economic Surprise Indices (CESI) have been turning up and rebounding from incredibly depressed levels. It’s now positive for the US and APAC region with Europe being the laggard.
- Economic prints positively surprising to the upside is typically a bearish bond development. Hence why bonds broke to the downside from their consolidation pattern last week. The chart below shows the strong correlation between the two. The yellow line is the CESI and the blue line is the QoQ% performance of the UST 10yr yield. We could see yields pop here…
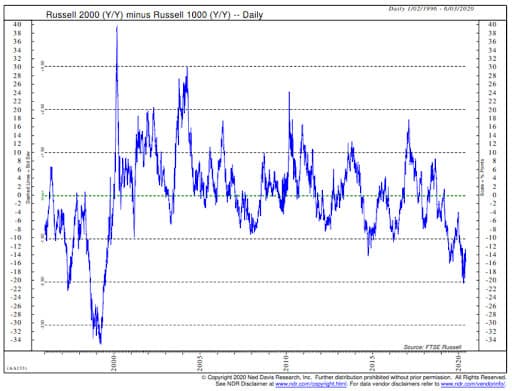
- Rising yields and a steepening curve typically coincide with outperformance from small caps and value. Which is what we’ve started to see over the last two weeks. This NDR chart shows there’s a lot of mean reversion left to unwind for small-caps. The Russell 2000/1000 hit its most oversold levels on a YoY% basis since July 1999 (chart via @edclissold).
- Bear market bottoms have occurred an average of 4-months before recession end dates. This chart from NDR shows small-cap relative to large-cap performance coming out of recessions (chart via @edclissold).

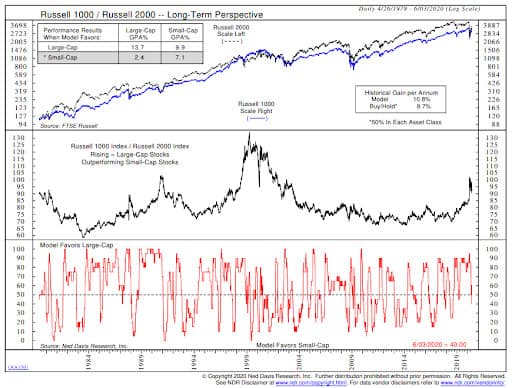
- NDR’s model now favors small-caps over large by the most in over 22 months (chart via @edclissold.)
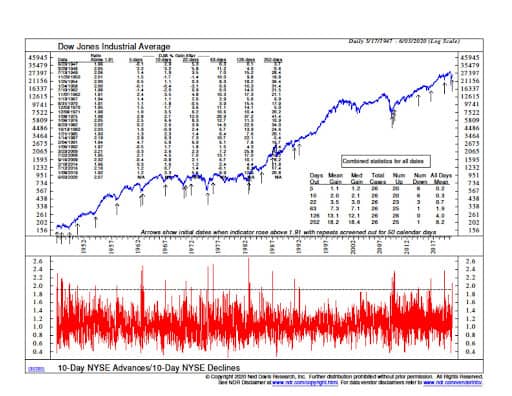
- Mark Minervini, shared another NDR (I know, I’m sharing a LOT of NDR charts this week!) chart showing more evidence of strong breadth thrusts — as I pointed out last week as well. Mark tweeted “NYSE momentum thrust just gave a buy signal yesterday with advancing stocks leading declining stocks by better than 2 to 1 over the last 10 trading sessions. This gives us a good indication that pullbacks in the S&P 500 should be viewed as buyable.” I agree…
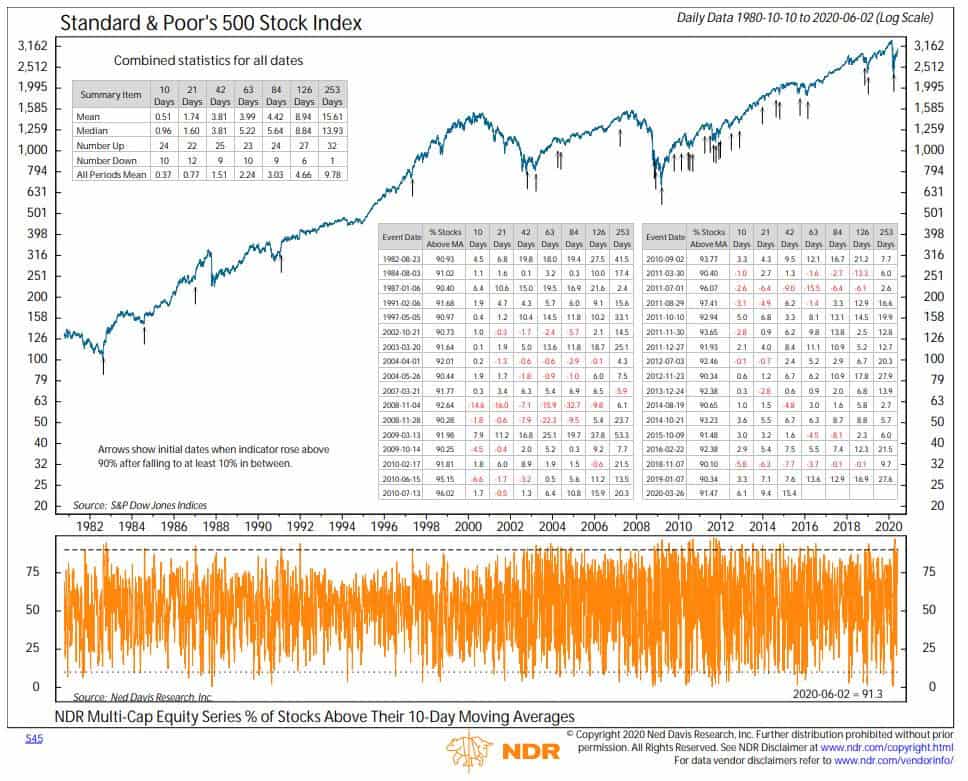
- And one last NDR Breadth Thrust chart, I promise. This one shows NDR’s Multi-Cap Equity Series % of stocks above their 10-day moving averages. The arrows on the chart mark past instances when this thrust has triggered. It’s got a pretty good bullish record.
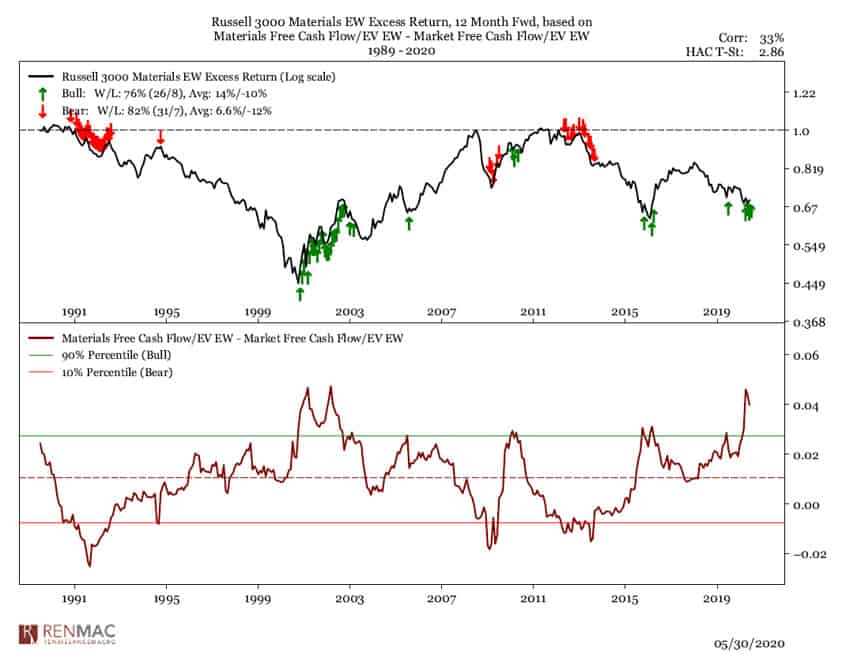
- Improving liquidity, strong breadth thrusts, and improving econ data typically leads to outperformance from cyclicals. Renaissance Macro Research shared this on the twitters last week and wrote “Materials, as an industry group, historically respond well to relative FCF/EV. Don’t look now, but it’s at levels last seen in early 2000 just as China’s voracious appetite for commodities exploded. Now we just need some improvement in relative performance (ex gold names)”.
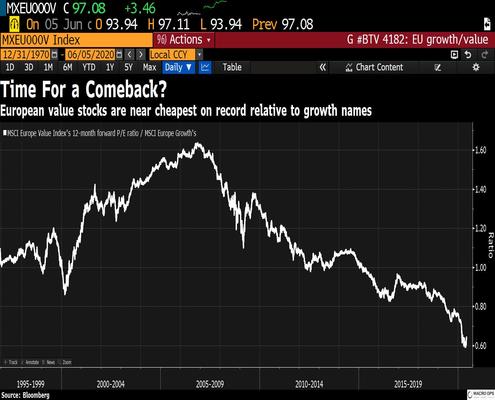
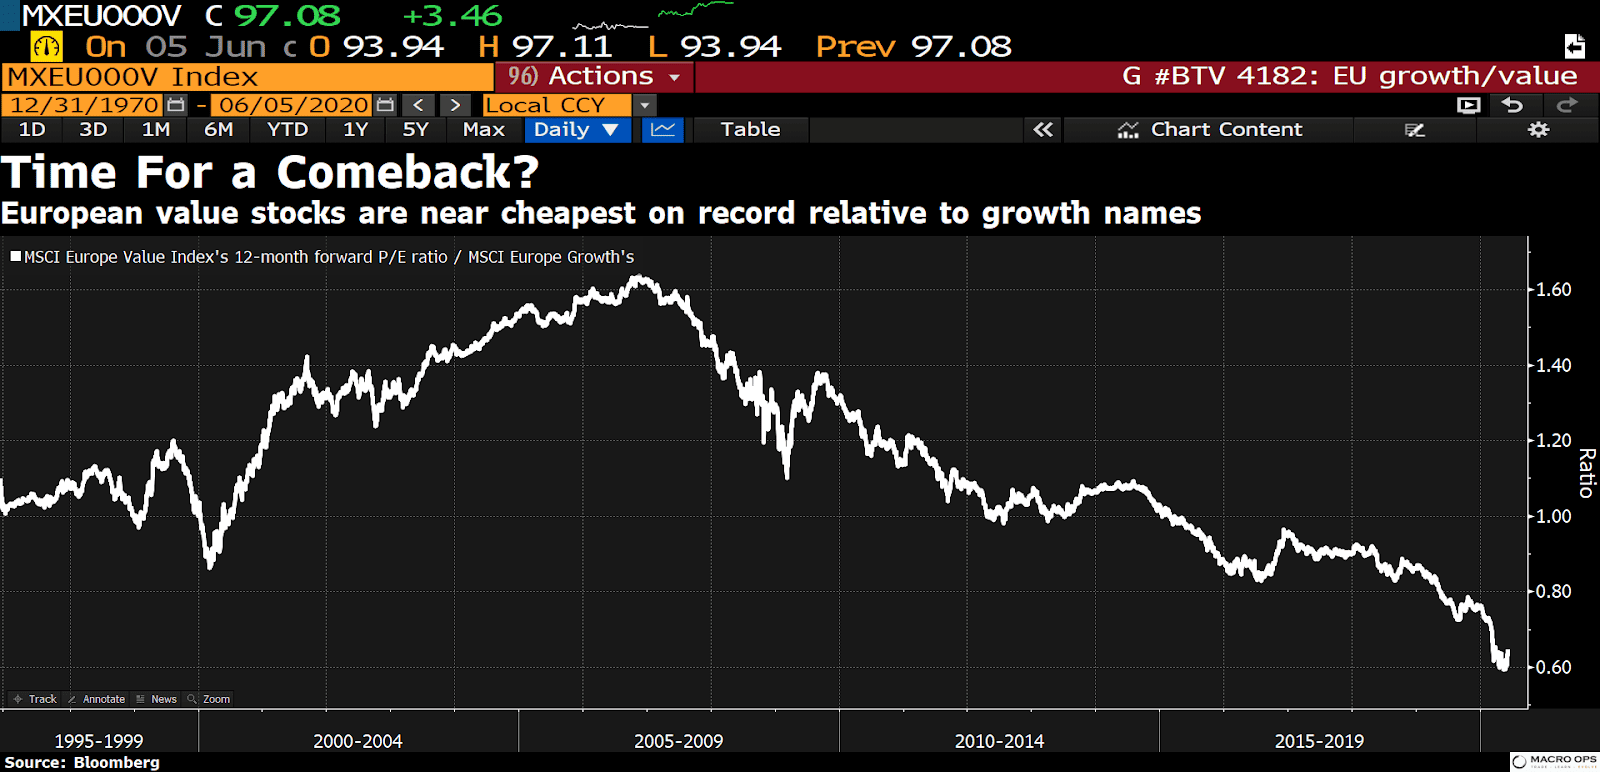
- I pointed out the other week in these pages how some European indices have the best looking charts at the moment. Well, it just so happens that European value stocks are about as cheap as they’ve ever been right now relative to growth names.
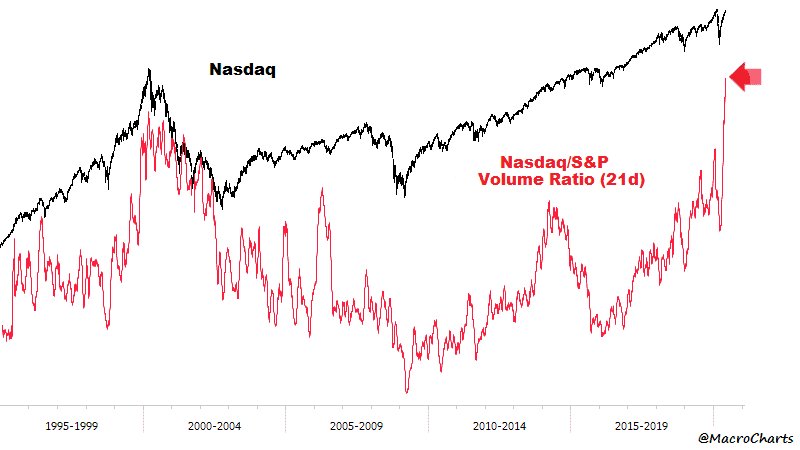
- @MacroCharts published a good post last week pointing out the growing signs of complacency in the options market. You can read it here. Here’s a chart from the post showing the extreme levels of relative volume we’re seeing in the Nasdaq.
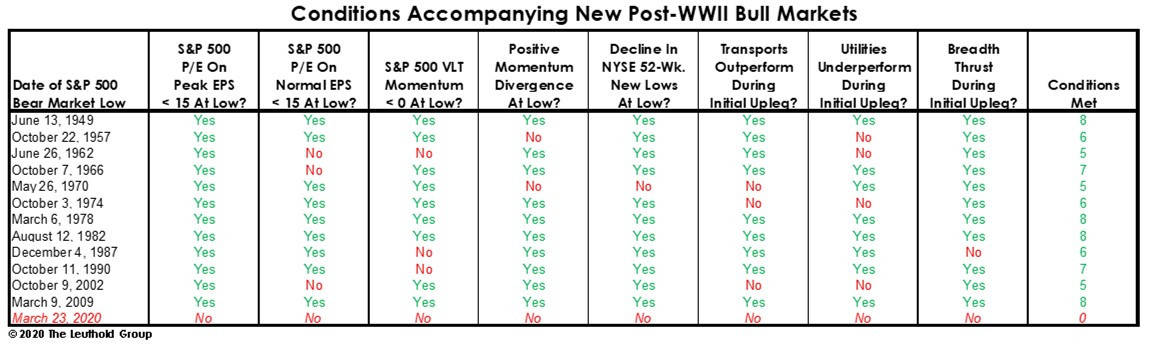
- Just so this post isn’t too one-sided on the bull front. This table from @LeutholdGroup offers the counterpoint. They write “Is this the first leg of a new bull market or 2nd-largest bear rally of 125 yrs? The March low was 0-for-5 w/ conditions typical at cyclical bear lows. And the 30% surge off the low met 0-of-3 dynamics that usually accompany the 1st leg of a bull market. 0-for-8 is not encouraging.”
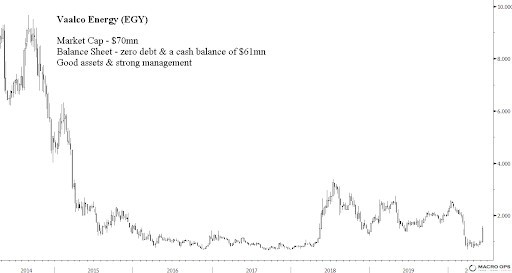
- There’s some good looking price action in energy names right now. If the global economy is indeed recovering then we’re going to see the oil market tighten significantly later this year. I like a lot of names in this space. One of my favorites is the E&P Vaalco Energy (EGY).
Stay safe out there and keep your head on a swivel.